Medtronic plc (MDT) and DexCom, Inc. (DXCM) are two prominent players in the medical devices industry, each driving innovation in healthcare technology. Medtronic, a global giant with a diverse portfolio, contrasts with DexCom’s specialized focus on continuous glucose monitoring systems. Their overlapping market in diabetes care and differing innovation strategies make for a compelling comparison. This article will help you identify which company holds the most promise for your investment portfolio.
Table of contents
Companies Overview
I will begin the comparison between Medtronic plc and DexCom, Inc. by providing an overview of these two companies and their main differences.
Medtronic plc Overview
Medtronic plc develops, manufactures, and sells device-based medical therapies globally. It operates across multiple segments including cardiovascular, medical surgical, neuroscience, and diabetes, offering products like cardiac pacemakers, surgical instruments, and insulin pumps. Founded in 1949 and headquartered in Dublin, Ireland, Medtronic holds a strong market position with a diversified portfolio targeting various medical specialties.
DexCom, Inc. Overview
DexCom, Inc. specializes in continuous glucose monitoring (CGM) systems for diabetes management, marketing products like DexCom G6 and the upcoming G7 system. Founded in 1999 and based in San Diego, California, DexCom focuses on innovation in diabetes care and digital health integration, serving patients and healthcare professionals primarily in the United States and internationally.
Key similarities and differences
Both companies operate in the medical devices industry with a focus on healthcare innovation. Medtronic offers a broader product range across multiple medical fields, while DexCom concentrates on diabetes-related monitoring technologies. Medtronic’s business is more diversified, whereas DexCom’s model emphasizes specialized glucose monitoring and digital health partnerships.
Income Statement Comparison
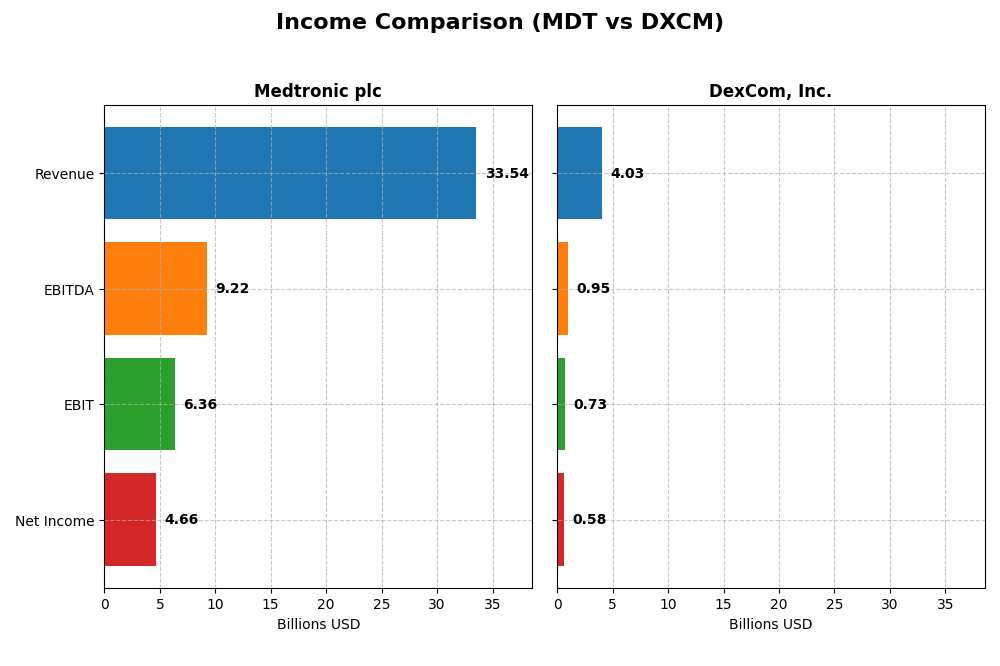
This table summarizes the key income statement metrics for Medtronic plc and DexCom, Inc. for their most recent fiscal years, providing a clear financial snapshot for comparison.
| Metric | Medtronic plc (MDT) | DexCom, Inc. (DXCM) |
|---|---|---|
| Market Cap | 125B | 26.4B |
| Revenue | 33.5B | 4.03B |
| EBITDA | 9.22B | 946M |
| EBIT | 6.36B | 728M |
| Net Income | 4.66B | 587.7M |
| EPS | 3.63 | 1.46 |
| Fiscal Year | 2025 | 2024 |
Income Statement Interpretations
Medtronic plc
Medtronic’s revenue rose steadily from $30.1B in 2021 to $33.5B in 2025, with net income increasing from $3.6B to $4.7B. Margins remained stable and favorable, with gross margin at 65.3% and net margin at 13.9% in 2025. The latest year showed moderate revenue growth of 3.6% but strong improvements in EBIT and net margin, reflecting enhanced profitability.
DexCom, Inc.
DexCom’s revenue expanded significantly from $1.9B in 2020 to $4.0B in 2024, with net income growing from $494M to $576M. Margins are favorable but less consistent, with a gross margin around 60.5% and net margin near 14.3%. The most recent year saw robust revenue growth of 11.3%, though EBIT and net margin declined slightly, indicating some pressure on operational efficiency.
Which one has the stronger fundamentals?
Medtronic demonstrates stronger fundamentals with consistent revenue and net income growth over five years, stable and improved margins, and favorable margin expansion in the latest period. DexCom shows impressive top-line growth but faces challenges in sustaining profitability margins, reflected in unfavorable EBIT and net margin changes recently. Overall, Medtronic’s income statement exhibits more balanced and sustained financial strength.
Financial Ratios Comparison
Below is a comparison of key financial ratios for Medtronic plc and DexCom, Inc. based on their most recent fiscal year data.
| Ratios | Medtronic plc (MDT) FY 2025 | DexCom, Inc. (DXCM) FY 2024 |
|---|---|---|
| ROE | 9.7% | 27.4% |
| ROIC | 6.1% | 10.2% |
| P/E | 23.4 | 54.6 |
| P/B | 2.27 | 14.97 |
| Current Ratio | 1.85 | 1.47 |
| Quick Ratio | 1.42 | 1.28 |
| D/E (Debt-to-Equity) | 0.59 | 1.23 |
| Debt-to-Assets | 31.1% | 39.9% |
| Interest Coverage | 8.2 | 31.6 |
| Asset Turnover | 0.37 | 0.62 |
| Fixed Asset Turnover | 4.91 | 2.88 |
| Payout Ratio | 77.0% | 0% |
| Dividend Yield | 3.3% | 0% |
Interpretation of the Ratios
Medtronic plc
Medtronic’s ratios show a slightly favorable profile with a 13.9% net margin and a 9.71% ROE marked as unfavorable. The company has a solid current ratio of 1.85 and strong interest coverage at 8.72, indicating good liquidity and debt servicing capacity. Dividend yield is favorable at 3.29%, supported by a consistent payout and no major risks of unsustainable distributions or excessive buybacks.
DexCom, Inc.
DexCom presents mixed ratios with a favorable 14.29% net margin and an impressive 27.4% ROE, but challenges include an unfavorable PE of 54.61 and a high debt-to-equity ratio of 1.23. The company does not pay dividends, reflecting a reinvestment strategy focused on growth and R&D, which aligns with its high research and development expense ratio and lack of shareholder returns via dividends.
Which one has the best ratios?
Medtronic exhibits a more balanced and slightly favorable ratio profile, especially in liquidity and dividend yield, while DexCom shows stronger profitability but carries higher valuation multiples and debt concerns. Medtronic’s stable dividend and financial stability contrast with DexCom’s growth focus and riskier financial metrics, resulting in differing risk-return trade-offs.
Strategic Positioning
This section compares the strategic positioning of Medtronic plc and DexCom, Inc., covering Market position, Key segments, and Exposure to technological disruption:
Medtronic plc
- Leading medical device company with a large market cap of 125B, facing moderate competitive pressure.
- Diversified product portfolio including cardiac, diabetes, surgical, and neuroscience devices driving business growth.
- Moderate exposure due to broad device portfolio and innovation in software, robotics, and monitoring technologies.
DexCom, Inc.
- Smaller market cap of 26B, operating in a niche continuous glucose monitoring segment with intense competition.
- Focused exclusively on continuous glucose monitoring systems and related digital health integrations.
- High exposure to disruption with continuous development of next-gen CGM systems and collaboration on glucose monitoring.
Medtronic plc vs DexCom, Inc. Positioning
Medtronic has a diversified portfolio across multiple medical device segments, offering stability but facing broad competition. DexCom concentrates on diabetes monitoring technology with a specialized focus, which could mean higher innovation risk and reward.
Which has the best competitive advantage?
Both companies show slightly unfavorable MOAT evaluations. Medtronic has growing profitability despite value destruction, while DexCom faces declining ROIC and value shedding, indicating Medtronic currently sustains a marginally stronger competitive advantage.
Stock Comparison
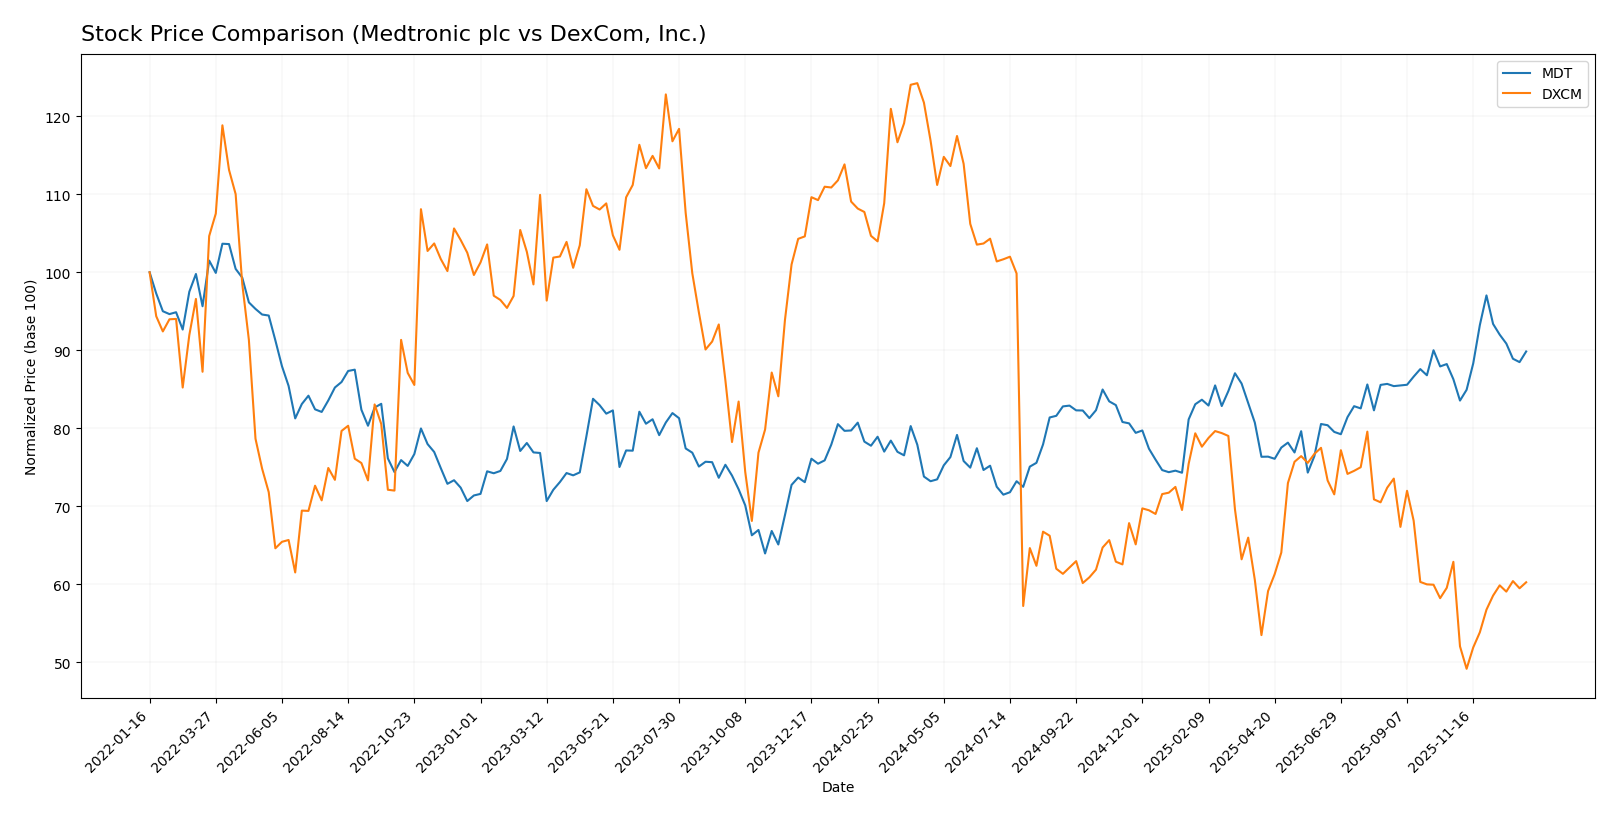
The stock price movements of Medtronic plc and DexCom, Inc. over the past year reveal contrasting trading dynamics, with Medtronic showing sustained gains while DexCom experienced notable declines.
Trend Analysis
Medtronic plc’s stock price increased by 15.53% over the past 12 months, indicating a bullish trend with acceleration and moderate volatility (5.91 std deviation). Its price ranged from 77.61 to 105.33.
DexCom, Inc.’s stock price declined by 42.42% over the past 12 months, reflecting a bearish trend with acceleration and high volatility (22.59 std deviation). The price fluctuated between 55.0 and 138.93.
Comparing these stocks, Medtronic delivered the highest market performance with a positive trend, while DexCom faced a significant downturn over the same period.
Target Prices
Here is the consensus target price overview for Medtronic plc and DexCom, Inc. from verified analysts.
| Company | Target High | Target Low | Consensus |
|---|---|---|---|
| Medtronic plc | 120 | 103 | 111.67 |
| DexCom, Inc. | 99 | 75 | 85.36 |
Analysts expect Medtronic’s stock to trade significantly above its current price of $97.53, while DexCom’s consensus target of $85.36 also suggests upside from its $67.40 market price. Both show positive growth potential.
Analyst Opinions Comparison
This section compares analysts’ ratings and grades for Medtronic plc and DexCom, Inc.:
Rating Comparison
Medtronic plc Rating
- Rating: B, classified as Very Favorable.
- Discounted Cash Flow Score: 4, indicating Favorable.
- ROE Score: 3, reflecting a Moderate efficiency.
- ROA Score: 4, showing Favorable asset utilization.
- Debt To Equity Score: 1, rated Very Unfavorable.
- Overall Score: 3, assessed as Moderate.
DexCom, Inc. Rating
- Rating: B+, classified as Very Favorable.
- Discounted Cash Flow Score: 4, indicating Favorable.
- ROE Score: 5, indicating Very Favorable efficiency.
- ROA Score: 5, showing Very Favorable asset utilization.
- Debt To Equity Score: 1, rated Very Unfavorable.
- Overall Score: 3, assessed as Moderate.
Which one is the best rated?
Based strictly on the provided data, DexCom, Inc. holds a higher rating (B+) with superior ROE and ROA scores, while both companies share the same overall and DCF scores. Both face very unfavorable debt-to-equity scores.
Scores Comparison
The following table compares the Altman Z-Score and Piotroski Score of Medtronic plc and DexCom, Inc.:
MDT Scores
- Altman Z-Score: 3.20, indicating a safe zone with low bankruptcy risk.
- Piotroski Score: 7, reflecting strong financial health.
DXCM Scores
- Altman Z-Score: 4.70, indicating a safe zone with very low bankruptcy risk.
- Piotroski Score: 8, reflecting very strong financial health.
Which company has the best scores?
Based on the provided data, DexCom has a higher Altman Z-Score and a stronger Piotroski Score compared to Medtronic, indicating relatively better financial stability and strength.
Grades Comparison
Here is the recent grading overview for Medtronic plc and DexCom, Inc.:
Medtronic plc Grades
The following table summarizes recent grades from recognized financial institutions for Medtronic plc:
| Grading Company | Action | New Grade | Date |
|---|---|---|---|
| Bernstein | Maintain | Outperform | 2026-01-09 |
| Barclays | Maintain | Overweight | 2026-01-08 |
| William Blair | Upgrade | Outperform | 2026-01-06 |
| Truist Securities | Maintain | Hold | 2025-12-18 |
| Truist Securities | Maintain | Hold | 2025-11-20 |
| Barclays | Maintain | Overweight | 2025-11-20 |
| UBS | Maintain | Neutral | 2025-11-19 |
| Morgan Stanley | Maintain | Overweight | 2025-11-19 |
| Goldman Sachs | Upgrade | Neutral | 2025-11-19 |
| Wells Fargo | Maintain | Overweight | 2025-11-19 |
Medtronic’s grades generally trend toward positive ratings, with multiple “Outperform” and “Overweight” evaluations and few holds, indicating moderate analyst confidence.
DexCom, Inc. Grades
Below is the recent grading data for DexCom, Inc. from reputable grading companies:
| Grading Company | Action | New Grade | Date |
|---|---|---|---|
| Bernstein | Maintain | Outperform | 2026-01-09 |
| Mizuho | Maintain | Outperform | 2025-12-17 |
| Citigroup | Maintain | Buy | 2025-12-11 |
| Morgan Stanley | Upgrade | Overweight | 2025-12-02 |
| Morgan Stanley | Maintain | Equal Weight | 2025-11-10 |
| Argus Research | Maintain | Buy | 2025-11-07 |
| UBS | Maintain | Buy | 2025-11-03 |
| Barclays | Maintain | Equal Weight | 2025-11-03 |
| Truist Securities | Maintain | Buy | 2025-11-03 |
| RBC Capital | Maintain | Outperform | 2025-10-31 |
DexCom’s grades consistently show strong positive sentiment, with several “Buy” and “Outperform” ratings and an upgrade to “Overweight,” reflecting solid analyst support.
Which company has the best grades?
Both companies have predominantly positive analyst grades with consensus “Buy” ratings. DexCom, Inc. shows a slightly higher concentration of “Buy” and “Outperform” ratings, suggesting stronger analyst enthusiasm, which could indicate a more optimistic outlook for investors compared to Medtronic plc.
Strengths and Weaknesses
Below is a comparison table highlighting key strengths and weaknesses of Medtronic plc (MDT) and DexCom, Inc. (DXCM) based on the most recent financial and operational data.
| Criterion | Medtronic plc (MDT) | DexCom, Inc. (DXCM) |
|---|---|---|
| Diversification | Highly diversified product portfolio across cardiac, vascular, diabetes, neuroscience, and medical surgical segments. | Focused primarily on continuous glucose monitoring systems; less diversified. |
| Profitability | Moderate net margin (13.9%), neutral ROIC (6.08%), slightly unfavorable overall moat status. | Higher net margin (14.3%), strong ROIC (10.2%), but declining profitability trend and slightly unfavorable moat. |
| Innovation | Steady innovation with growing ROIC trend, broad medical device applications. | Strong innovation in diabetes technology but facing challenges in maintaining ROIC growth. |
| Global presence | Extensive global footprint with consistent revenue growth in multiple geographic and product segments. | More concentrated market presence, primarily in diabetes care. |
| Market Share | Leading position in cardiac and vascular devices, significant market shares in other medical segments. | Leading player in continuous glucose monitoring, but niche market limits broader share. |
Key takeaways: Medtronic offers stability through diversification and a growing profitability trend despite slightly unfavorable value creation. DexCom excels in profitability metrics but faces risks from declining ROIC and a narrow market focus. Investors should weigh MDT’s diversification against DXCM’s innovation-driven growth potential and associated risks.
Risk Analysis
Below is a comparative table highlighting key risk factors for Medtronic plc (MDT) and DexCom, Inc. (DXCM) based on the most recent data available.
| Metric | Medtronic plc (MDT) | DexCom, Inc. (DXCM) |
|---|---|---|
| Market Risk | Beta 0.73 (lower volatility) | Beta 1.48 (higher volatility) |
| Debt Level | Moderate debt-to-equity 0.59 | Higher debt-to-equity 1.23 |
| Regulatory Risk | High; medical devices subject to strict FDA and international regulations | High; CGM tech requires regulatory approvals and compliance |
| Operational Risk | Large scale, complex supply chain; 95K employees | Smaller scale, focused on CGM; 10.2K employees |
| Environmental Risk | Moderate; manufacturing impact and sustainability initiatives ongoing | Moderate; focus on device production with lower footprint |
| Geopolitical Risk | Exposure due to global operations headquartered in Ireland | U.S.-centric but with international sales |
Medtronic’s most impactful risks are regulatory scrutiny and operational complexity from global scale, but its low beta indicates lower market volatility. DexCom shows higher market risk and financial leverage, with a focus on innovation in CGM technology, making regulatory risk and debt load more pressing. Both companies remain financially stable with strong Altman Z-scores in the safe zone, but DexCom’s higher beta and debt warrant cautious risk management.
Which Stock to Choose?
Medtronic plc shows a stable income evolution with favorable margins and profitability metrics, including a 13.9% net margin and a slightly favorable overall financial ratios evaluation. Despite a net debt to EBITDA of 2.85, the company’s rating is very favorable, though it is shedding value according to its slightly unfavorable MOAT status.
DexCom, Inc. exhibits strong income growth, with a 14.29% net margin and very favorable return ratios, including a 27.4% ROE. However, its financial ratios are balanced between favorable and unfavorable, with a neutral global opinion and a slightly unfavorable MOAT due to declining ROIC, despite a very favorable rating.
Investors focused on stable profitability and consistent income quality might find Medtronic’s slightly favorable financial ratios and growing ROIC more appealing, while those seeking higher growth potential could interpret DexCom’s strong returns and rapid revenue growth as attractive, albeit with higher risk given its mixed financial metrics.
Disclaimer: Investment carries a risk of loss of initial capital. The past performance is not a reliable indicator of future results. Be sure to understand risks before making an investment decision.
Go Further
I encourage you to read the complete analyses of Medtronic plc and DexCom, Inc. to enhance your investment decisions: