Home > Comparison > Healthcare > EW vs DXCM
The strategic rivalry between Edwards Lifesciences Corporation and DexCom, Inc. shapes the future of the healthcare medical devices sector. Edwards operates as a capital-intensive leader in structural heart disease solutions, while DexCom focuses on high-growth continuous glucose monitoring systems. This head-to-head highlights a contrast between established market dominance and innovative expansion. This analysis aims to identify which trajectory offers the superior risk-adjusted potential for a diversified portfolio.
Table of contents
Companies Overview
Edwards Lifesciences and DexCom are pivotal players in the medical devices sector, shaping healthcare innovation in 2026.
Edwards Lifesciences Corporation: Leader in Structural Heart Solutions
Edwards Lifesciences specializes in structural heart disease devices and critical care monitoring. Its core revenue stems from transcatheter heart valve replacements and repair systems, including PASCAL and Cardioband. The company’s strategic focus emphasizes minimally invasive therapies and advanced hemodynamic monitoring to improve surgical outcomes globally.
DexCom, Inc.: Innovator in Diabetes Management
DexCom leads in continuous glucose monitoring (CGM) systems, primarily serving diabetes patients and healthcare providers. Its revenue engine revolves around products like DexCom G6 and the upcoming G7, plus digital integration through real-time APIs. In 2026, DexCom concentrates on expanding CGM adoption and enhancing remote patient monitoring with cloud-connected devices.
Strategic Collision: Similarities & Divergences
Both companies prioritize medical device innovation, but Edwards deploys a closed, procedure-focused ecosystem while DexCom embraces open digital integration. Their battleground lies in specialized healthcare niches—cardiac interventions versus diabetes management technology. Edwards offers a capital-intensive, device-heavy profile, whereas DexCom presents a scalable, software-driven model with higher beta volatility.
Income Statement Comparison
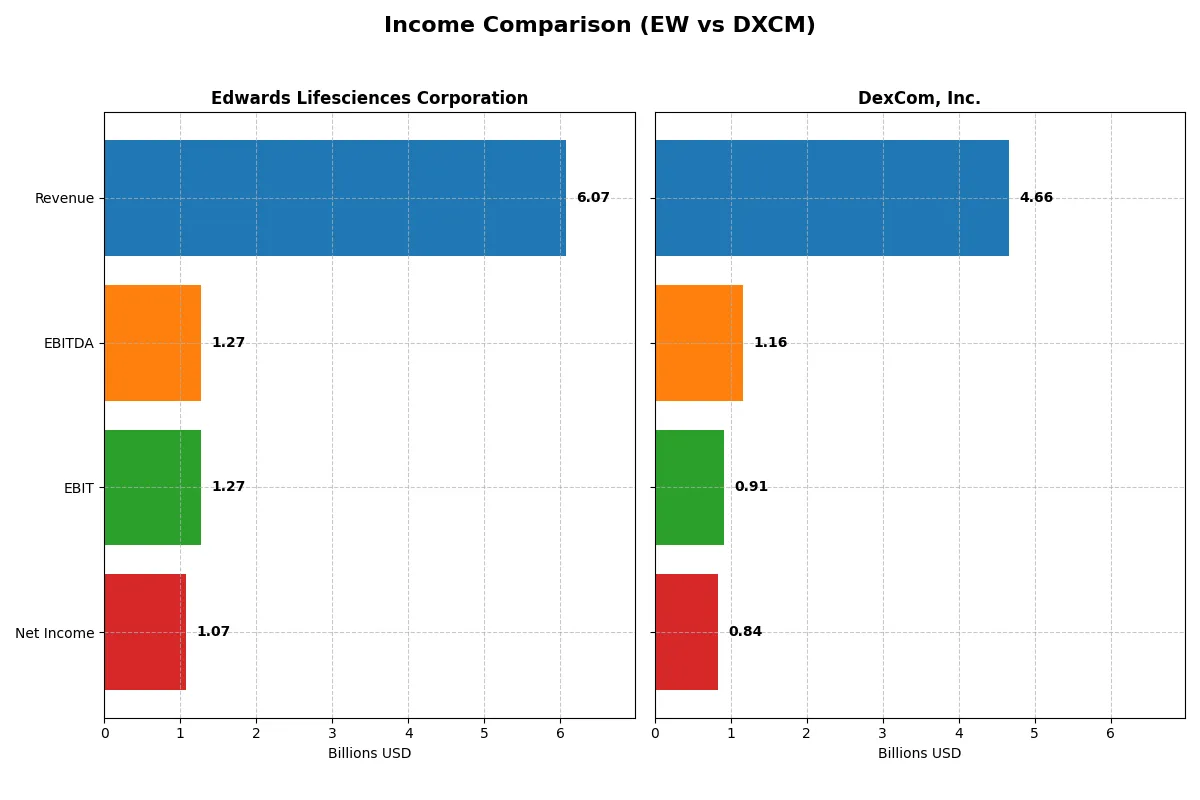
This data dissects the core profitability and scalability of Edwards Lifesciences and DexCom, revealing who dominates the bottom line in 2025:
| Metric | Edwards Lifesciences (EW) | DexCom (DXCM) |
|---|---|---|
| Revenue | 6.07B | 4.66B |
| Cost of Revenue | 1.33B | 1.86B |
| Operating Expenses | 3.10B | 1.89B |
| Gross Profit | 4.74B | 2.80B |
| EBITDA | 1.27B | 1.16B |
| EBIT | 1.27B | 912M |
| Interest Expense | 0 | 0 |
| Net Income | 1.07B | 836M |
| EPS | 1.84 | 2.14 |
| Fiscal Year | 2025 | 2025 |
Income Statement Analysis: The Bottom-Line Duel
This comparison will reveal which company’s income statement reflects superior operational efficiency and sustained profitability momentum.
Edwards Lifesciences Corporation Analysis
Edwards Lifesciences shows steady revenue growth, reaching $6.07B in 2025, but net income declined to $1.07B from a peak of $4.17B in 2024. Gross margin stays robust near 78%, and net margin holds at 17.7%. However, the latest year signals weakening profitability and a notable dip in EBIT and EPS, indicating margin pressure despite revenue gains.
DexCom, Inc. Analysis
DexCom delivers strong revenue momentum, surging 15.6% to $4.66B in 2025, with net income climbing to $836M. Gross margin at 60.1% and net margin at 17.9% remain healthy. The company improves EBIT and net margin by over 25% year-over-year, reflecting better operational leverage and consistent earnings growth, supported by aggressive R&D and controlled expenses.
Growth Resilience vs. Margin Strength
DexCom outpaces Edwards in revenue and profit growth, showcasing superior momentum and efficiency improvements. Edwards maintains higher gross margins but struggles with recent earnings volatility. Investors seeking growth and expanding profitability may favor DexCom’s trajectory, while Edwards appeals more for margin stability in a mature phase.
Financial Ratios Comparison
These vital ratios act as a diagnostic tool to expose underlying fiscal health, valuation premiums, and capital efficiency for clear comparative insight:
| Ratios | Edwards Lifesciences (EW) | DexCom (DXCM) |
|---|---|---|
| ROE | 41.8% (2024) | 30.5% (2025) |
| ROIC | 10.7% (2024) | 16.6% (2025) |
| P/E | 10.6 (2024) | 31.0 (2025) |
| P/B | 4.43 (2024) | 9.43 (2025) |
| Current Ratio | 4.18 (2024) | 1.88 (2025) |
| Quick Ratio | 3.45 (2024) | 1.59 (2025) |
| D/E | 0.07 (2024) | 0.51 (2025) |
| Debt-to-Assets | 5.4% (2024) | 22.2% (2025) |
| Interest Coverage | 69.6 (2024) | N/A (0 reported) |
| Asset Turnover | 0.42 (2024) | 0.74 (2025) |
| Fixed Asset Turnover | 3.05 (2024) | 2.85 (2025) |
| Payout ratio | 0% (2024) | 0% (2025) |
| Dividend yield | 0% (2024) | 0% (2025) |
| Fiscal Year | 2024 | 2025 |
Efficiency & Valuation Duel: The Vital Signs
Financial ratios act as a company’s DNA, exposing hidden risks and operational strength that shape investor confidence and valuation.
Edwards Lifesciences Corporation
Edwards displays a solid net margin of 17.69% but lacks reported ROE and ROIC, signaling caution on profitability sustainability. The P/E ratio at 46.44 suggests an expensive valuation. Edwards offers no dividend, relying heavily on a 19.4% R&D-to-revenue reinvestment strategy to fuel future growth.
DexCom, Inc.
DexCom delivers robust profitability, with a 17.94% net margin, 30.46% ROE, and 16.61% ROIC, reflecting efficient capital use. Its valuation is stretched, with a P/E of 30.97 and a high price-to-book of 9.43. DexCom pays no dividend, emphasizing growth via sustained R&D investment at 12.85% of revenue.
Premium Valuation vs. Operational Safety
DexCom leads with strong profitability and efficient capital returns, balancing moderate debt and liquidity. Edwards’ higher P/E and absence of profitability metrics pose risks despite R&D focus. Investors seeking growth with operational safety may prefer DexCom’s profile, while Edwards suits those banking on innovation-driven expansion.
Which one offers the Superior Shareholder Reward?
I observe that neither Edwards Lifesciences (EW) nor DexCom (DXCM) pays dividends. Both reinvest heavily to fuel growth. EW’s free cash flow per share hits 0.49, with moderate buybacks implied by its stable leverage. DXCM shows stronger buyback appetite, supported by 2.76 FCF per share and higher leverage. EW’s distribution relies on cautious capital allocation with a pristine balance sheet. DXCM pursues aggressive share repurchases financed partly through debt, risking financial flexibility. For 2026, I see EW’s conservative reinvestment as more sustainable long-term. DXCM offers higher near-term total return via buybacks but with elevated risk. I favor Edwards for durable shareholder value and prudent capital strategy.
Comparative Score Analysis: The Strategic Profile
The radar chart reveals the fundamental DNA and trade-offs of both Edwards Lifesciences and DexCom, highlighting their financial strengths and weaknesses:
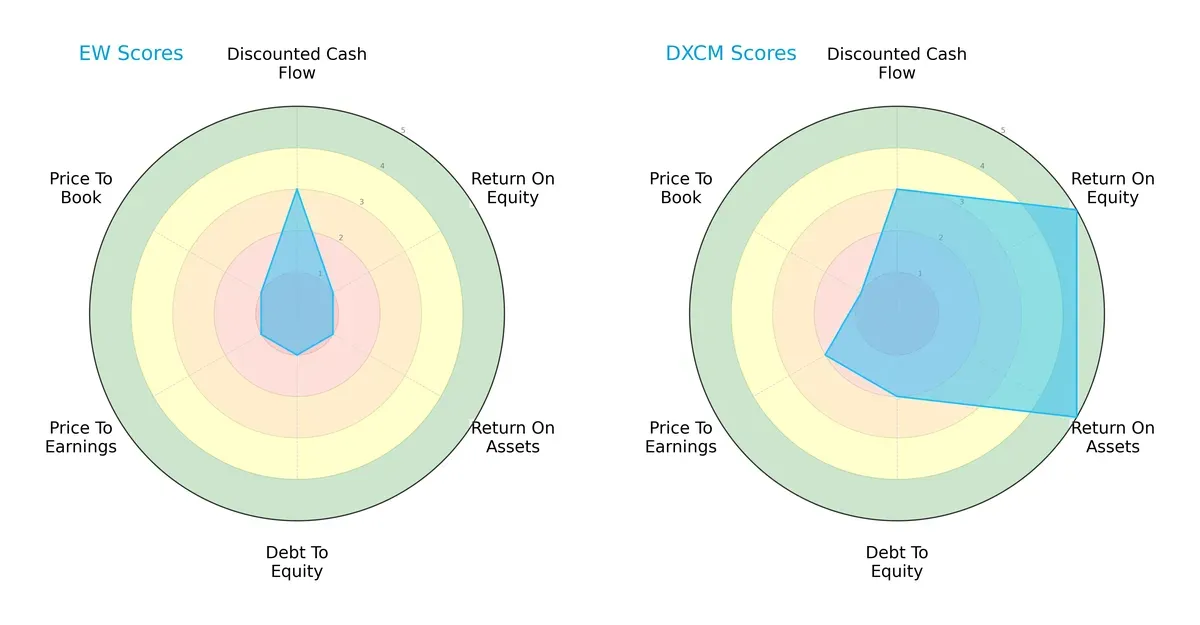
DexCom dominates with superior profitability metrics, scoring 5 in ROE and ROA, while Edwards Lifesciences lags at 1. Both match moderately on discounted cash flow (3). Edwards scores very low across debt/equity (1) and valuation metrics, indicating financial strain. DexCom presents a more balanced profile, leveraging strong operational efficiency despite slightly higher debt risk.
Bankruptcy Risk: Solvency Showdown
DexCom’s Altman Z-Score of 6.83 versus Edwards Lifesciences’ 11.51 signals both firms reside comfortably in the safe zone:
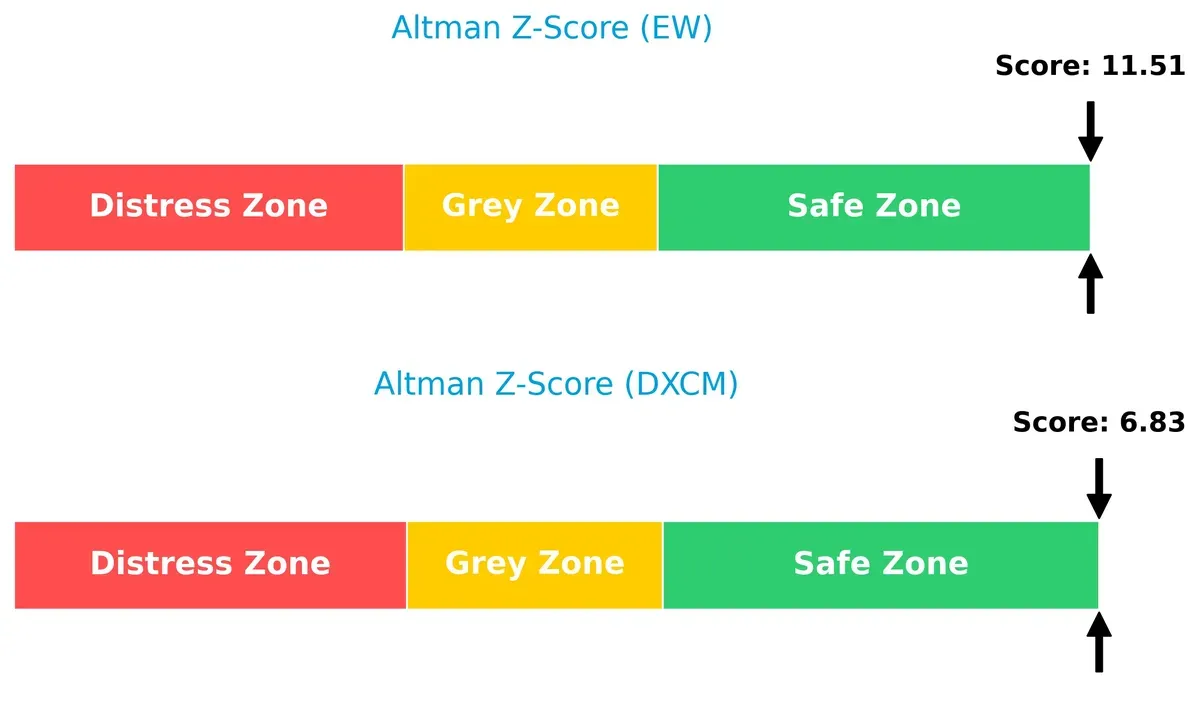
Edwards’ exceptionally high score implies robust solvency and a strong buffer against economic downturns. DexCom’s lower yet safe score suggests sound financial stability but comparatively higher risk, reflecting its growth phase capital structure.
Financial Health: Quality of Operations
DexCom’s Piotroski F-Score of 8 versus Edwards Lifesciences’ 4 highlights a stark difference in operational quality and internal financial health:
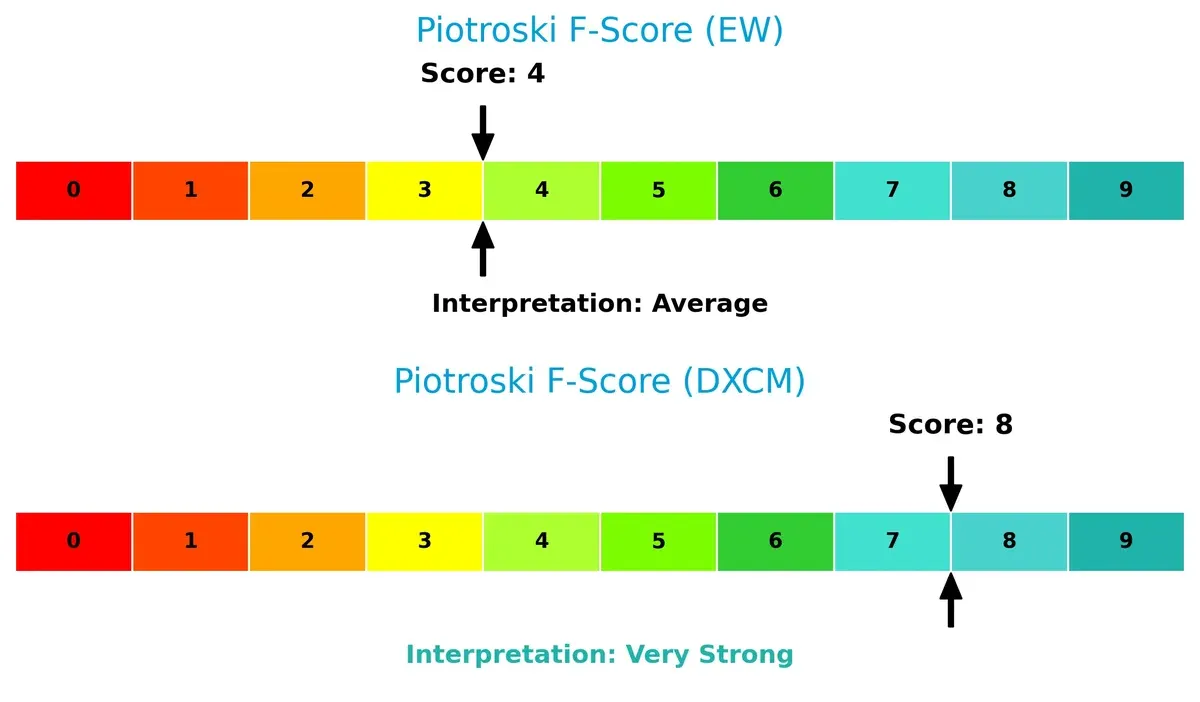
DexCom exhibits very strong fundamentals, signaling efficient profitability, liquidity, and leverage management. Edwards’ average score raises red flags on internal metrics, underscoring potential operational weaknesses investors must monitor closely.
How are the two companies positioned?
This section dissects the operational DNA of EW and DXCM by comparing their revenue distribution and internal strengths and weaknesses. The goal is to confront their economic moats and identify which model delivers the most resilient competitive advantage today.
Revenue Segmentation: The Strategic Mix
The following visual comparison dissects how both firms diversify their income streams and where their primary sector bets lie:
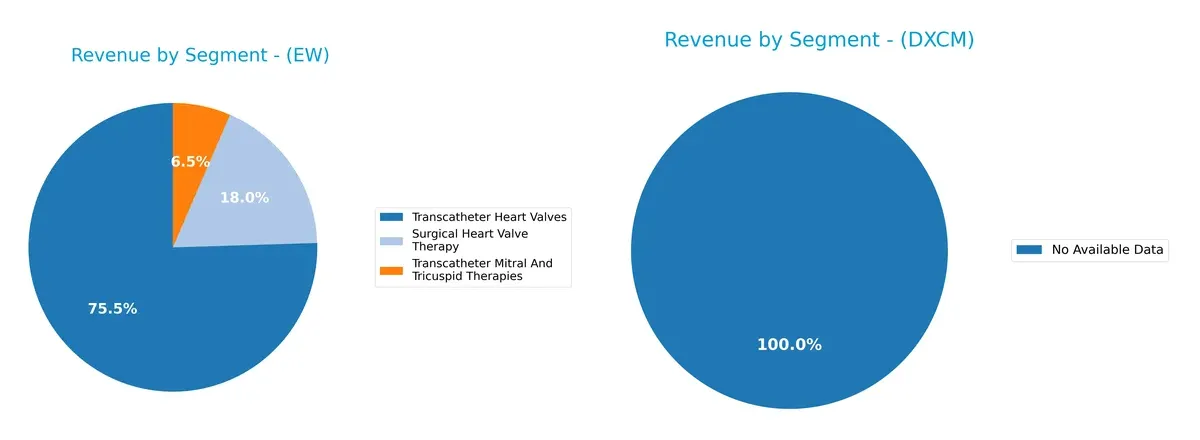
Edwards Lifesciences Corporation (EW) anchors its revenue with Transcatheter Heart Valves at $4.1B, complemented by Surgical Heart Valve Therapy at $981M and Transcatheter Mitral and Tricuspid Therapies at $352M. This mix reveals a strong focus on heart valve technologies with some diversification. DexCom, Inc. (DXCM) lacks available segmentation data, preventing a direct comparison. EW’s concentration in heart valve therapies suggests a robust infrastructure dominance but exposes some concentration risk.
Strengths and Weaknesses Comparison
This table compares the Strengths and Weaknesses of Edwards Lifesciences Corporation (EW) and DexCom, Inc. (DXCM):
EW Strengths
- Strong revenue from diversified heart valve therapy segments
- Significant global presence with large US and Europe sales
- Favorable net margin at 17.69%
- Low debt and strong interest coverage
DXCM Strengths
- High profitability with favorable net margin at 17.94%
- Strong ROE (30.46%) and ROIC (16.61%)
- Good liquidity ratios (current 1.88, quick 1.59)
- Global presence with growing Non-US sales
EW Weaknesses
- Unfavorable ROE and ROIC at zero
- Poor liquidity ratios (current and quick ratio at 0)
- Unavailable WACC data
- High P/E ratio at 46.44
- Low asset turnover and no dividend yield
DXCM Weaknesses
- Unfavorable WACC at 10.27%
- High P/E (30.97) and P/B (9.43) ratios
- Moderate leverage (debt to assets 22.23%)
- No dividend yield reported
Overall, EW shows strength in diversified product lines and geographic reach but suffers from weak profitability metrics and liquidity concerns. DXCM delivers superior profitability and liquidity but faces valuation and capital cost challenges. These factors shape each company’s strategic focus on financial health and market positioning.
The Moat Duel: Analyzing Competitive Defensibility
A structural moat protects long-term profits from competitive erosion. Without it, market gains vanish quickly. Here’s how Edwards Lifesciences and DexCom defend their turf:
Edwards Lifesciences Corporation: Intangible Assets and Innovation Moat
Edwards leverages patented heart valve technologies, reflected in stable 78% gross margins and 18% net margins. However, declining ROIC signals rising competition risks in 2026.
DexCom, Inc.: Network Effects and Rapid Growth Moat
DexCom’s continuous glucose monitoring systems create strong network effects, driving 19.6% EBIT margin and 6.3% ROIC above WACC. Its 2026 outlook includes expanding digital health integrations.
Verdict: Patents vs. Network Effects in Med-Tech Innovation
DexCom’s growing ROIC and sustained revenue surge reveal a deeper moat than Edwards’ intangible assets, which face margin pressure. DexCom is better positioned to defend and expand market share.
Which stock offers better returns?
Over the past 12 months, both Edwards Lifesciences and DexCom experienced significant price shifts, with contrasting trend accelerations and distinct trading volume dynamics shaping their market journeys.
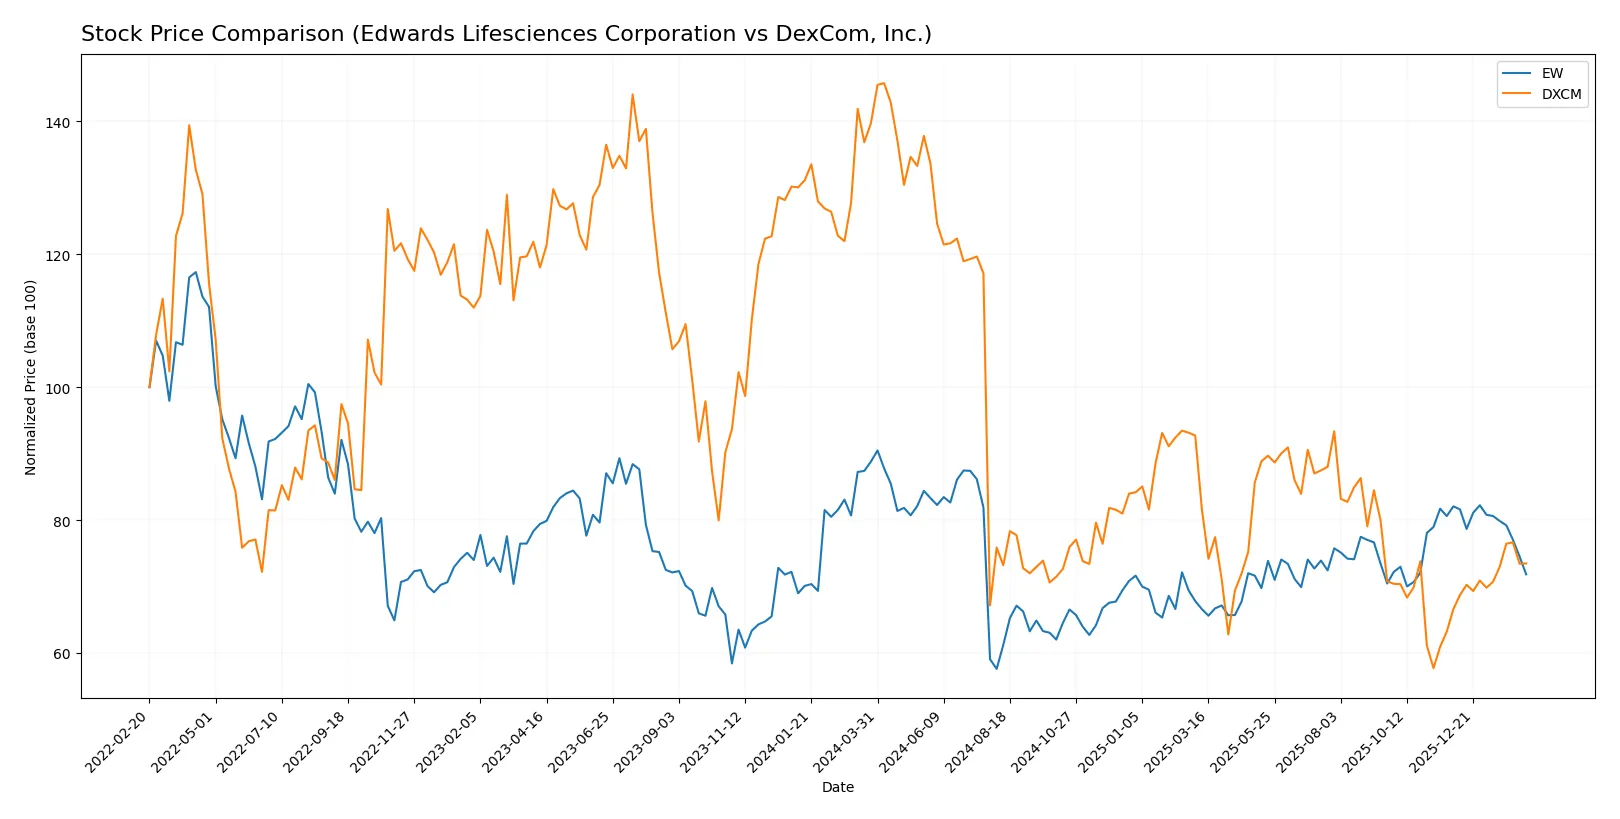
Trend Comparison
Edwards Lifesciences (EW) shows a bearish trend with a 19.11% price decline over the last year. The trend decelerated, with a recent 12.46% drop and moderate volatility (7.99 std deviation).
DexCom (DXCM) also exhibits a bearish trend, down 47.42% over 12 months. However, its trend accelerates, with recent recovery showing a 10.32% gain and higher volatility (20.95 std deviation).
DexCom delivered the weakest overall performance but shows a recent bullish reversal. Edwards Lifesciences declined less but continues a decelerating bearish trend.
Target Prices
Analysts present a cautiously optimistic consensus for Edwards Lifesciences and DexCom, reflecting growth potential in medical devices.
| Company | Target Low | Target High | Consensus |
|---|---|---|---|
| Edwards Lifesciences Corporation | 87 | 110 | 96.38 |
| DexCom, Inc. | 72 | 95 | 85.82 |
The target consensus for Edwards Lifesciences at 96.38 suggests a 27% upside from the current 75.87 price. DexCom’s consensus at 85.82 implies a 23% potential gain versus its current 70.02 price.

Don’t Let Luck Decide Your Entry Point
Optimize your entry points with our advanced ProRealTime indicators. You’ll get efficient buy signals with precise price targets for maximum performance. Start outperforming now!
How do institutions grade them?
The following tables summarize recent institutional grades for Edwards Lifesciences Corporation and DexCom, Inc.:
Edwards Lifesciences Corporation Grades
This table shows recent grades assigned to Edwards Lifesciences Corporation by well-known institutions.
| Grading Company | Action | New Grade | Date |
|---|---|---|---|
| Truist Securities | Maintain | Hold | 2026-02-11 |
| Piper Sandler | Maintain | Overweight | 2026-02-11 |
| Goldman Sachs | Maintain | Buy | 2026-02-11 |
| BTIG | Maintain | Buy | 2026-02-11 |
| Wells Fargo | Maintain | Overweight | 2026-02-11 |
| Stifel | Maintain | Buy | 2026-01-20 |
| Piper Sandler | Maintain | Overweight | 2026-01-20 |
| UBS | Maintain | Neutral | 2026-01-12 |
| Barclays | Maintain | Overweight | 2026-01-12 |
| TD Cowen | Upgrade | Buy | 2026-01-09 |
DexCom, Inc. Grades
This table shows recent grades assigned to DexCom, Inc. by well-known institutions.
| Grading Company | Action | New Grade | Date |
|---|---|---|---|
| Mizuho | Maintain | Outperform | 2026-02-13 |
| BTIG | Maintain | Buy | 2026-02-13 |
| Canaccord Genuity | Maintain | Buy | 2026-02-13 |
| Barclays | Maintain | Underweight | 2026-02-13 |
| Wells Fargo | Maintain | Overweight | 2026-02-13 |
| Barclays | Downgrade | Underweight | 2026-01-12 |
| Bernstein | Maintain | Outperform | 2026-01-09 |
| Mizuho | Maintain | Outperform | 2025-12-17 |
| Citigroup | Maintain | Buy | 2025-12-11 |
| Morgan Stanley | Upgrade | Overweight | 2025-12-02 |
Which company has the best grades?
Edwards Lifesciences consistently receives Buy and Overweight ratings, reflecting steady confidence. DexCom shows strong Outperform and Buy grades but also mixed signals with Underweight ratings from Barclays. Investors face a varied outlook for DexCom, while Edwards presents a more uniform positive consensus.
Risks specific to each company
The following categories identify critical pressure points and systemic threats facing both Edwards Lifesciences Corporation and DexCom, Inc. in the 2026 market environment:
1. Market & Competition
Edwards Lifesciences Corporation
- Faces intense competition in structural heart devices with pressure to innovate and maintain premium pricing.
DexCom, Inc.
- Operates in a rapidly evolving CGM market with growing rivals and pressure to reduce device costs.
2. Capital Structure & Debt
Edwards Lifesciences Corporation
- Exhibits a very conservative debt profile with favorable debt-to-assets and infinite interest coverage.
DexCom, Inc.
- Maintains moderate leverage (D/E 0.51), manageable debt-to-assets, but some concern over rising borrowing costs.
3. Stock Volatility
Edwards Lifesciences Corporation
- Lower beta of 0.94 suggests less stock price volatility relative to market benchmarks.
DexCom, Inc.
- Higher beta at 1.49 indicates elevated stock price sensitivity and market risk.
4. Regulatory & Legal
Edwards Lifesciences Corporation
- Operates under strict FDA and EU medical device regulations, risks from product recalls and approvals.
DexCom, Inc.
- Faces regulatory scrutiny on CGM accuracy and data privacy, plus risks from evolving healthcare reimbursement policies.
5. Supply Chain & Operations
Edwards Lifesciences Corporation
- Relies on specialized suppliers for valve components; supply disruptions could delay costly clinical trials.
DexCom, Inc.
- Depends on complex manufacturing for sensors; supply chain issues could impact device availability and revenue.
6. ESG & Climate Transition
Edwards Lifesciences Corporation
- Increasing pressure to improve environmental footprint in manufacturing and comply with evolving ESG standards.
DexCom, Inc.
- Faces investor demands for transparent ESG reporting and sustainable product life cycles in healthcare tech.
7. Geopolitical Exposure
Edwards Lifesciences Corporation
- Global presence exposes it to currency risks and trade tensions, especially in Europe and Asia markets.
DexCom, Inc.
- International sales subject to geopolitical uncertainty and regulatory divergence, impacting growth in key regions.
Which company shows a better risk-adjusted profile?
DexCom faces its largest risk in stock volatility and regulatory pressures but compensates with stronger profitability and financial health. Edwards Lifesciences’ main risk lies in weak capital efficiency and unfavorable valuation metrics despite stable debt levels. DexCom’s higher Piotroski score and safe Altman Z-score reflect a more robust risk-adjusted profile. Notably, DexCom’s rapid 7.6% recent share price gain signals investor confidence despite market headwinds, underscoring its relative strength.
Final Verdict: Which stock to choose?
Edwards Lifesciences wields its superpower in unmatched operational efficiency and strong free cash flow generation. Its point of vigilance lies in a recent decline in profitability metrics, signaling possible earnings pressure ahead. It suits portfolios aiming for stable, cash-generative growth.
DexCom benefits from a formidable strategic moat rooted in recurring revenue and innovative product leadership in continuous glucose monitoring. Compared to Edwards, it offers greater growth potential with a moderately higher risk profile. It fits well in growth-at-a-reasonable-price (GARP) investment strategies.
If you prioritize resilient cash flow and operational efficiency, Edwards Lifesciences is the compelling choice due to its stability and solid margin profile. However, if you seek accelerating growth with a durable competitive advantage, DexCom offers better growth trajectory and improving returns on invested capital, despite higher valuation risk.
Disclaimer: Investment carries a risk of loss of initial capital. The past performance is not a reliable indicator of future results. Be sure to understand risks before making an investment decision.
Go Further
I encourage you to read the complete analyses of Edwards Lifesciences Corporation and DexCom, Inc. to enhance your investment decisions: