In the dynamic energy sector, Devon Energy Corporation (DVN) and Texas Pacific Land Corporation (TPL) stand out as key players with distinct business models yet overlapping market interests. Devon focuses on oil and natural gas exploration and production, while Texas Pacific Land specializes in land and resource management, including valuable royalty interests. This comparison will help investors understand which company offers the most compelling investment opportunity in today’s evolving energy landscape. Let’s explore their strengths and risks together.
Table of contents
Companies Overview
I will begin the comparison between Devon Energy Corporation and Texas Pacific Land Corporation by providing an overview of these two companies and their main differences.
Devon Energy Corporation Overview
Devon Energy Corporation is an independent energy company focused on the exploration, development, and production of oil, natural gas, and natural gas liquids in the United States. Headquartered in Oklahoma City, Oklahoma, it operates around 5,134 gross wells and has a workforce of approximately 2,300 employees. Devon Energy is positioned as a significant player in the Oil & Gas Exploration & Production industry.
Texas Pacific Land Corporation Overview
Texas Pacific Land Corporation operates primarily in land and resource management as well as water services and operations, managing about 880,000 acres of land. The company holds various nonparticipating perpetual oil and gas royalty interests and provides water sourcing, treatment, and disposal services to operators in the Permian Basin. Based in Dallas, Texas, TPL employs around 111 people and focuses on royalty and land lease income alongside water-related offerings.
Key similarities and differences
Both Devon Energy and Texas Pacific Land operate within the energy sector under the Oil & Gas Exploration & Production industry, but their business models differ notably. Devon Energy is focused on direct extraction and production of oil and gas, while Texas Pacific Land concentrates on land management, royalty interests, and water service operations. Devon Energy employs a significantly larger workforce and operates a broader scope of wells, whereas TPL leverages land assets and niche water services as revenue sources.
Income Statement Comparison
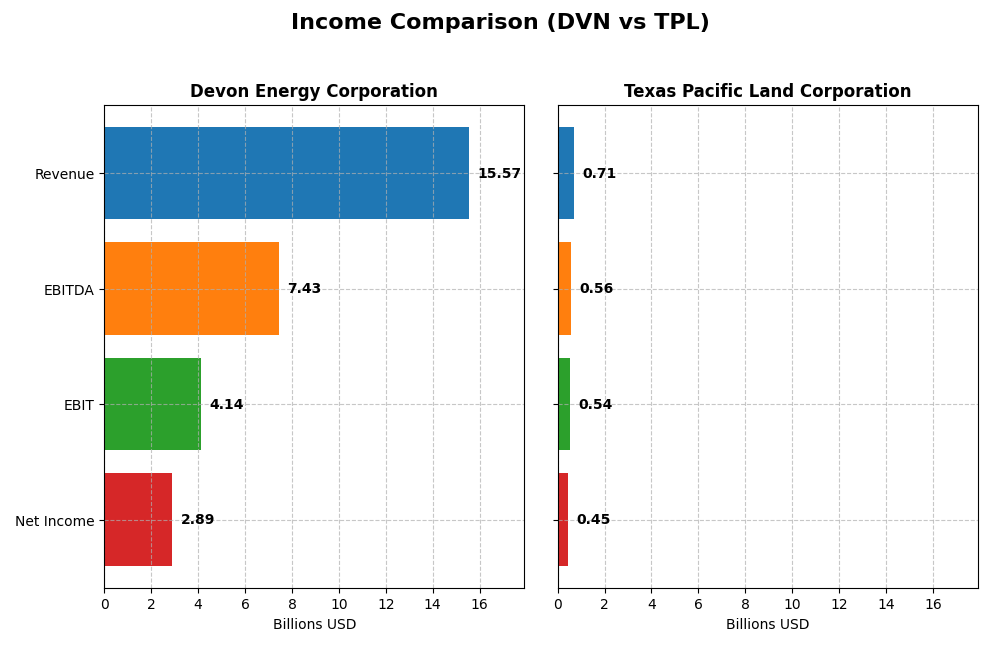
The table below compares key income statement metrics of Devon Energy Corporation and Texas Pacific Land Corporation for the fiscal year 2024, providing a snapshot of their financial performance.
| Metric | Devon Energy Corporation | Texas Pacific Land Corporation |
|---|---|---|
| Market Cap | 22.9B | 21.5B |
| Revenue | 15.6B | 706M |
| EBITDA | 7.43B | 564M |
| EBIT | 4.14B | 539M |
| Net Income | 2.89B | 454M |
| EPS | 4.57 | 6.58 |
| Fiscal Year | 2024 | 2024 |
Income Statement Interpretations
Devon Energy Corporation
Devon Energy’s revenue and net income have shown substantial growth from 2020 to 2024, with revenue rising from $4.35B to $15.57B and net income recovering from a loss to $2.89B. Margins have generally remained favorable, though the latest year saw declines in gross profit and EBIT margins. The 2024 performance indicates slowed growth and margin compression compared to prior years.
Texas Pacific Land Corporation
Texas Pacific Land has experienced steady revenue and net income growth, with revenue increasing from $303M in 2020 to $706M in 2024, and net income rising from $176M to $454M. Margins remain exceptionally strong, with gross and net margins above 60%. The most recent year showed continued growth and stable margins, reflecting consistent operational efficiency and profitability.
Which one has the stronger fundamentals?
While both companies have favorable income statements, Texas Pacific Land demonstrates stronger fundamentals with higher and more stable margins, consistent revenue and net income growth, and no unfavorable indicators. Devon Energy, despite overall growth, faces recent margin declines and slowed earnings growth, suggesting relatively higher volatility in fundamentals over the latest fiscal year.
Financial Ratios Comparison
The following table presents a side-by-side comparison of key financial ratios for Devon Energy Corporation (DVN) and Texas Pacific Land Corporation (TPL) based on their most recent fiscal year data from 2024.
| Ratios | Devon Energy Corporation (DVN) | Texas Pacific Land Corporation (TPL) |
|---|---|---|
| ROE | 19.94% | 40.09% |
| ROIC | 10.80% | 35.60% |
| P/E | 7.05 | 18.67 |
| P/B | 1.41 | 7.48 |
| Current Ratio | 1.04 | 8.33 |
| Quick Ratio | 0.95 | 8.33 |
| D/E (Debt-to-Equity) | 0.63 | 0.0004 |
| Debt-to-Assets | 30.18% | 0.04% |
| Interest Coverage | 9.40 | 0 |
| Asset Turnover | 0.51 | 0.57 |
| Fixed Asset Turnover | 0.61 | 1.27 |
| Payout ratio | 32.41% | 76.51% |
| Dividend yield | 4.60% | 4.10% |
Interpretation of the Ratios
Devon Energy Corporation
Devon Energy shows predominantly favorable financial ratios, with a strong net margin of 18.57% and return on equity near 20%, indicating efficient profitability. However, the fixed asset turnover is weak, suggesting less efficient use of fixed assets. Its dividend yield stands at a solid 4.6%, supported by consistent payouts and share buybacks, though coverage by free cash flow is currently negative, posing potential sustainability concerns.
Texas Pacific Land Corporation
Texas Pacific Land boasts very strong profitability ratios, including a high net margin of 64.32% and ROE of 40.09%, reflecting excellent operational efficiency. The company has a favorable dividend yield of 4.1%, supported by regular dividend payments and no debt, indicating a solid capital structure. Some ratios, such as a high price-to-book of 7.48 and an unusually high current ratio, may raise questions about valuation and asset management.
Which one has the best ratios?
Both companies present a favorable overall ratio profile, with Devon Energy benefiting from balanced valuation metrics and Texas Pacific Land excelling in profitability and low leverage. Devon’s weaker fixed asset turnover contrasts with Texas Pacific Land’s elevated price-to-book and current ratios. The choice depends on weighing operational efficiency against valuation and balance sheet conservatism.
Strategic Positioning
This section compares the strategic positioning of Devon Energy Corporation and Texas Pacific Land Corporation regarding market position, key segments, and exposure to technological disruption:
Devon Energy Corporation
- Operates in oil & gas exploration and production with 5,134 wells facing typical sector competition.
- Key business drivers are oil, natural gas, and NGL product sales primarily in the U.S. and Canada.
- Limited direct exposure to technological disruption; focused on traditional upstream energy production.
Texas Pacific Land Corporation
- Land and resource management with 880,000 acres under management and royalty interests.
- Diverse revenue from royalties, land sales, easements, and water services in the Permian Basin.
- Some exposure via water services infrastructure and analytics, but largely stable land management.
Devon Energy Corporation vs Texas Pacific Land Corporation Positioning
Devon Energy pursues a concentrated upstream oil and gas production strategy, relying heavily on commodity sales, while Texas Pacific Land adopts a diversified model spanning land management, royalties, and water services. Devon’s scale offers production leverage; Texas Pacific’s asset base provides stable, multi-source revenue.
Which has the best competitive advantage?
Both companies demonstrate a very favorable moat with growing ROIC above WACC. Texas Pacific Land’s higher ROIC spread indicates a stronger competitive advantage, though Devon Energy shows durable value creation through efficient capital use.
Stock Comparison
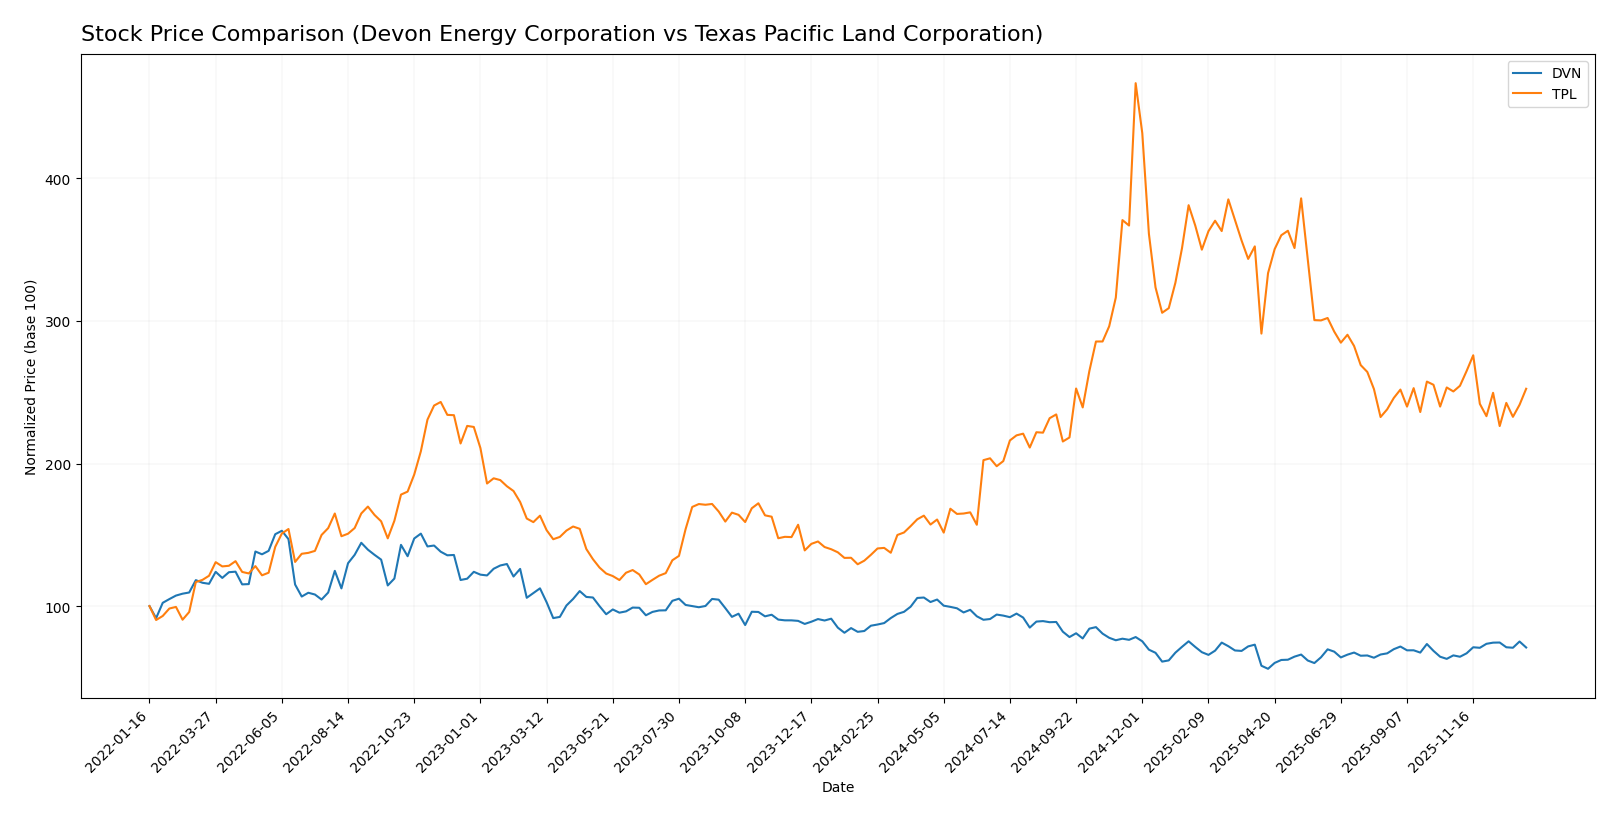
The stock prices of Devon Energy Corporation and Texas Pacific Land Corporation exhibited contrasting dynamics over the past 12 months, with Devon Energy showing a marked decline and Texas Pacific Land achieving significant gains, alongside fluctuating recent trends.
Trend Analysis
Devon Energy Corporation’s stock experienced a bearish trend over the past year, declining by 17.72%. The trend showed acceleration with a standard deviation of 6.4, hitting a high of 53.42 and a low of 28.23. Recently, the stock reversed slightly, gaining 8.46% with low volatility.
Texas Pacific Land Corporation’s stock was strongly bullish over the past year, rising 85.66%. However, the trend decelerated recently, with a minimal 0.75% increase and higher volatility reflected in a standard deviation of 16.59. Prices ranged between 167.98 and 576.67.
Comparing both, Texas Pacific Land delivered the highest market performance with an 85.66% gain, while Devon Energy faced a significant 17.72% loss over the same period.
Target Prices
Analysts present a clear consensus on target prices for Devon Energy Corporation and Texas Pacific Land Corporation.
| Company | Target High | Target Low | Consensus |
|---|---|---|---|
| Devon Energy Corporation | 48 | 40 | 43.5 |
| Texas Pacific Land Corporation | 1050 | 1050 | 1050 |
The consensus target for Devon Energy at 43.5 suggests a potential upside of about 22% from the current price of 35.76. Texas Pacific Land’s target is significantly higher than its current price of 311.87, indicating strong bullish expectations from analysts.
Analyst Opinions Comparison
This section compares analysts’ ratings and grades for Devon Energy Corporation (DVN) and Texas Pacific Land Corporation (TPL):
Rating Comparison
DVN Rating
- Rating: A- indicating a very favorable assessment.
- Discounted Cash Flow Score: 4, reflecting a favorable view on valuation based on future cash flows.
- ROE Score: 5, very favorable for profit generation efficiency from shareholders’ equity.
- ROA Score: 5, very favorable in terms of effective asset utilization.
- Debt To Equity Score: 1, very unfavorable, indicating high financial risk due to debt levels.
- Overall Score: 4, favorable overall financial standing.
TPL Rating
- Rating: A- indicating a very favorable assessment.
- Discounted Cash Flow Score: 4, reflecting a favorable view on valuation based on future cash flows.
- ROE Score: 5, very favorable for profit generation efficiency from shareholders’ equity.
- ROA Score: 5, very favorable in terms of effective asset utilization.
- Debt To Equity Score: 3, moderate, showing a more balanced financial risk profile.
- Overall Score: 4, favorable overall financial standing.
Which one is the best rated?
Both DVN and TPL share an identical overall rating of A- with favorable overall scores of 4. While both excel in ROE and ROA with very favorable scores of 5, DVN’s debt to equity score is very unfavorable at 1, compared to TPL’s moderate score of 3, indicating TPL has a stronger balance sheet on this metric.
Scores Comparison
Here is a comparison of the Altman Z-Score and Piotroski Score for both companies:
Devon Energy Corporation Scores
- Altman Z-Score: 2.29, indicating a moderate bankruptcy risk (grey zone).
- Piotroski Score: 5, reflecting average financial strength.
Texas Pacific Land Corporation Scores
- Altman Z-Score: 29.77, indicating very low bankruptcy risk (safe zone).
- Piotroski Score: 4, reflecting average financial strength.
Which company has the best scores?
Based on the provided data, Texas Pacific Land has a significantly higher Altman Z-Score, placing it firmly in the safe zone, while Devon Energy is in the grey zone. Both companies have average Piotroski Scores, with Devon slightly ahead.
Grades Comparison
Here is a comparison of recent grades issued by recognized financial grading companies for Devon Energy Corporation and Texas Pacific Land Corporation:
Devon Energy Corporation Grades
This table summarizes the latest grades assigned by major financial firms to Devon Energy Corporation:
| Grading Company | Action | New Grade | Date |
|---|---|---|---|
| Bernstein | Maintain | Outperform | 2026-01-05 |
| Roth Capital | Maintain | Buy | 2025-12-31 |
| Citigroup | Maintain | Buy | 2025-12-17 |
| UBS | Upgrade | Buy | 2025-12-12 |
| Mizuho | Maintain | Outperform | 2025-12-12 |
| Morgan Stanley | Maintain | Overweight | 2025-12-11 |
| JP Morgan | Upgrade | Overweight | 2025-12-08 |
| Piper Sandler | Maintain | Overweight | 2025-11-18 |
| Susquehanna | Maintain | Positive | 2025-11-12 |
| Susquehanna | Maintain | Positive | 2025-10-20 |
The overall trend for Devon Energy is positive, with multiple upgrades and consistent ratings in the Buy to Outperform range.
Texas Pacific Land Corporation Grades
This table presents recent grades from recognized analysts for Texas Pacific Land Corporation:
| Grading Company | Action | New Grade | Date |
|---|---|---|---|
| BWS Financial | Maintain | Buy | 2024-08-12 |
| BWS Financial | Maintain | Buy | 2024-05-10 |
| BWS Financial | Maintain | Buy | 2024-04-02 |
| Stifel | Maintain | Hold | 2024-01-23 |
| Stifel | Maintain | Hold | 2023-11-30 |
| Stifel | Maintain | Hold | 2023-05-22 |
| Stifel | Maintain | Hold | 2023-05-21 |
| Stifel | Maintain | Hold | 2023-04-27 |
| Stifel | Maintain | Hold | 2023-04-26 |
| Stifel | Maintain | Hold | 2023-04-12 |
Texas Pacific Land shows a stable grade pattern with consistent Buy ratings from BWS Financial but predominantly Hold ratings from Stifel.
Which company has the best grades?
Devon Energy Corporation has received stronger and more recent grades, mostly in the Buy to Outperform range, while Texas Pacific Land’s ratings are mixed between Buy and Hold. This could influence investors’ perception of growth potential and risk for each company.
Strengths and Weaknesses
Below is a comparison of key strengths and weaknesses for Devon Energy Corporation (DVN) and Texas Pacific Land Corporation (TPL) based on their latest financial and operational data.
| Criterion | Devon Energy Corporation (DVN) | Texas Pacific Land Corporation (TPL) |
|---|---|---|
| Diversification | Focused mainly on NGL product sales (~$11.2B in 2024), limited segments | Diverse revenue streams: oil & gas royalties, produced water, land sales, easements |
| Profitability | Net margin 18.57%, ROE 19.94%, ROIC 10.8%, PE 7.05 (favorable) | Net margin 64.32%, ROE 40.09%, ROIC 35.6%, PE 18.67 (higher valuation) |
| Innovation | Moderate asset turnover (0.51) and fixed asset turnover (0.61) | Higher fixed asset turnover (1.27), showing efficient asset use |
| Global presence | Primarily US and Canada operations | Mainly US-based land and royalty holdings |
| Market Share | Strong presence in US energy sector, steady growing ROIC | Leading landowner with durable competitive advantage and high ROIC |
Key takeaways: Both companies show strong profitability and durable moats with growing ROIC. DVN is more concentrated in energy production with moderate efficiency metrics, while TPL benefits from diverse income sources and exceptional returns on capital, albeit with higher valuation multiples. Risk management favors TPL’s broader revenue base and asset efficiency.
Risk Analysis
Below is a comparative risk assessment for Devon Energy Corporation (DVN) and Texas Pacific Land Corporation (TPL) based on the most recent data from 2024.
| Metric | Devon Energy Corporation (DVN) | Texas Pacific Land Corporation (TPL) |
|---|---|---|
| Market Risk | Moderate (Beta 0.655, stable oil & gas sector) | Moderate (Beta 0.935, more volatile land/resource management) |
| Debt Level | Moderate (Debt-to-Equity 0.63, Debt-to-Assets 30%) | Low (Debt-to-Equity 0.0, Debt-to-Assets 0.04%) |
| Regulatory Risk | High (Oil & Gas industry faces significant environmental regulations) | Moderate (Land and water services regulated but less so than production) |
| Operational Risk | Moderate (5,134 wells operations complexity) | Low (Focused on land/resource management, fewer operational complexities) |
| Environmental Risk | High (Exposure to fossil fuel production impacts) | Moderate (Water services and land management impact) |
| Geopolitical Risk | Moderate (US-centric but sensitive to global oil markets) | Low (Primarily US land holdings, less exposed to geopolitical tensions) |
Synthesis: Devon Energy faces the most impactful risks in environmental and regulatory domains due to its significant oil and gas production activities. Despite moderate debt levels, operational and market risks remain manageable. Texas Pacific Land benefits from minimal debt and lower operational risk but shows vulnerability in valuation metrics and some regulatory exposure in water services. Both companies maintain favorable financial health, with DVN in a moderate bankruptcy risk zone and TPL firmly in a safe zone.
Which Stock to Choose?
Devon Energy Corporation (DVN) shows a favorable income evolution with a 258% revenue growth over five years but recent declines in gross profit and net margin. Its financial ratios are mostly favorable, with strong profitability and moderate debt levels. The company holds a very favorable rating of A- and demonstrates a very favorable economic moat with growing ROIC exceeding WACC.
Texas Pacific Land Corporation (TPL) exhibits robust income growth with an overall 133% revenue increase and consistently high margins. Its financial ratios are favorable overall, though some indicators like price-to-book and current ratio are unfavorable. TPL also holds a very favorable A- rating and a very favorable moat, supported by a growing ROIC far above WACC and low debt.
Considering ratings and financial performance, TPL might appeal to investors seeking strong profitability and lower financial risk, while DVN could be more attractive for those focused on value creation amid recent income fluctuations. Both companies show durable competitive advantages, but differing profiles suggest the choice depends on individual risk tolerance and investment strategy.
Disclaimer: Investment carries a risk of loss of initial capital. The past performance is not a reliable indicator of future results. Be sure to understand risks before making an investment decision.
Go Further
I encourage you to read the complete analyses of Devon Energy Corporation and Texas Pacific Land Corporation to enhance your investment decisions: