In the dynamic energy sector, Occidental Petroleum Corporation (OXY) and Devon Energy Corporation (DVN) stand out as key players in oil and gas exploration and production. Both companies operate primarily in the United States, sharing similar market environments yet differing in scale and innovation approach. This article will carefully analyze their strengths and risks to help you decide which stock might best fit your investment portfolio in 2026.
Table of contents
Companies Overview
I will begin the comparison between Occidental Petroleum Corporation and Devon Energy Corporation by providing an overview of these two companies and their main differences.
Occidental Petroleum Corporation Overview
Occidental Petroleum Corporation operates in the energy sector, focusing on oil and gas exploration, development, and production across the US, Middle East, Africa, and Latin America. Founded in 1920 and headquartered in Houston, Texas, it also has chemical and midstream marketing segments, making it a diversified player with a market cap of about 42.2B USD and over 13,000 employees.
Devon Energy Corporation Overview
Devon Energy Corporation is an independent energy company primarily involved in the exploration, development, and production of oil, natural gas, and natural gas liquids in the United States. Incorporated in 1971 and based in Oklahoma City, Oklahoma, it operates around 5,134 wells and has a market cap close to 22.9B USD with approximately 2,300 employees.
Key similarities and differences
Both companies operate in the oil and gas exploration and production industry in the US, but Occidental has a more diversified business model including chemicals and midstream operations, while Devon focuses mainly on upstream activities. Occidental is larger in market cap and workforce, reflecting its broader geographic reach and segment diversity, whereas Devon maintains a leaner profile with concentrated US operations.
Income Statement Comparison
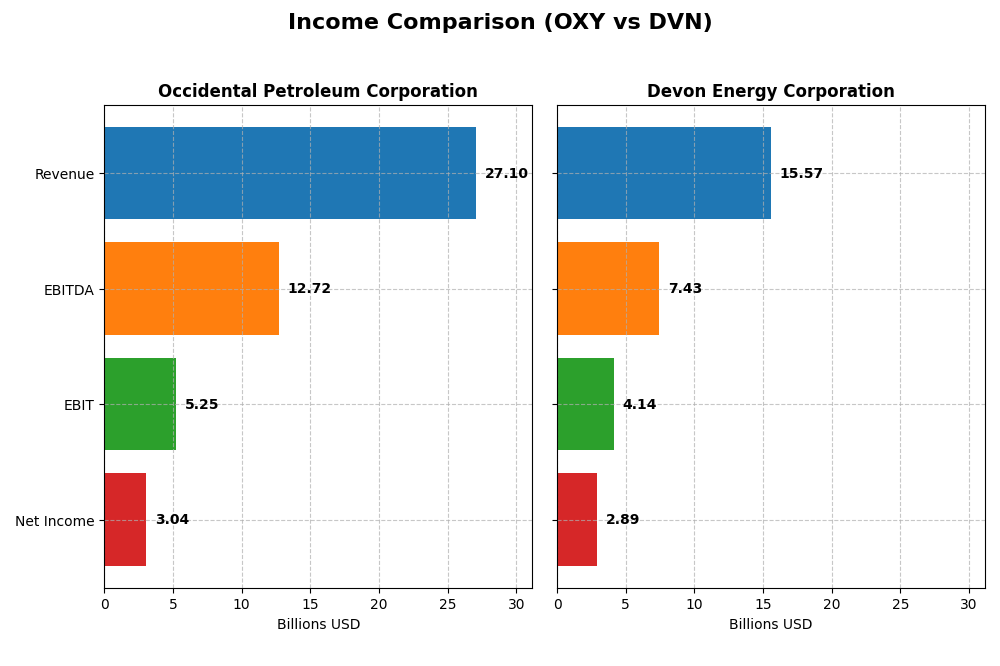
The following table presents a side-by-side comparison of key income statement metrics for Occidental Petroleum Corporation and Devon Energy Corporation for the fiscal year 2024.
| Metric | Occidental Petroleum Corporation (OXY) | Devon Energy Corporation (DVN) |
|---|---|---|
| Market Cap | 42.2B | 22.9B |
| Revenue | 27.1B | 15.6B |
| EBITDA | 12.7B | 7.4B |
| EBIT | 5.2B | 4.1B |
| Net Income | 3.0B | 2.9B |
| EPS | 2.59 | 4.57 |
| Fiscal Year | 2024 | 2024 |
Income Statement Interpretations
Occidental Petroleum Corporation
Occidental Petroleum’s revenue and net income have shown strong overall growth from 2020 to 2024, with revenue up 58.12% and net income rising 120.52%. Margins remain favorable, including a 35.61% gross margin and 11.23% net margin in 2024. However, the latest year saw declines in revenue (-4.35%) and net income margins (-31.92%), indicating a slowdown after prior gains.
Devon Energy Corporation
Devon Energy experienced significant revenue and net income growth over the 2020-2024 period, with revenue increasing 257.78% and net income growing 207.71%. Margins are robust, featuring a 27.43% gross margin and an 18.57% net margin in 2024. Despite this, the most recent year showed a slight revenue increase of 2.82% but declines in gross profit (-17.88%) and net margin (-24.96%), signaling margin compression.
Which one has the stronger fundamentals?
Both Occidental and Devon display favorable income statement fundamentals over five years, with solid margin profiles and double-digit growth in net income and EPS. Occidental’s margins are higher, but Devon’s revenue growth outpaces Occidental’s considerably. The recent year’s deterioration in margins and profits affects both, suggesting caution; however, their long-term income strength remains evident.
Financial Ratios Comparison
The table below compares key financial ratios for Occidental Petroleum Corporation (OXY) and Devon Energy Corporation (DVN) based on their most recent 2024 fiscal year data.
| Ratios | Occidental Petroleum Corporation (OXY) | Devon Energy Corporation (DVN) |
|---|---|---|
| ROE | 8.91% | 19.94% |
| ROIC | 5.48% | 10.80% |
| P/E | 14.81 | 7.05 |
| P/B | 1.32 | 1.41 |
| Current Ratio | 0.95 | 1.04 |
| Quick Ratio | 0.73 | 0.95 |
| D/E (Debt-to-Equity) | 0.79 | 0.63 |
| Debt-to-Assets | 31.7% | 30.2% |
| Interest Coverage | 5.08 | 9.40 |
| Asset Turnover | 0.32 | 0.51 |
| Fixed Asset Turnover | 0.39 | 0.61 |
| Payout Ratio | 47.5% | 32.4% |
| Dividend Yield | 3.21% | 4.60% |
Interpretation of the Ratios
Occidental Petroleum Corporation
Occidental Petroleum shows a mixed financial profile with favorable net margin (11.23%) and valuation ratios like PE (14.81) and PB (1.32), but weaker liquidity indicated by a current ratio below 1. Dividend yield is solid at 3.21%, supported by consistent payouts, though some caution is warranted due to moderate coverage and evolving cash flow dynamics affecting sustainability.
Devon Energy Corporation
Devon Energy’s ratios are generally strong, boasting a favorable net margin of 18.57%, high ROE at 19.94%, and robust interest coverage of 10.32. Liquidity ratios are neutral with a current ratio of 1.04. The company offers a higher dividend yield of 4.6%, supported by stable fundamentals and efficient capital management, suggesting potentially better shareholder returns relative to peers.
Which one has the best ratios?
Devon Energy displays a more favorable overall ratio profile with higher profitability, stronger returns on equity and capital, and better interest coverage. While Occidental Petroleum has some favorable valuation metrics and a decent dividend yield, its weaker liquidity and asset turnover ratios temper its standing. Hence, Devon Energy’s ratios present a comparatively stronger financial position in 2024.
Strategic Positioning
This section compares the strategic positioning of Occidental Petroleum Corporation (OXY) and Devon Energy Corporation (DVN) including market position, key segments, and exposure to disruption:
Occidental Petroleum Corporation (OXY)
- Larger market cap of 42B, lower beta of 0.38; faces moderate competitive pressure in oil and gas sectors.
- Diversified across Oil & Gas (21.7B revenue), Chemicals (4.9B), and Midstream (1.7B) segments globally.
- Exposure to technological disruption is moderate; operates traditional oil and gas exploration, chemicals, and midstream activities.
Devon Energy Corporation (DVN)
- Smaller market cap of 23B, higher beta of 0.655; operates under competitive pressure in US oil and gas exploration.
- Focused primarily on US oil, natural gas, and NGLs with 11.2B from NGL product sales, fewer segments.
- Exposure concentrated in conventional oil and gas exploration and production within the US market.
Occidental Petroleum Corporation vs Devon Energy Corporation Positioning
OXY’s strategic approach is diversified with multiple segments including chemicals and midstream, offering broader revenue streams but more complex operations. DVN is more concentrated on US oil and gas production, potentially allowing focused operational efficiency but less diversification.
Which has the best competitive advantage?
Based on MOAT evaluation, DVN demonstrates a very favorable competitive advantage with ROIC significantly exceeding WACC and growing profitability, while OXY shows a slightly favorable status with increasing profitability but still shedding value.
Stock Comparison
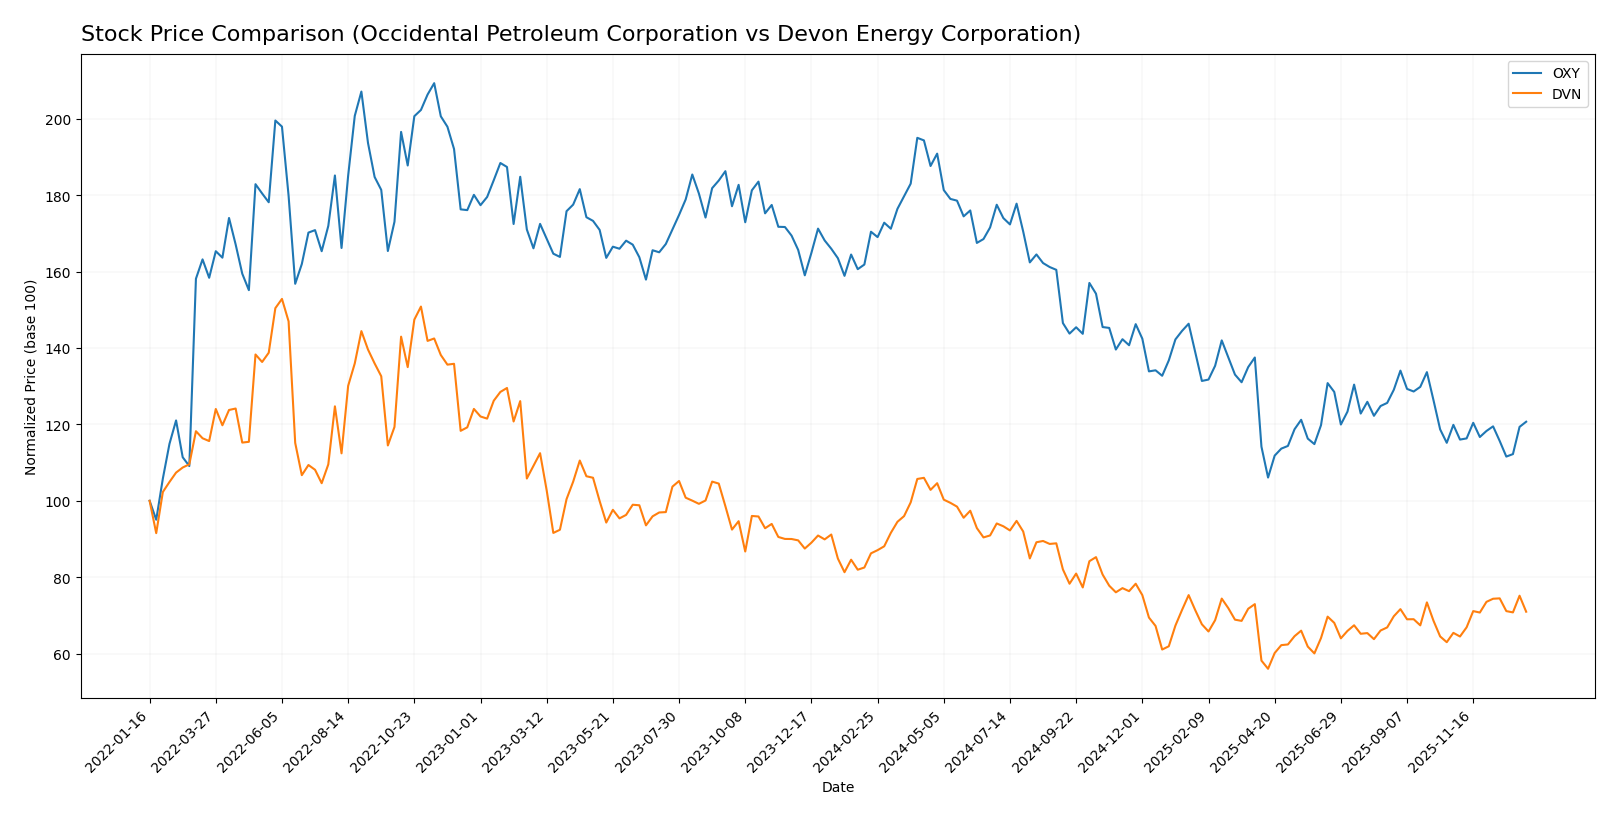
The stock prices of Occidental Petroleum Corporation (OXY) and Devon Energy Corporation (DVN) have exhibited notable bearish trends over the past year, with distinct acceleration patterns and varying recent trading dynamics.
Trend Analysis
Occidental Petroleum Corporation’s stock showed a bearish trend over the last 12 months with a price decline of 29.18%, coupled with accelerating downward momentum and high volatility (std deviation 8.33). Its recent trend is neutral with a slight 0.68% rise.
Devon Energy Corporation also experienced a bearish trend over the past year, with a price drop of 17.72% and accelerating decline. Recent months show a bullish reversal, gaining 8.46% with moderate volatility (std deviation 1.7).
Comparing both, Devon Energy delivered the highest market performance recently, offsetting part of its yearly losses, while Occidental remains under stronger overall bearish pressure.
Target Prices
Here is the current target price consensus from verified analysts for Occidental Petroleum Corporation and Devon Energy Corporation.
| Company | Target High | Target Low | Consensus |
|---|---|---|---|
| Occidental Petroleum Corporation | 64 | 38 | 49.36 |
| Devon Energy Corporation | 48 | 40 | 43.5 |
Analysts see upside potential for both stocks, with Occidental’s consensus target about 15% above its current price of 42.86 USD, while Devon’s target is roughly 22% higher than its 35.76 USD market price. This suggests moderate bullish expectations.
Analyst Opinions Comparison
This section compares analysts’ ratings and grades for Occidental Petroleum Corporation (OXY) and Devon Energy Corporation (DVN):
Rating Comparison
OXY Rating
- Rating: B+, rated Very Favorable
- Discounted Cash Flow Score: 5, Very Favorable
- ROE Score: 3, Moderate
- ROA Score: 4, Favorable
- Debt To Equity Score: 1, Very Unfavorable
- Overall Score: 3, Moderate
DVN Rating
- Rating: A-, rated Very Favorable
- Discounted Cash Flow Score: 4, Favorable
- ROE Score: 5, Very Favorable
- ROA Score: 5, Very Favorable
- Debt To Equity Score: 1, Very Unfavorable
- Overall Score: 4, Favorable
Which one is the best rated?
Based strictly on the provided data, DVN holds a higher overall rating (A- vs B+) and scores better in ROE, ROA, and overall score. Both share a very unfavorable debt-to-equity score.
Scores Comparison
Here is a comparison of the financial scores for Occidental Petroleum Corporation (OXY) and Devon Energy Corporation (DVN):
OXY Scores
- Altman Z-Score: 1.39, in the distress zone, indicating high bankruptcy risk.
- Piotroski Score: 5, classified as average financial health.
DVN Scores
- Altman Z-Score: 2.29, in the grey zone, indicating moderate bankruptcy risk.
- Piotroski Score: 5, classified as average financial health.
Which company has the best scores?
Based strictly on the provided data, DVN has a better Altman Z-Score, placing it in the grey zone versus OXY’s distress zone. Both companies share the same average Piotroski Score of 5.
Grades Comparison
The following is a detailed comparison of recent grades assigned to Occidental Petroleum Corporation and Devon Energy Corporation:
Occidental Petroleum Corporation Grades
This table shows the latest grades and actions from major grading companies for Occidental Petroleum Corporation.
| Grading Company | Action | New Grade | Date |
|---|---|---|---|
| UBS | maintain | Neutral | 2025-12-12 |
| B of A Securities | maintain | Neutral | 2025-12-11 |
| JP Morgan | downgrade | Underweight | 2025-12-08 |
| Citigroup | maintain | Neutral | 2025-11-19 |
| Piper Sandler | maintain | Neutral | 2025-11-18 |
| Susquehanna | maintain | Positive | 2025-11-13 |
| Wells Fargo | maintain | Underweight | 2025-11-12 |
| Mizuho | maintain | Outperform | 2025-11-11 |
| Piper Sandler | maintain | Neutral | 2025-10-21 |
| Susquehanna | maintain | Positive | 2025-10-20 |
Occidental’s grades predominantly cluster around Neutral with some Underweight and Positive ratings, indicating a mixed to cautious outlook.
Devon Energy Corporation Grades
Here are the most recent grades and actions from key grading companies for Devon Energy Corporation.
| Grading Company | Action | New Grade | Date |
|---|---|---|---|
| Bernstein | maintain | Outperform | 2026-01-05 |
| Roth Capital | maintain | Buy | 2025-12-31 |
| Citigroup | maintain | Buy | 2025-12-17 |
| UBS | upgrade | Buy | 2025-12-12 |
| Mizuho | maintain | Outperform | 2025-12-12 |
| Morgan Stanley | maintain | Overweight | 2025-12-11 |
| JP Morgan | upgrade | Overweight | 2025-12-08 |
| Piper Sandler | maintain | Overweight | 2025-11-18 |
| Susquehanna | maintain | Positive | 2025-11-12 |
| Susquehanna | maintain | Positive | 2025-10-20 |
Devon Energy consistently receives Buy, Outperform, and Overweight ratings, reflecting a generally favorable consensus.
Which company has the best grades?
Devon Energy holds a stronger grade profile than Occidental Petroleum, with more Buy and Outperform ratings. This suggests greater analyst confidence in Devon’s prospects, potentially influencing investors seeking more positive market sentiment.
Strengths and Weaknesses
Below is a comparative overview of Occidental Petroleum Corporation (OXY) and Devon Energy Corporation (DVN) based on key criteria relevant to investors.
| Criterion | Occidental Petroleum (OXY) | Devon Energy (DVN) |
|---|---|---|
| Diversification | Moderate: Significant revenue from Oil & Gas (21.7B), Chemicals (4.9B), and Midstream (1.7B) segments | Lower diversification: Primarily focused on NGL Product Sales (11.2B) |
| Profitability | Moderate: Net margin 11.23%, ROIC 5.48%, ROE 8.91% (neutral to unfavorable in some areas) | Strong: Net margin 18.57%, ROIC 10.8%, ROE 19.94% (all favorable) |
| Innovation | Slightly Favorable: Growing ROIC but shedding value overall; modest efficiency improvements | Very Favorable: Growing ROIC with a durable competitive advantage and increasing profitability |
| Global presence | Broad: Active in chemical, midstream, and oil & gas markets globally | Focused: Mainly North American operations with strong US segment |
| Market Share | Established presence with diversified revenue streams | Strong in natural gas liquids with increasing market penetration |
Key takeaways: Devon Energy shows stronger profitability, a durable competitive moat, and a focused yet effective business model. Occidental Petroleum offers diversification but faces challenges in value creation and operational efficiency. Investors should weigh diversification against profitability and competitive advantage carefully.
Risk Analysis
Below is a comparative table of key risk factors for Occidental Petroleum Corporation (OXY) and Devon Energy Corporation (DVN) based on the most recent 2024 data:
| Metric | Occidental Petroleum (OXY) | Devon Energy (DVN) |
|---|---|---|
| Market Risk | Beta 0.38 (low volatility) | Beta 0.655 (moderate volatility) |
| Debt level | Debt/Equity 0.79 (neutral), Altman Z-Score 1.39 (distress zone) | Debt/Equity 0.63 (neutral), Altman Z-Score 2.29 (grey zone) |
| Regulatory Risk | Moderate, due to diverse global operations including Middle East, Africa | Moderate, primarily US-focused but subject to US regulations |
| Operational Risk | Complexity from chemical and midstream segments | Focused on oil and gas production, fewer segments |
| Environmental Risk | High, given chemical manufacturing and fossil fuel exposure | High, oil and gas production exposure |
| Geopolitical Risk | Significant, operations in geopolitically sensitive regions | Lower, US-centric operations |
In synthesis, Occidental faces higher financial distress risk and geopolitical exposure due to its international footprint and chemical operations. Devon shows stronger financial health and more moderate market risk but remains vulnerable to environmental regulation shifts. Investors should weigh Occidental’s lower volatility against its liquidity concerns and geopolitical risks, while Devon offers a more favorable risk-return profile in a stable regulatory environment.
Which Stock to Choose?
Occidental Petroleum Corporation (OXY) shows a favorable income statement with strong gross and EBIT margins but recent declines in revenue and net margin growth. Its financial ratios are mixed, with favorable valuation metrics but weaker liquidity and asset turnover. The company carries moderate debt, reflected in a B+ rating and a slightly favorable moat due to growing ROIC despite shedding value overall.
Devon Energy Corporation (DVN) demonstrates a favorable income profile with higher net margin and EBIT margin, though recent growth metrics show some weakness. Its financial ratios are largely favorable, including strong returns and coverage ratios, supported by moderate debt levels. DVN holds an A- rating and a very favorable moat, indicating a durable competitive advantage with increasing profitability.
For investors, DVN might appear more favorable given its stronger financial ratios, higher rating, and clear value creation suggested by its moat. However, OXY’s improving profitability and valuation could appeal to those monitoring recovery potential. Risk-averse investors may lean towards DVN’s stability, while those tolerating more variability might find OXY’s growth trajectory worth consideration.
Disclaimer: Investment carries a risk of loss of initial capital. The past performance is not a reliable indicator of future results. Be sure to understand risks before making an investment decision.
Go Further
I encourage you to read the complete analyses of Occidental Petroleum Corporation and Devon Energy Corporation to enhance your investment decisions: