EQT Corporation and Devon Energy Corporation are two key players in the U.S. oil and gas exploration and production sector. Both companies focus on extracting natural gas and liquids, yet they differ in scale, asset base, and operational strategies. By comparing their market positions, innovation approaches, and financial health, I aim to help you uncover which stock may offer the most compelling investment opportunity in today’s energy landscape. Let’s dive in and evaluate their potential together.
Table of contents
Companies Overview
I will begin the comparison between EQT Corporation and Devon Energy Corporation by providing an overview of these two companies and their main differences.
EQT Corporation Overview
EQT Corporation operates as a natural gas production company in the United States, focusing on natural gas and natural gas liquids (NGLs) such as ethane and propane. With 25.0T cubic feet of proved reserves and extensive acreage mainly in the Marcellus play, EQT positions itself as a leading player in the oil & gas exploration and production industry. The company is headquartered in Pittsburgh, Pennsylvania, and employs 881 full-time staff.
Devon Energy Corporation Overview
Devon Energy Corporation is an independent energy company engaged in the exploration, development, and production of oil, natural gas, and NGLs primarily in the United States. Operating over 5,100 gross wells, Devon emphasizes diversified hydrocarbon production. Founded in 1971 and based in Oklahoma City, Oklahoma, it employs 2,300 full-time employees and holds a strong position in the energy sector.
Key similarities and differences
Both EQT and Devon operate within the oil & gas exploration and production industry in the US, focusing on natural gas and natural gas liquids. EQT’s business centers more on natural gas reserves with a large footprint in the Marcellus play, while Devon manages a broader portfolio including oil and a larger number of wells. Devon employs more than twice the staff of EQT, reflecting differences in operational scale and asset management approaches.
Income Statement Comparison
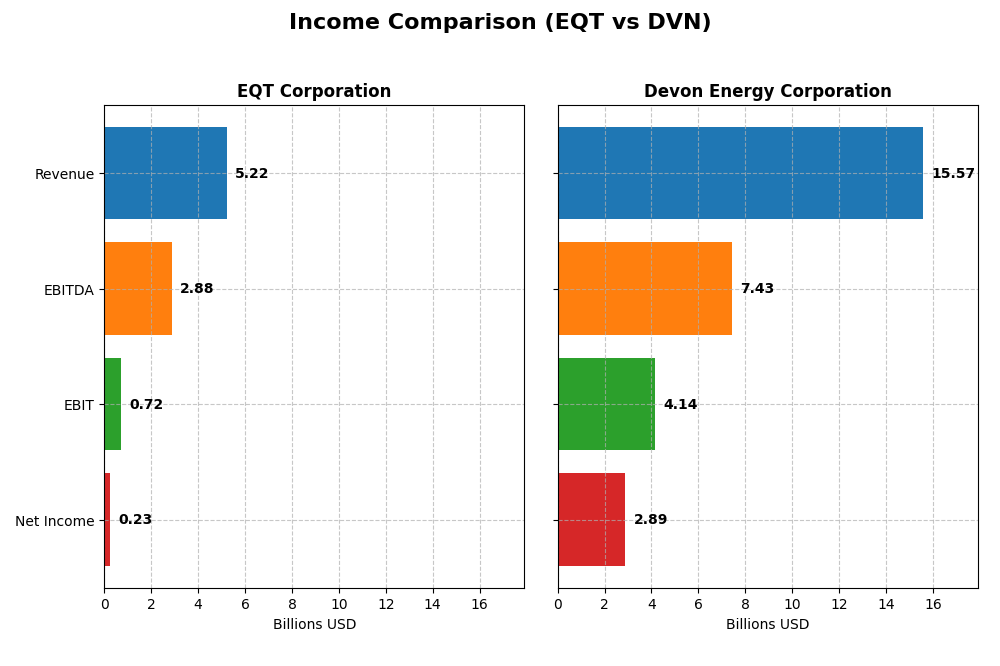
The table below presents a side-by-side comparison of key income statement metrics for EQT Corporation and Devon Energy Corporation for the fiscal year 2024.
| Metric | EQT Corporation | Devon Energy Corporation |
|---|---|---|
| Market Cap | 31.9B | 22.9B |
| Revenue | 5.22B | 15.57B |
| EBITDA | 2.88B | 7.43B |
| EBIT | 0.72B | 4.14B |
| Net Income | 0.23B | 2.89B |
| EPS | 0.45 | 4.57 |
| Fiscal Year | 2024 | 2024 |
Income Statement Interpretations
EQT Corporation
EQT Corporation’s revenue almost doubled from 2020 to 2024, with net income showing a similar upward trend, despite a sharp decline in 2024. Margins remain mostly stable; gross margin is neutral at 14.69%, while EBIT margin is favorable at 13.77%. The latest year saw slowed growth, with net and EPS margins decreasing significantly, reflecting operational challenges.
Devon Energy Corporation
Devon Energy’s revenue surged by over 250% between 2020 and 2024, with net income more than tripling. Margins are strong and favorable, including a gross margin of 27.43% and an EBIT margin of 26.58%. However, the most recent year showed a slight revenue growth slowdown and margin contractions, with net margin falling by nearly 25%, indicating pressure on profitability.
Which one has the stronger fundamentals?
Devon Energy demonstrates stronger fundamentals with higher and favorable margins across gross, EBIT, and net income, alongside significant overall growth in revenue and earnings. EQT shows favorable long-term growth but faces recent margin erosion and weaker profitability. Devon’s consistent margin strength and higher net margin suggest a more robust income statement position.
Financial Ratios Comparison
The table below presents a side-by-side comparison of key financial ratios for EQT Corporation and Devon Energy Corporation based on their most recent fiscal year 2024 data.
| Ratios | EQT Corporation | Devon Energy Corporation |
|---|---|---|
| ROE | 1.12% | 19.94% |
| ROIC | 1.66% | 10.80% |
| P/E | 101.91 | 7.05 |
| P/B | 1.14 | 1.41 |
| Current Ratio | 0.70 | 1.04 |
| Quick Ratio | 0.70 | 0.95 |
| D/E (Debt-to-Equity) | 0.45 | 0.63 |
| Debt-to-Assets | 23.5% | 30.2% |
| Interest Coverage | 1.51 | 9.40 |
| Asset Turnover | 0.13 | 0.51 |
| Fixed Asset Turnover | 0.16 | 0.61 |
| Payout Ratio | 142% | 32.4% |
| Dividend Yield | 1.39% | 4.60% |
Interpretation of the Ratios
EQT Corporation
EQT’s financial ratios show multiple weaknesses, including low net margin (4.42%) and return on equity (1.12%), both flagged as unfavorable. The company has a low current ratio (0.7), indicating liquidity concerns, and a high price-to-earnings ratio (101.91), suggesting overvaluation. Dividend yield is moderate at 1.39%, but overall, the payout appears neutral with risks due to low profitability and cash flow coverage.
Devon Energy Corporation
Devon Energy displays strong financial ratios with a high net margin (18.57%) and return on equity (19.94%), both favorable. Its price-to-earnings ratio is reasonable (7.05), and interest coverage is robust (10.32). The dividend yield of 4.6% is attractive and supported by solid earnings, indicating sustainable shareholder returns without excessive risk from distributions or buybacks.
Which one has the best ratios?
Devon Energy has the better set of financial ratios, with a majority marked favorable, including profitability, valuation, and dividend yield. EQT’s ratios are predominantly unfavorable, reflecting weaker profitability, liquidity, and valuation concerns. Devon’s stronger operational and financial metrics position it more favorably in this comparison.
Strategic Positioning
This section compares the strategic positioning of EQT Corporation and Devon Energy Corporation, including Market position, Key segments, and Exposure to technological disruption:
EQT Corporation
- Strong market position in natural gas production with moderate competitive pressure
- Key segments include natural gas, natural gas liquids (NGLs), and oil sales primarily in the US
- Exposure to technological disruption not explicitly detailed in the data
Devon Energy Corporation
- Independent energy company with competitive pressure in oil and gas exploration and production
- Focuses on oil, natural gas, and NGLs production with operations in the US and Canada
- No explicit data on technological disruption exposure provided
EQT Corporation vs Devon Energy Corporation Positioning
EQT’s strategy is concentrated on natural gas and NGLs within the US, while Devon Energy has a more diversified portfolio including oil and operations in Canada. EQT’s focus on natural gas may limit diversification, whereas Devon’s geographic and product mix offers broader exposure.
Which has the best competitive advantage?
Based on MOAT evaluation, Devon Energy shows a very favorable competitive advantage with ROIC above WACC and a strong growth trend. EQT is slightly unfavorable, shedding value despite growing profitability.
Stock Comparison
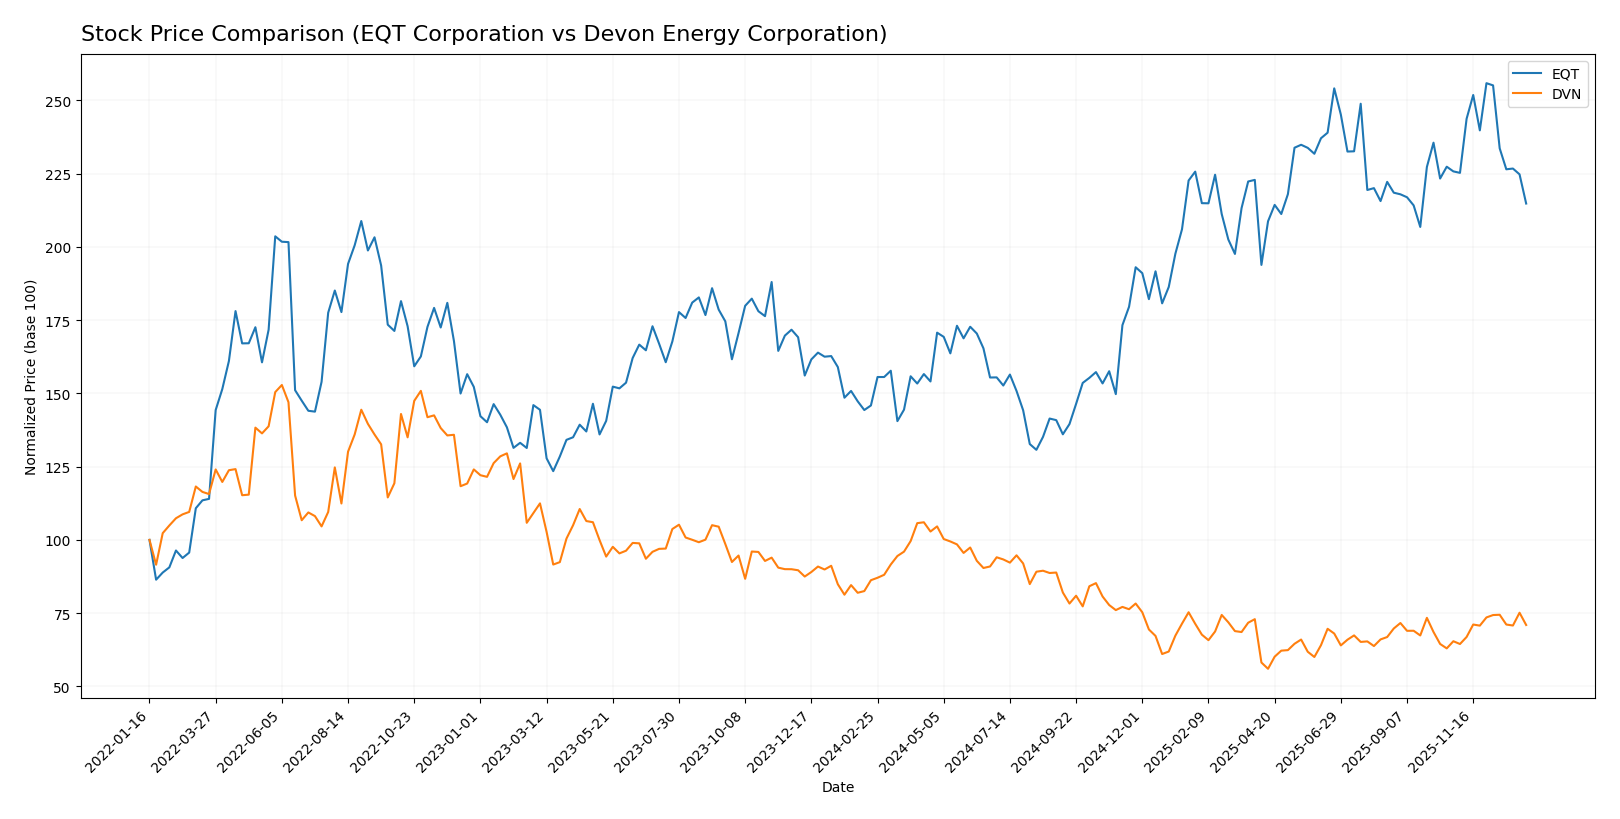
The stock price movements of EQT Corporation and Devon Energy Corporation over the past year reveal contrasting trends, with EQT showing significant gains but recent deceleration, while Devon Energy experiences overall declines with recent recovery signs.
Trend Analysis
EQT Corporation exhibits a bullish trend over the past 12 months with a 47.23% price increase, though recent months show a slight downturn of -4.86%, indicating decelerating momentum despite a high volatility of 8.62%.
Devon Energy Corporation’s stock has followed a bearish trend with a -17.72% decline over 12 months, but recent performance improved by 8.46%, suggesting accelerating recovery within lower volatility of 6.4%.
Comparing both, EQT delivered the highest market performance over the full year, while Devon Energy shows a weaker long-term trend but a positive short-term reversal.
Target Prices
The current analyst consensus presents a mixed but generally optimistic outlook for these energy companies.
| Company | Target High | Target Low | Consensus |
|---|---|---|---|
| EQT Corporation | 55 | 23 | 41.11 |
| Devon Energy Corporation | 48 | 40 | 43.5 |
Analysts expect Devon Energy’s stock price to rise significantly from its current 35.76 USD, while EQT’s consensus target of 41.11 USD is below its current price of 51.09 USD, indicating more cautious sentiment.
Analyst Opinions Comparison
This section compares analysts’ ratings and grades for EQT Corporation and Devon Energy Corporation:
Rating Comparison
EQT Rating
- Rating: A-, rated Very Favorable overall by analysts.
- Discounted Cash Flow Score: 5, considered Very Favorable, indicating strong valuation support.
- ROE Score: 4, Favorable, reflecting efficient profit generation from equity.
- ROA Score: 4, Favorable, demonstrating effective asset utilization.
- Debt To Equity Score: 2, Moderate, suggesting a moderate level of financial risk.
- Overall Score: 4, Favorable, summarizing the company’s solid financial standing.
DVN Rating
- Rating: A-, rated Very Favorable overall by analysts.
- Discounted Cash Flow Score: 4, Favorable, showing solid but slightly lower valuation.
- ROE Score: 5, Very Favorable, indicating superior profitability on equity.
- ROA Score: 5, Very Favorable, reflecting excellent asset utilization.
- Debt To Equity Score: 1, Very Unfavorable, indicating higher financial risk.
- Overall Score: 4, Favorable, summarizing the company’s solid financial standing.
Which one is the best rated?
Both EQT and DVN share the same overall rating of A- and an overall score of 4, indicating favorable financial health. DVN scores higher in ROE and ROA, but EQT has a better debt-to-equity score, reflecting lower financial risk.
Scores Comparison
Here is a comparison of the Altman Z-Score and Piotroski Score for EQT Corporation and Devon Energy Corporation:
EQT Scores
- Altman Z-Score: 2.01, indicating moderate bankruptcy risk in the grey zone.
- Piotroski Score: 8, classified as very strong financial health.
DVN Scores
- Altman Z-Score: 2.29, indicating moderate bankruptcy risk in the grey zone.
- Piotroski Score: 5, classified as average financial health.
Which company has the best scores?
EQT has a slightly lower Altman Z-Score but a much stronger Piotroski Score than Devon Energy. Based on these metrics, EQT shows stronger financial health, while both remain in the grey zone for bankruptcy risk.
Grades Comparison
Here is a comparison of the latest reliable grades assigned to EQT Corporation and Devon Energy Corporation:
EQT Corporation Grades
The following table summarizes recent grades from established grading companies for EQT Corporation:
| Grading Company | Action | New Grade | Date |
|---|---|---|---|
| Bernstein | Maintain | Outperform | 2026-01-05 |
| Citigroup | Maintain | Buy | 2025-12-19 |
| Mizuho | Maintain | Outperform | 2025-12-12 |
| UBS | Maintain | Buy | 2025-12-12 |
| Scotiabank | Maintain | Sector Perform | 2025-11-21 |
| Piper Sandler | Maintain | Neutral | 2025-11-18 |
| Wells Fargo | Maintain | Overweight | 2025-10-23 |
| UBS | Maintain | Buy | 2025-10-17 |
| Scotiabank | Maintain | Sector Perform | 2025-10-09 |
| Barclays | Maintain | Overweight | 2025-10-07 |
Overall, EQT Corporation’s grades mostly reflect a positive outlook, consistently holding “Buy” and “Outperform” ratings with some mid-range “Neutral” and “Sector Perform” evaluations.
Devon Energy Corporation Grades
The table below shows the recent grading data for Devon Energy Corporation from recognized grading firms:
| Grading Company | Action | New Grade | Date |
|---|---|---|---|
| Bernstein | Maintain | Outperform | 2026-01-05 |
| Roth Capital | Maintain | Buy | 2025-12-31 |
| Citigroup | Maintain | Buy | 2025-12-17 |
| UBS | Upgrade | Buy | 2025-12-12 |
| Mizuho | Maintain | Outperform | 2025-12-12 |
| Morgan Stanley | Maintain | Overweight | 2025-12-11 |
| JP Morgan | Upgrade | Overweight | 2025-12-08 |
| Piper Sandler | Maintain | Overweight | 2025-11-18 |
| Susquehanna | Maintain | Positive | 2025-11-12 |
| Susquehanna | Maintain | Positive | 2025-10-20 |
Devon Energy Corporation’s grades demonstrate consistent positive momentum, including several upgrades from Neutral to Buy or Overweight, indicating improving analyst sentiment.
Which company has the best grades?
Both EQT Corporation and Devon Energy Corporation hold a consensus “Buy” rating, but Devon Energy shows a stronger upgrade trend and a higher count of “Buy” and “Overweight” ratings. This suggests Devon Energy currently enjoys more bullish analyst sentiment, potentially translating to greater investor confidence.
Strengths and Weaknesses
Below is a comparative table summarizing the key strengths and weaknesses of EQT Corporation and Devon Energy Corporation based on the most recent financial and market data.
| Criterion | EQT Corporation | Devon Energy Corporation |
|---|---|---|
| Diversification | Moderate, focused on natural gas and oil sales, limited product range | Strong, significant NGL product sales and diversified US and Canada operations |
| Profitability | Low profitability with ROIC at 1.66%, net margin 4.42%, overall unfavorable ratios | High profitability with ROIC at 10.8%, net margin 18.57%, overall favorable ratios |
| Innovation | Limited data on innovation; high P/E (101.91) suggests market expectations but low ROIC | Efficient capital use, strong ROIC growth indicating effective innovation and management |
| Global presence | Primarily US-based with limited global exposure | Broader North American presence, including Canada and US segments |
| Market Share | Smaller market share in oil and gas segments with lower asset turnover | Larger market share supported by higher sales volumes and asset turnover |
EQT struggles with profitability and asset efficiency despite a growing ROIC trend, signaling operational challenges. Devon Energy stands out with strong profitability, favorable financial ratios, and a durable competitive advantage, making it a more attractive investment option currently.
Risk Analysis
Below is a comparative table outlining key risks for EQT Corporation and Devon Energy Corporation as of 2024:
| Metric | EQT Corporation | Devon Energy Corporation |
|---|---|---|
| Market Risk | Moderate (Beta 0.68) | Moderate (Beta 0.66) |
| Debt level | Low to Moderate (D/E 0.45, favorable) | Moderate (D/E 0.63, neutral) |
| Regulatory Risk | Moderate (Energy sector exposure in US) | Moderate (Energy sector exposure in US) |
| Operational Risk | Elevated (Low asset turnover, unfavorable margins) | Moderate (Better margins and efficiency) |
| Environmental Risk | Moderate (Natural gas focus, regulatory scrutiny) | Moderate (Oil & gas operations, environmental compliance) |
| Geopolitical Risk | Moderate (US-centric operations) | Moderate (US-centric operations) |
EQT faces notable operational risks due to its low profitability and asset utilization, while Devon Energy shows stronger financial health but carries moderate debt risk. Both companies are exposed to typical industry regulatory and environmental risks with moderate market volatility. Investors should monitor operational efficiency for EQT and debt management for Devon.
Which Stock to Choose?
EQT Corporation shows a mixed financial picture with moderate income growth over five years but recent declines in profitability metrics. Its financial ratios are largely unfavorable, marked by low returns and weak liquidity, though debt levels remain manageable. The overall rating is very favorable, supported by a strong DCF score but moderate leverage and valuation metrics.
Devon Energy Corporation exhibits favorable income statement metrics with strong margins and profitability despite slight recent declines. Its financial ratios are predominantly favorable, reflecting efficient asset use and solid returns, though with higher leverage concerns. The company holds a very favorable rating, buoyed by excellent profitability scores but a weak debt-to-equity score.
For investors, Devon Energy’s favorable overall income and ratio evaluations and very favorable moat suggest it could appeal to those prioritizing profitability and competitive advantage. EQT’s stable rating but weaker ratios and value destruction might be more suitable for investors focused on turnaround potential and longer-term growth trends.
Disclaimer: Investment carries a risk of loss of initial capital. The past performance is not a reliable indicator of future results. Be sure to understand risks before making an investment decision.
Go Further
I encourage you to read the complete analyses of EQT Corporation and Devon Energy Corporation to enhance your investment decisions: