In the dynamic energy sector, choosing the right stock requires a sharp eye on industry leaders. EOG Resources, Inc. and Devon Energy Corporation both operate in oil and gas exploration and production, competing primarily in the U.S. market. Their strategies emphasize innovation and efficient resource management. This article will guide you through their strengths and risks to help determine which company might be the most compelling addition to your investment portfolio.
Table of contents
Companies Overview
I will begin the comparison between EOG Resources, Inc. and Devon Energy Corporation by providing an overview of these two companies and their main differences.
EOG Overview
EOG Resources, Inc. is an independent oil and gas company focused on exploring, developing, producing, and marketing crude oil, natural gas, and natural gas liquids. Headquartered in Houston, Texas, EOG operates primarily in New Mexico, Texas, and Trinidad and Tobago. With estimated net proved reserves of 3.7B barrels of oil equivalent, it is a significant player in the Oil & Gas Exploration & Production industry.
Devon Overview
Devon Energy Corporation is an independent energy company engaged in the exploration, development, and production of oil, natural gas, and natural gas liquids in the U.S. Based in Oklahoma City, Oklahoma, Devon operates about 5,134 gross wells. It focuses on domestic production and holds a prominent position within the Oil & Gas Exploration & Production sector.
Key similarities and differences
Both companies operate in the Oil & Gas Exploration & Production industry, focusing on upstream activities such as exploration, development, and production of hydrocarbons. EOG has a larger market capitalization and broader geographic presence, including international operations, whereas Devon concentrates on U.S.-based assets with fewer employees. Both are publicly traded on the NYSE and maintain active production portfolios.
Income Statement Comparison
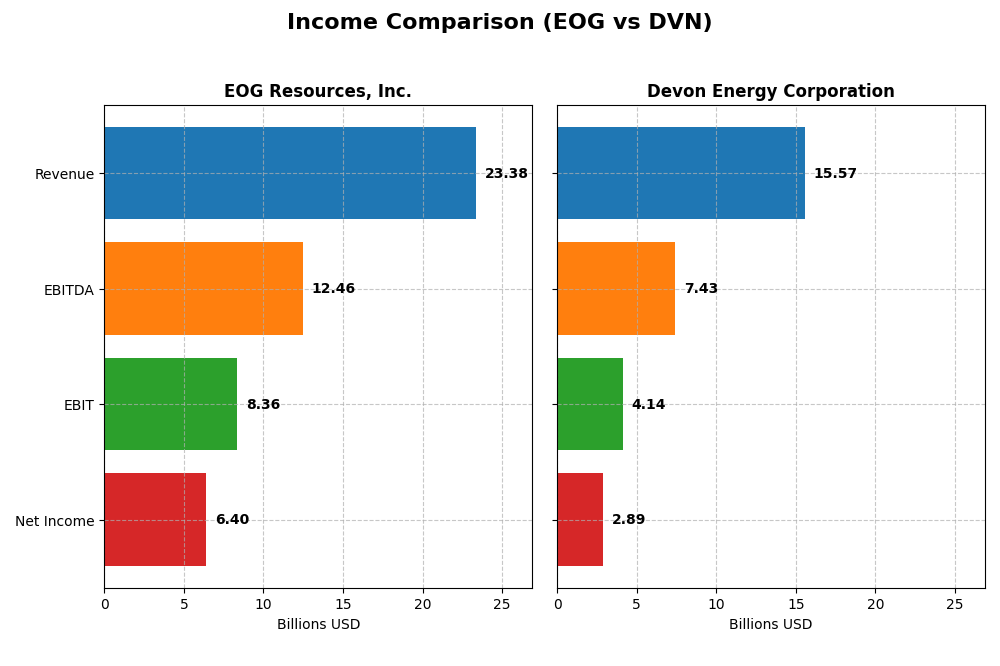
The following table presents a side-by-side comparison of key income statement metrics for EOG Resources, Inc. and Devon Energy Corporation for the fiscal year 2024.
| Metric | EOG Resources, Inc. | Devon Energy Corporation |
|---|---|---|
| Market Cap | 57.5B | 22.9B |
| Revenue | 23.4B | 15.6B |
| EBITDA | 12.5B | 7.4B |
| EBIT | 8.4B | 4.1B |
| Net Income | 6.4B | 2.9B |
| EPS | 11.31 | 4.57 |
| Fiscal Year | 2024 | 2024 |
Income Statement Interpretations
EOG Resources, Inc.
EOG Resources showed strong revenue growth of 137% from 2020 to 2024, with net income expanding over 1150% in the same period. Margins remain robust, with a 2024 gross margin of 75.7% and net margin near 27.4%. However, recent growth slowed in 2024, as revenue rose just 0.85% and net income declined 16.4%, signaling margin pressures despite solid overall fundamentals.
Devon Energy Corporation
Devon Energy’s revenue more than tripled from 2020 to 2024, increasing 258%, with net income growing 208% over the period. Margins are lower than EOG’s but stable, with a 2024 gross margin of 27.4% and net margin of 18.6%. The latest year saw modest revenue growth of 2.8% but a notable net income decline of 25%, reflecting some operational challenges despite favorable long-term trends.
Which one has the stronger fundamentals?
Both companies display favorable income statement fundamentals overall, with strong long-term growth in revenue, net income, and margins. EOG Resources boasts higher margins and greater net income growth, but recent declines in profit metrics suggest emerging headwinds. Devon Energy has lower margins but has maintained consistent expansion, though its recent profit drop is more pronounced. Each exhibits strengths and risks in their income profiles.
Financial Ratios Comparison
The table below compares key financial ratios for EOG Resources, Inc. and Devon Energy Corporation based on their latest fiscal year data (2024). These metrics provide insight into profitability, valuation, liquidity, leverage, and operational efficiency.
| Ratios | EOG Resources, Inc. | Devon Energy Corporation |
|---|---|---|
| ROE | 21.8% | 19.9% |
| ROIC | 14.8% | 10.8% |
| P/E | 10.8 | 7.1 |
| P/B | 2.36 | 1.41 |
| Current Ratio | 2.10 | 1.04 |
| Quick Ratio | 1.91 | 0.95 |
| D/E (Debt to Equity) | 0.17 | 0.63 |
| Debt-to-Assets | 10.7% | 30.2% |
| Interest Coverage | 58.6 | 9.4 |
| Asset Turnover | 0.50 | 0.51 |
| Fixed Asset Turnover | 0.68 | 0.61 |
| Payout ratio | 32.6% | 32.4% |
| Dividend yield | 3.0% | 4.6% |
Interpretation of the Ratios
EOG Resources, Inc.
EOG Resources exhibits predominantly strong financial ratios, with favorable net margin at 27.39%, ROE at 21.82%, and ROIC at 14.75%. The company maintains a solid current ratio of 2.1 and a low debt-to-equity ratio of 0.17, indicating sound liquidity and leverage management. Asset turnover ratios are weaker, suggesting room for operational efficiency improvement. EOG pays dividends, with a favorable 3.01% yield supported by sustainable free cash flow and moderate payout risks.
Devon Energy Corporation
Devon Energy shows a mixture of favorable and neutral ratios, including a net margin of 18.57%, ROE of 19.94%, and ROIC of 10.8%. Liquidity ratios like current (1.04) and quick (0.95) ratios are neutral, reflecting tighter short-term financial flexibility. Debt levels are higher than EOG’s but still manageable. The dividend yield is attractive at 4.6%, backed by consistent payouts, though free cash flow yield is negative, indicating potential distribution pressure or reinvestment needs.
Which one has the best ratios?
EOG Resources holds a more favorable overall ratio profile, with 78.57% of ratios positive versus Devon’s 57.14%. EOG’s superior liquidity, leverage, and profitability metrics outweigh Devon’s stronger dividend yield and some favorable efficiency measures. Devon’s neutral liquidity and higher debt ratios, along with negative free cash flow yield, suggest a more cautious interpretation compared to EOG’s very favorable financial standing.
Strategic Positioning
This section compares the strategic positioning of EOG Resources, Inc. and Devon Energy Corporation, focusing on Market position, Key segments, and Exposure to technological disruption:
EOG Resources, Inc.
- Leading market cap of 57B in oil & gas exploration with lower beta 0.5, indicating less volatility and competitive pressure.
- Diversified revenue streams from oil & condensate (13.9B), natural gas liquids, and natural gas production, mainly in US and Trinidad and Tobago.
- Limited explicit exposure to technological disruption mentioned, operating mainly traditional exploration and production activities.
Devon Energy Corporation
- Smaller market cap of 23B, moderate beta 0.66, facing competitive pressure in US-focused oil and gas exploration.
- Concentrated revenue primarily from natural gas liquids product sales totaling 11.2B, mostly within the United States and Canada.
- No explicit mention of technological disruption exposure; focuses on exploration and production in North America.
EOG Resources, Inc. vs Devon Energy Corporation Positioning
EOG shows a diversified business model across multiple hydrocarbons and geographies, providing broader revenue sources. Devon is more concentrated in natural gas liquids with a North American focus, which may limit diversification but enhances regional specialization.
Which has the best competitive advantage?
Both companies demonstrate a very favorable moat with growing ROIC above WACC, but EOG’s higher ROIC and larger scale imply a stronger competitive advantage and value creation over the 2020-2024 period.
Stock Comparison
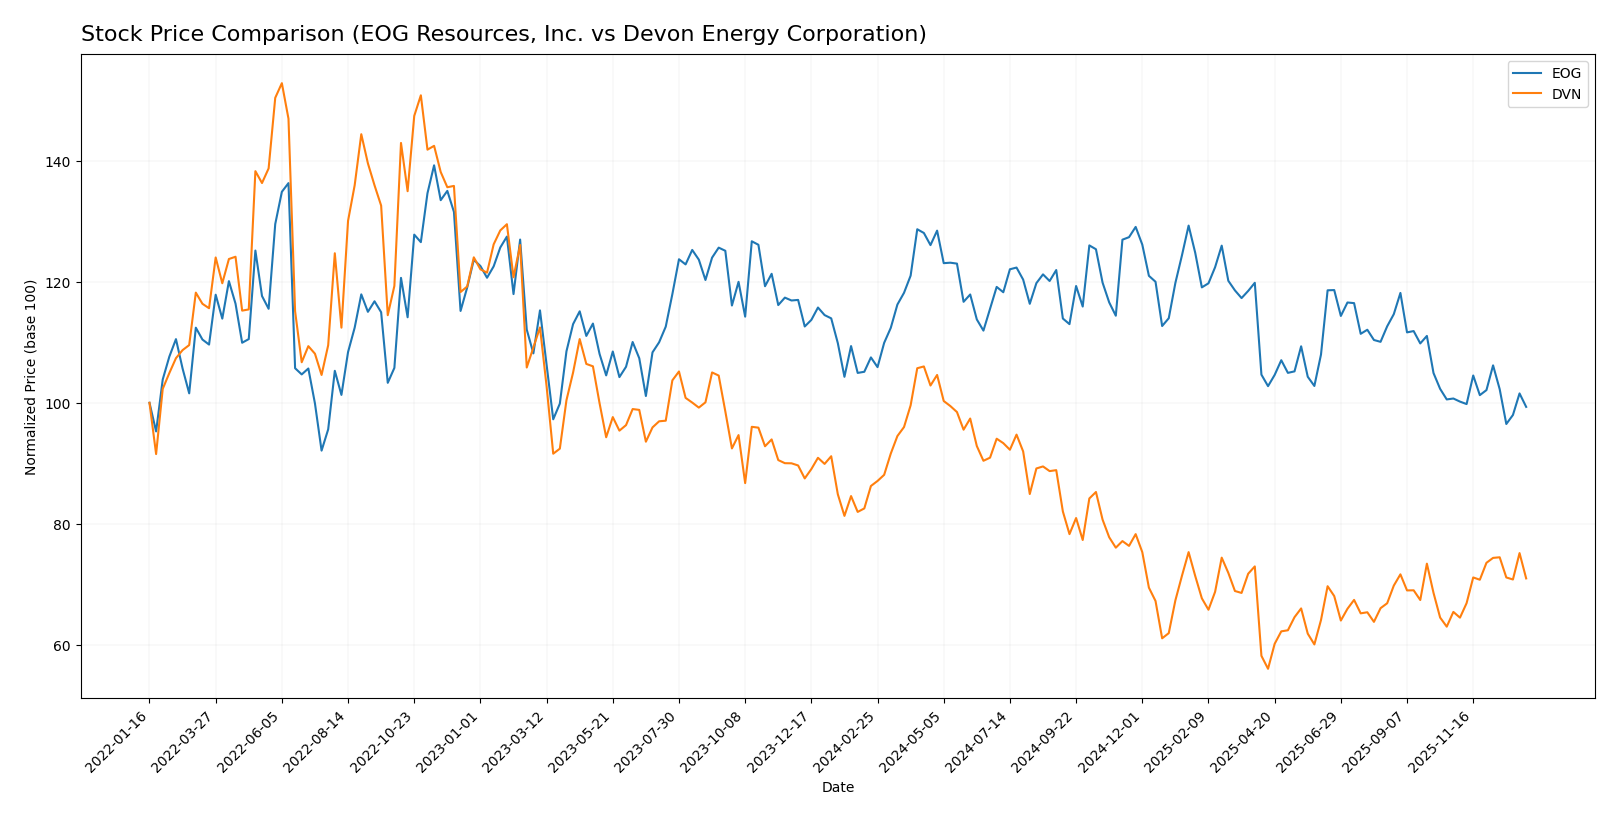
The stock price chart highlights significant bearish trends for both EOG Resources, Inc. and Devon Energy Corporation over the past year, with contrasting recent momentum and volume dynamics influencing trading activity.
Trend Analysis
EOG Resources, Inc. experienced a 7.61% price decline over the past 12 months, reflecting a bearish trend with accelerating downward momentum and notable volatility marked by an 8.9 std deviation. The highest and lowest prices reached 136.58 and 101.93 respectively.
Devon Energy Corporation showed a sharper 17.72% price decrease over the same period, also bearish with accelerating decline, but lower volatility at a 6.4 std deviation. The stock’s recent 8.46% price gain indicates a shift to bullish momentum from late 2025 to early 2026.
Comparing the two, Devon Energy delivered the lowest overall market performance in the past year despite a recent rebound, while EOG maintained a less severe decline and higher price volatility.
Target Prices
The current analyst consensus presents a cautiously optimistic outlook for these energy sector stocks.
| Company | Target High | Target Low | Consensus |
|---|---|---|---|
| EOG Resources, Inc. | 170 | 124 | 139.45 |
| Devon Energy Corporation | 48 | 40 | 43.5 |
Analysts expect EOG Resources to trade significantly above its current price of $104.92, suggesting upside potential. Devon Energy’s consensus target also exceeds its present $35.76 price, indicating moderate growth expectations.
Analyst Opinions Comparison
This section compares analysts’ ratings and grades for EOG Resources, Inc. and Devon Energy Corporation:
Rating Comparison
EOG Rating
- Rating: A- with a very favorable overall status.
- Discounted Cash Flow Score: 5, indicating very favorable valuation based on future cash flows.
- ROE Score: 5, very favorable efficiency in generating profit from equity.
- ROA Score: 5, very favorable utilization of assets to generate earnings.
- Debt To Equity Score: 2, moderate financial risk with some leverage.
- Overall Score: 4, favorable comprehensive financial standing.
DVN Rating
- Rating: A- with a very favorable overall status.
- Discounted Cash Flow Score: 4, showing favorable valuation but less than EOG.
- ROE Score: 5, very favorable and equal to EOG.
- ROA Score: 5, very favorable and equal to EOG.
- Debt To Equity Score: 1, indicating very unfavorable financial risk due to higher leverage.
- Overall Score: 4, favorable and equal to EOG.
Which one is the best rated?
Both EOG and DVN share the same overall rating of A- and identical scores for ROE, ROA, and overall financial standing. EOG scores higher on discounted cash flow and has a better debt-to-equity score, indicating a stronger valuation and lower financial risk compared to DVN.
Scores Comparison
Here is a comparison of the financial scores for EOG Resources, Inc. and Devon Energy Corporation:
EOG Scores
- Altman Z-Score: 3.34, placing EOG in the safe zone
- Piotroski Score: 5, indicating average financial strength
DVN Scores
- Altman Z-Score: 2.29, placing DVN in the grey zone
- Piotroski Score: 5, indicating average financial strength
Which company has the best scores?
EOG Resources shows a stronger Altman Z-Score in the safe zone, while Devon Energy is in the grey zone. Both companies have the same Piotroski Score of 5, reflecting average financial strength.
Grades Comparison
Here is a detailed comparison of the latest grades for EOG Resources, Inc. and Devon Energy Corporation:
EOG Resources, Inc. Grades
The table below summarizes recent grades assigned by reputable financial institutions to EOG Resources, Inc.:
| Grading Company | Action | New Grade | Date |
|---|---|---|---|
| Bernstein | Maintain | Market Perform | 2026-01-05 |
| Citigroup | Maintain | Neutral | 2025-12-17 |
| Mizuho | Maintain | Neutral | 2025-12-12 |
| UBS | Maintain | Buy | 2025-12-12 |
| Piper Sandler | Maintain | Neutral | 2025-11-18 |
| Wells Fargo | Maintain | Overweight | 2025-11-11 |
| Piper Sandler | Maintain | Neutral | 2025-10-21 |
| Susquehanna | Maintain | Positive | 2025-10-20 |
| Wells Fargo | Maintain | Overweight | 2025-10-17 |
| Morgan Stanley | Maintain | Equal Weight | 2025-10-14 |
EOG Resources’ grades mostly range from Neutral to Overweight, with UBS giving a Buy rating, reflecting a generally stable to moderately positive outlook.
Devon Energy Corporation Grades
The table below details recent grades assigned by recognized grading firms to Devon Energy Corporation:
| Grading Company | Action | New Grade | Date |
|---|---|---|---|
| Bernstein | Maintain | Outperform | 2026-01-05 |
| Roth Capital | Maintain | Buy | 2025-12-31 |
| Citigroup | Maintain | Buy | 2025-12-17 |
| UBS | Upgrade | Buy | 2025-12-12 |
| Mizuho | Maintain | Outperform | 2025-12-12 |
| Morgan Stanley | Maintain | Overweight | 2025-12-11 |
| JP Morgan | Upgrade | Overweight | 2025-12-08 |
| Piper Sandler | Maintain | Overweight | 2025-11-18 |
| Susquehanna | Maintain | Positive | 2025-11-12 |
| Susquehanna | Maintain | Positive | 2025-10-20 |
Devon Energy shows a stronger consensus with multiple Buy and Outperform ratings, including upgrades from UBS and JP Morgan, indicating an improving outlook.
Which company has the best grades?
Devon Energy Corporation holds the stronger grades overall, with several Outperform and Buy ratings and recent upgrades, whereas EOG Resources mostly receives Neutral to Overweight ratings. This difference may influence investors seeking higher growth potential or more bullish analyst sentiment.
Strengths and Weaknesses
Below is a comparison of key strengths and weaknesses between EOG Resources, Inc. (EOG) and Devon Energy Corporation (DVN), based on the most recent financial and operational data.
| Criterion | EOG Resources, Inc. | Devon Energy Corporation |
|---|---|---|
| Diversification | Strong diversification with oil, natural gas, and marketing segments; significant US and international presence | Focused primarily on NGL product sales with strong US market presence; less diversified geographically |
| Profitability | High net margin (27.39%) and ROIC (14.75%), reflecting efficient capital use and value creation | Favorable profitability with net margin 18.57% and ROIC 10.8%, but lower than EOG |
| Innovation | Demonstrates growing ROIC trend indicating successful innovation and operational improvements | Also shows growing ROIC but at a slower pace, suggesting moderate innovation efforts |
| Global presence | Significant operations in the US and Trinidad & Tobago; well-established international footprint | Mainly focused on US market with limited international exposure |
| Market Share | Large market share in oil and condensate segments with revenues over $13.9B in oil and condensate | Leading position in NGL product market with $11.2B sales, but narrower product focus |
Key takeaways: EOG Resources stands out with stronger diversification, higher profitability, and a more significant global footprint, supporting its durable competitive advantage. Devon Energy remains a solid player with favorable profitability but has a narrower focus and less geographic diversification, which may impact long-term growth potential.
Risk Analysis
Below is a comparison table of key risks for EOG Resources, Inc. and Devon Energy Corporation as of 2026:
| Metric | EOG Resources, Inc. | Devon Energy Corporation |
|---|---|---|
| Market Risk | Moderate (Beta 0.50) | Moderate (Beta 0.66) |
| Debt level | Low (Debt/Equity 0.17) | Moderate-High (Debt/Equity 0.63) |
| Regulatory Risk | Moderate | Moderate |
| Operational Risk | Moderate | Moderate |
| Environmental Risk | Elevated (Oil & Gas sector) | Elevated (Oil & Gas sector) |
| Geopolitical Risk | Moderate (US & Trinidad exposure) | Moderate (US focused) |
The most significant risks for both companies stem from environmental and regulatory pressures inherent to the oil & gas industry. Devon Energy carries higher financial leverage, increasing vulnerability to market downturns. EOG’s stronger balance sheet and lower debt suggest better risk resilience. Investors should monitor regulatory changes and commodity price volatility closely.
Which Stock to Choose?
EOG Resources, Inc. has shown strong income growth over 2020-2024, with a 136.76% revenue increase and 1158.35% net income growth. Its 2024 financial ratios are mostly favorable, with a very favorable rating, solid profitability, low debt, and an A- rating.
Devon Energy Corporation also exhibits favorable income growth, with 257.78% revenue increase and 207.71% net income growth over 2020-2024. Its 2024 financial ratios are favorable but with more neutral debt-related metrics, moderate leverage, and an A- rating.
For risk-averse investors prioritizing financial stability and strong profitability, EOG’s very favorable ratios and low debt might appear more suitable. Conversely, growth-focused investors comfortable with higher leverage could find Devon’s higher revenue growth and improving recent price trend appealing.
Disclaimer: Investment carries a risk of loss of initial capital. The past performance is not a reliable indicator of future results. Be sure to understand risks before making an investment decision.
Go Further
I encourage you to read the complete analyses of EOG Resources, Inc. and Devon Energy Corporation to enhance your investment decisions: