The energy sector continues to captivate investors seeking exposure to essential commodities and innovation in resource management. Diamondback Energy, Inc. (FANG) and Devon Energy Corporation (DVN) are two prominent players in the oil and gas exploration and production industry, both operating predominantly in the United States. Their overlapping market focus and strategic efforts in unconventional resource development make them compelling candidates for comparison. In this article, I will analyze these companies to help you identify the most promising investment opportunity.
Table of contents
Companies Overview
I will begin the comparison between Diamondback Energy, Inc. and Devon Energy Corporation by providing an overview of these two companies and their main differences.
Diamondback Energy Overview
Diamondback Energy, Inc. is an independent oil and natural gas company focused on acquiring, developing, and exploiting unconventional onshore reserves primarily in the Permian Basin in West Texas and New Mexico. Founded in 2007 and headquartered in Midland, Texas, Diamondback operates extensive midstream infrastructure including pipelines and water systems. The company holds significant acreage and producing wells, positioning itself as a key player in the oil and gas exploration and production sector.
Devon Energy Overview
Devon Energy Corporation, incorporated in 1971 and based in Oklahoma City, Oklahoma, is an independent energy company engaged in the exploration, development, and production of oil, natural gas, and natural gas liquids in the United States. It operates over 5,100 gross wells and maintains a strong presence in the energy sector. Devon is listed on the New York Stock Exchange and focuses on maximizing resource development with a workforce of approximately 2,300 full-time employees.
Key similarities and differences
Both Diamondback and Devon Energy operate in the oil and gas exploration and production industry as independent companies with a focus on upstream activities. Diamondback concentrates heavily on the Permian Basin with integrated midstream assets, while Devon has a broader U.S. footprint with a larger number of producing wells. Diamondback is younger with a smaller workforce but larger market capitalization compared to Devon, which has a longer corporate history and a higher employee count but a smaller market cap as of 2026.
Income Statement Comparison
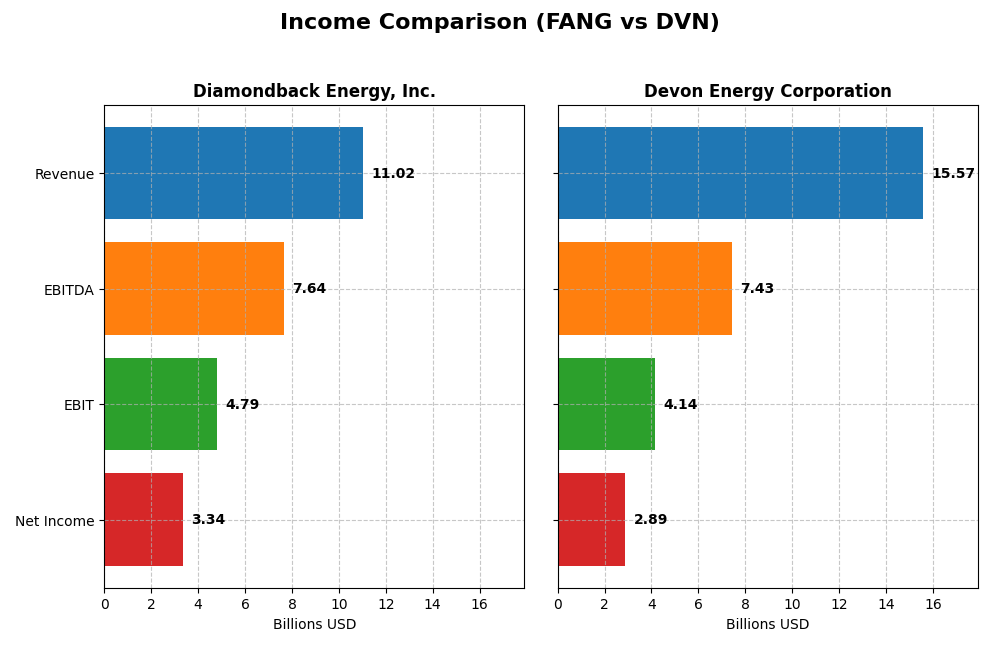
The table below compares key income statement metrics for Diamondback Energy, Inc. (FANG) and Devon Energy Corporation (DVN) for the fiscal year 2024.
| Metric | Diamondback Energy, Inc. (FANG) | Devon Energy Corporation (DVN) |
|---|---|---|
| Market Cap | 42.9B | 22.9B |
| Revenue | 11.0B | 15.6B |
| EBITDA | 7.64B | 7.43B |
| EBIT | 4.79B | 4.14B |
| Net Income | 3.34B | 2.89B |
| EPS | 15.53 | 4.57 |
| Fiscal Year | 2024 | 2024 |
Income Statement Interpretations
Diamondback Energy, Inc.
Diamondback Energy’s revenue showed a strong upward trend from $2.8B in 2020 to $11.0B in 2024, with net income rebounding from a -$4.5B loss in 2020 to $3.3B in 2024. Margins improved significantly, with a gross margin of 45.11% and net margin of 30.28% in 2024. However, recent year growth slowed in net margin and EPS despite revenue growing by 32.2%.
Devon Energy Corporation
Devon Energy’s revenue increased from $4.4B in 2020 to $15.6B in 2024, while net income improved from a loss of $2.7B in 2020 to a positive $2.9B in 2024. Margins remain moderate, with a 27.43% gross margin and 18.57% net margin in 2024. Growth rates declined in the last year, showing a 2.8% revenue increase but net margin and EPS decreased significantly.
Which one has the stronger fundamentals?
Diamondback Energy exhibits stronger fundamentals with higher margins and more robust revenue and net income growth over the period, despite some recent margin compression. Devon Energy shows solid improvement but faces more pronounced recent declines in profitability metrics. Overall, Diamondback’s favorable margin profiles and higher growth consistency suggest comparatively stronger income statement fundamentals.
Financial Ratios Comparison
The table below presents a side-by-side comparison of key financial ratios for Diamondback Energy, Inc. (FANG) and Devon Energy Corporation (DVN) based on the most recent full fiscal year data of 2024.
| Ratios | Diamondback Energy, Inc. (FANG) | Devon Energy Corporation (DVN) |
|---|---|---|
| ROE | 8.85% | 19.94% |
| ROIC | 5.75% | 10.80% |
| P/E | 10.48 | 7.05 |
| P/B | 0.93 | 1.41 |
| Current Ratio | 0.44 | 1.04 |
| Quick Ratio | 0.41 | 0.95 |
| D/E (Debt-to-Equity) | 0.33 | 0.63 |
| Debt-to-Assets | 18.47% | 30.18% |
| Interest Coverage | 15.11 | 9.40 |
| Asset Turnover | 0.16 | 0.51 |
| Fixed Asset Turnover | 0.17 | 0.61 |
| Payout Ratio | 47.27% | 32.41% |
| Dividend Yield | 4.51% | 4.60% |
Interpretation of the Ratios
Diamondback Energy, Inc.
Diamondback Energy shows a mixed ratio profile with strengths in net margin (30.28%), WACC (5.44%), and dividend yield (4.51%), indicating effective profitability and shareholder returns. However, its low current ratio (0.44) and weak asset turnover (0.16) raise liquidity and efficiency concerns. The company pays a steady dividend, supported by a reasonable payout but free cash flow coverage is negative, posing risk to sustainability.
Devon Energy Corporation
Devon Energy exhibits generally favorable ratios with a solid ROE (19.94%), ROIC (10.8%), and an attractive dividend yield of 4.6%. Liquidity ratios are neutral, reflecting balanced short-term assets and liabilities, though debt-to-equity is moderate at 0.63. The company’s dividend payments appear supported by stable cash flows, and share repurchases are not flagged as excessive, indicating prudent capital management.
Which one has the best ratios?
Both companies present a favorable overall ratio evaluation at 57.14% positive metrics, but Devon Energy stands out with stronger profitability ratios such as ROE and ROIC and better liquidity positions. Diamondback’s weaker liquidity and asset turnover ratios temper its strengths in margin and yield, making Devon’s financial profile marginally stronger from a ratio perspective.
Strategic Positioning
This section compares the strategic positioning of Diamondback Energy, Inc. (FANG) and Devon Energy Corporation (DVN), including market position, key segments, and exposure to technological disruption:
Diamondback Energy, Inc. (FANG)
- Mid-sized market cap (~43B), low beta, focused on Permian Basin oil and gas
- Primarily upstream oil and gas production with midstream infrastructure assets
- No explicit data on technological disruption exposure provided
Devon Energy Corporation (DVN)
- Smaller market cap (~23B), moderate beta, operates across U.S. with some Canadian presence
- Concentrated on oil, natural gas, and natural gas liquids production in the U.S. primarily
- No explicit data on technological disruption exposure provided
Diamondback Energy, Inc. vs Devon Energy Corporation Positioning
FANG has a diversified focus within the Permian Basin, including upstream and midstream assets, offering operational integration. DVN’s positioning is more concentrated on upstream production across multiple U.S. regions and Canada. FANG’s advantage lies in asset integration; DVN benefits from geographic diversification.
Which has the best competitive advantage?
Based on MOAT evaluation, DVN shows a very favorable competitive advantage with strong value creation and growing ROIC. FANG’s moat is slightly favorable, indicating improving profitability but not yet a clear competitive advantage.
Stock Comparison
The past year has seen Diamondback Energy, Inc. and Devon Energy Corporation both experience notable bearish trends with accelerating declines, alongside recent modest rebounds differing in strength and buyer dominance.
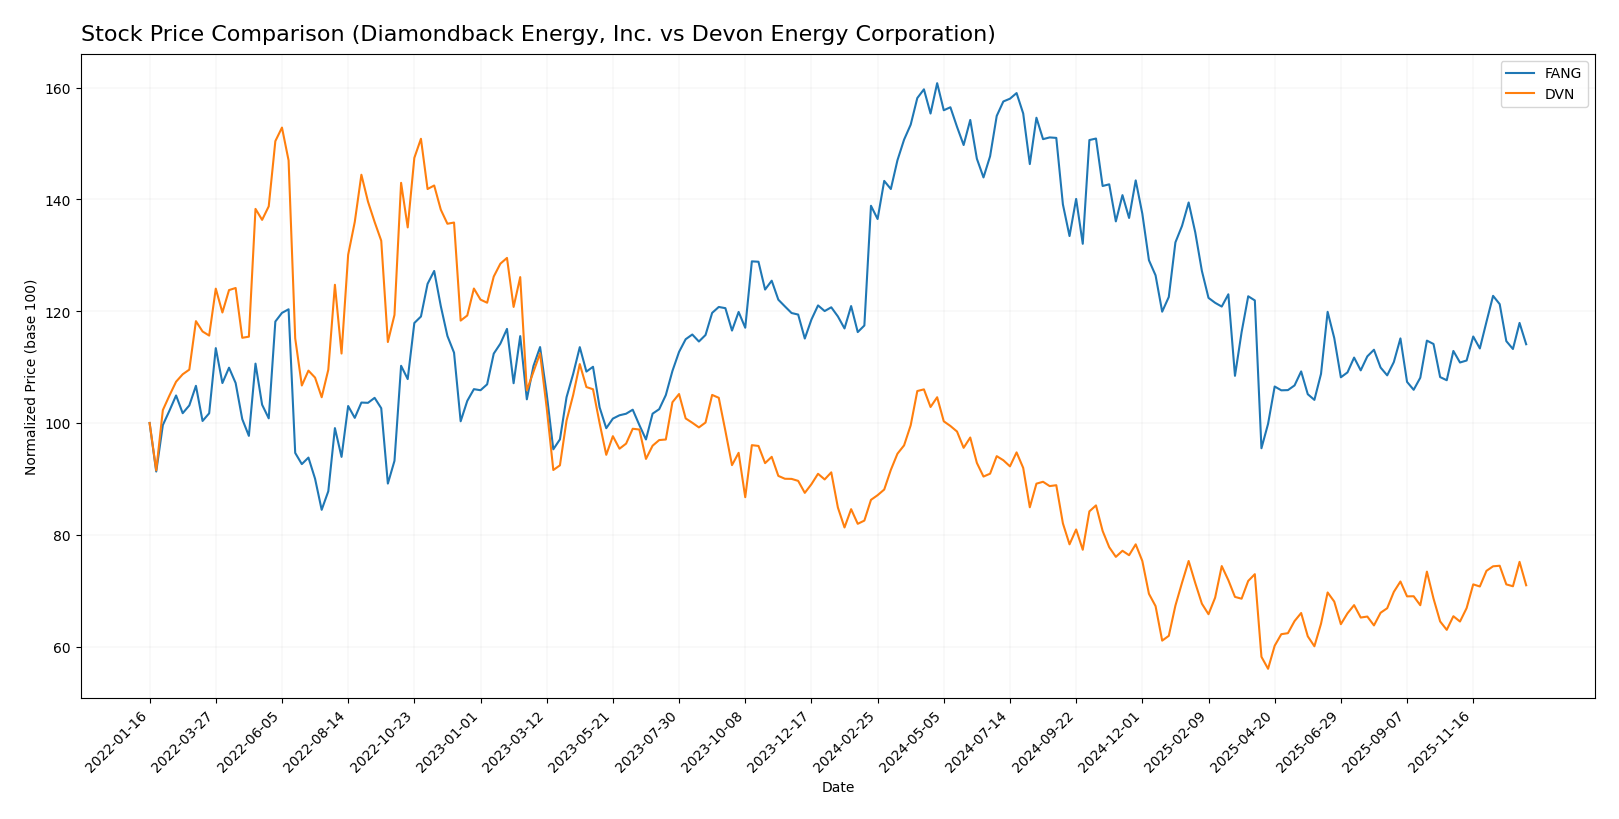
Trend Analysis
Diamondback Energy, Inc. (FANG) registered a -17.84% price decline over the past 12 months, marking a bearish trend with acceleration and high volatility indicated by a 23.76 std deviation. Recent weeks show a slight 1.06% uptrend.
Devon Energy Corporation (DVN) also faced a bearish trend, down -17.72% over 12 months with accelerating decline and lower volatility at 6.4 std deviation. The recent 8.46% price increase reflects a stronger short-term recovery.
Comparing trends, DVN delivered the highest recent market performance with an 8.46% gain versus FANG’s 1.06%, despite similarly negative annual results and accelerating bearish momentum.
Target Prices
The current analyst consensus presents optimistic target prices for both Diamondback Energy, Inc. and Devon Energy Corporation.
| Company | Target High | Target Low | Consensus |
|---|---|---|---|
| Diamondback Energy, Inc. | 219 | 162 | 185.36 |
| Devon Energy Corporation | 48 | 40 | 43.5 |
Analysts expect Diamondback Energy’s stock to rise significantly from its current price of 147.41 USD, while Devon Energy’s target prices suggest moderate upside from the current 35.76 USD. This indicates generally positive market sentiment for both energy stocks.
Analyst Opinions Comparison
This section compares analysts’ ratings and grades for Diamondback Energy, Inc. and Devon Energy Corporation:
Rating Comparison
Diamondback Energy, Inc. Rating
- Rating: A-, classified as Very Favorable by analysts.
- Discounted Cash Flow Score: 5, indicating a very favorable valuation based on future cash flows.
- ROE Score: 4, reflecting a favorable ability to generate profit from equity.
- ROA Score: 4, showing favorable asset utilization for earnings.
- Debt To Equity Score: 2, suggesting moderate financial risk due to debt levels.
- Overall Score: 4, categorized as favorable financial standing overall.
Devon Energy Corporation Rating
- Rating: A-, classified as Very Favorable by analysts.
- Discounted Cash Flow Score: 4, showing a favorable valuation based on future cash flows.
- ROE Score: 5, indicating a very favorable efficiency in generating profit from equity.
- ROA Score: 5, demonstrating very favorable asset utilization for earnings.
- Debt To Equity Score: 1, indicating very unfavorable financial risk with higher debt reliance.
- Overall Score: 4, also categorized as favorable financial standing overall.
Which one is the best rated?
Both companies hold an A- rating with an overall favorable score of 4. Devon Energy scores higher in ROE and ROA, but Diamondback Energy has a better discounted cash flow score and a more moderate debt-to-equity risk profile.
Scores Comparison
The following table compares the Altman Z-Score and Piotroski Score for Diamondback Energy and Devon Energy:
Diamondback Energy Scores
- Altman Z-Score: 1.33, in distress zone indicating higher bankruptcy risk.
- Piotroski Score: 5, assessed as average financial strength.
Devon Energy Scores
- Altman Z-Score: 2.29, in grey zone indicating moderate bankruptcy risk.
- Piotroski Score: 5, assessed as average financial strength.
Which company has the best scores?
Devon Energy has a higher Altman Z-Score in the grey zone, suggesting a lower bankruptcy risk than Diamondback Energy’s distress zone score. Both companies share the same average Piotroski Score of 5.
Grades Comparison
Here is a comparison of the latest reliable grades for Diamondback Energy, Inc. and Devon Energy Corporation:
Diamondback Energy, Inc. Grades
Below is a summary table of recent grades from established grading companies for Diamondback Energy, Inc.
| Grading Company | Action | New Grade | Date |
|---|---|---|---|
| Wells Fargo | Maintain | Overweight | 2024-10-18 |
| Susquehanna | Maintain | Positive | 2024-10-18 |
| Keybanc | Maintain | Overweight | 2024-10-16 |
| Truist Securities | Maintain | Buy | 2024-10-16 |
| Piper Sandler | Maintain | Overweight | 2024-10-15 |
| Scotiabank | Maintain | Sector Outperform | 2024-10-10 |
| BMO Capital | Upgrade | Outperform | 2024-10-04 |
| Benchmark | Maintain | Buy | 2024-10-03 |
| Barclays | Upgrade | Overweight | 2024-10-02 |
| Wells Fargo | Maintain | Overweight | 2024-10-01 |
The grades for Diamondback Energy are consistently positive, with multiple “Overweight,” “Buy,” and “Outperform” ratings, including recent upgrades, indicating a generally favorable outlook.
Devon Energy Corporation Grades
Below is a summary table of recent grades from established grading companies for Devon Energy Corporation.
| Grading Company | Action | New Grade | Date |
|---|---|---|---|
| Bernstein | Maintain | Outperform | 2026-01-05 |
| Roth Capital | Maintain | Buy | 2025-12-31 |
| Citigroup | Maintain | Buy | 2025-12-17 |
| UBS | Upgrade | Buy | 2025-12-12 |
| Mizuho | Maintain | Outperform | 2025-12-12 |
| Morgan Stanley | Maintain | Overweight | 2025-12-11 |
| JP Morgan | Upgrade | Overweight | 2025-12-08 |
| Piper Sandler | Maintain | Overweight | 2025-11-18 |
| Susquehanna | Maintain | Positive | 2025-11-12 |
| Susquehanna | Maintain | Positive | 2025-10-20 |
Devon Energy holds a strong consensus with many “Buy,” “Outperform,” and “Overweight” ratings, supported by recent upgrades, reflecting a solid and confident analyst sentiment.
Which company has the best grades?
Both Diamondback Energy and Devon Energy have received predominantly positive grades with consistent “Buy” and “Outperform” ratings. Devon Energy shows a slightly broader range of recent upgrades and a longer span of maintained positive ratings, which may imply stronger analyst conviction. Investors might interpret these grades as an indicator of relative confidence and potential upside, but should consider other factors before making decisions.
Strengths and Weaknesses
Here is a comparative overview of key strengths and weaknesses of Diamondback Energy, Inc. (FANG) and Devon Energy Corporation (DVN) based on recent financial and operational data:
| Criterion | Diamondback Energy, Inc. (FANG) | Devon Energy Corporation (DVN) |
|---|---|---|
| Diversification | Limited, mainly upstream services (~$8.3B in 2023) with small midstream segment | Focused on NGL product sales (~$11.2B in 2024), with broader asset base |
| Profitability | Net margin 30.28% (favorable), ROE 8.85% (unfavorable), ROIC 5.75% (neutral) | Net margin 18.57% (favorable), ROE 19.94% (favorable), ROIC 10.8% (favorable) |
| Innovation | Moderate, ROIC growing but still shedding value overall | Strong, with very favorable moat and growing ROIC indicating durable competitive advantage |
| Global presence | Primarily US-based operations, smaller scale | Larger scale with diversified US and Canada presence |
| Market Share | Midstream and upstream energy niche, modest asset turnover (0.16) | Larger market share in NGL sales, higher asset turnover (0.51) |
Key takeaways: Devon Energy shows stronger profitability, a more durable competitive advantage, and better asset utilization. Diamondback Energy is growing profitably but has a narrower focus and some financial weaknesses, suggesting higher risk. Investors prioritizing stability and value creation may favor Devon, while those seeking growth potential might consider Diamondback with caution.
Risk Analysis
The following table outlines key risk factors for Diamondback Energy, Inc. (FANG) and Devon Energy Corporation (DVN) based on the latest 2024 data.
| Metric | Diamondback Energy, Inc. (FANG) | Devon Energy Corporation (DVN) |
|---|---|---|
| Market Risk | Moderate (Beta: 0.58) | Moderate (Beta: 0.66) |
| Debt level | Low (Debt-to-Equity: 0.33) | Moderate (Debt-to-Equity: 0.63) |
| Regulatory Risk | Significant (Environmental regulations on fossil fuels) | Significant (Same sector regulatory exposure) |
| Operational Risk | Moderate (Low asset turnover 0.16) | Moderate (Higher asset turnover 0.51) |
| Environmental Risk | High (Oil & Gas sector exposure) | High (Oil & Gas sector exposure) |
| Geopolitical Risk | Moderate (US-centric operations) | Moderate (US-centric operations) |
Both companies face notable environmental and regulatory risks due to their oil and gas operations amid increasing climate policies. Diamondback’s lower debt level reduces financial risk compared to Devon, which carries more leverage. Market risk is moderate for both, reflected in their betas below 1. Operationally, Diamondback’s asset turnover is quite low, suggesting less efficiency. Devon’s Altman Z-Score in the grey zone signals moderate bankruptcy risk, while Diamondback is in the distress zone, indicating higher financial vulnerability. Investors should weigh these risks carefully, especially considering the volatile energy sector environment.
Which Stock to Choose?
Diamondback Energy, Inc. (FANG) shows a favorable income evolution with strong revenue growth of 32.19% in 2024 and a solid net margin of 30.28%. Its financial ratios are mostly favorable, though liquidity ratios are weak. Profitability is moderate with ROE at 8.85%, and debt levels are conservative with a favorable debt-to-equity ratio. The overall rating is very favorable (A-), despite an Altman Z-Score in the distress zone.
Devon Energy Corporation (DVN) displays a positive income evolution with moderate revenue growth of 2.82% in 2024 and a net margin of 18.57%. Financial ratios are largely favorable, especially profitability metrics like ROE at 19.94%, though its debt profile is less favorable. The rating is very favorable (A-) with a grey zone Altman Z-Score, suggesting moderate financial risk.
Investors focused on growth might find Diamondback Energy’s strong revenue and net margin growth appealing, while those prioritizing profitability and a durable competitive advantage could see Devon Energy as more favorable given its higher ROE and very favorable moat status. Both stocks exhibit bearish price trends overall but show recent positive momentum.
Disclaimer: Investment carries a risk of loss of initial capital. The past performance is not a reliable indicator of future results. Be sure to understand risks before making an investment decision.
Go Further
I encourage you to read the complete analyses of Diamondback Energy, Inc. and Devon Energy Corporation to enhance your investment decisions: