In the dynamic world of uranium mining, Denison Mines Corp. and IsoEnergy Ltd. stand out as key players with promising prospects. Both companies operate in Canada’s Athabasca Basin, a globally significant uranium district, and focus on exploration and development. While Denison boasts a larger market presence, IsoEnergy’s innovative projects offer fresh potential. This article will help you decide which company holds the most interest for your investment portfolio.
Table of contents
Companies Overview
I will begin the comparison between Denison Mines Corp. and IsoEnergy Ltd. by providing an overview of these two companies and their main differences.
Denison Mines Corp. Overview
Denison Mines Corp. focuses on uranium acquisition, exploration, development, and processing, holding a 95% interest in the Wheeler River uranium project in Saskatchewan’s Athabasca Basin. Founded in 1997 and headquartered in Toronto, Canada, Denison is well-established within the uranium sector, with a market cap of approximately 3B USD and a workforce of 65 employees.
IsoEnergy Ltd. Overview
IsoEnergy Ltd. specializes in acquiring, developing, and exploring uranium mineral properties primarily in the Athabasca Basin, including Larocque East and other sites. Incorporated in 2016 and based in Saskatoon, Canada, IsoEnergy is a smaller player with a market cap near 600M USD and 18 employees, operating as a subsidiary of NexGen Energy Ltd.
Key similarities and differences
Both companies operate in the uranium sector with a focus on properties in Canada’s Athabasca Basin, emphasizing exploration and development. Denison Mines is significantly larger in market capitalization and employee count, and more established, while IsoEnergy is newer and smaller, operating under a parent company. Their business models align on resource acquisition and development but differ in scale and corporate structure.
Income Statement Comparison
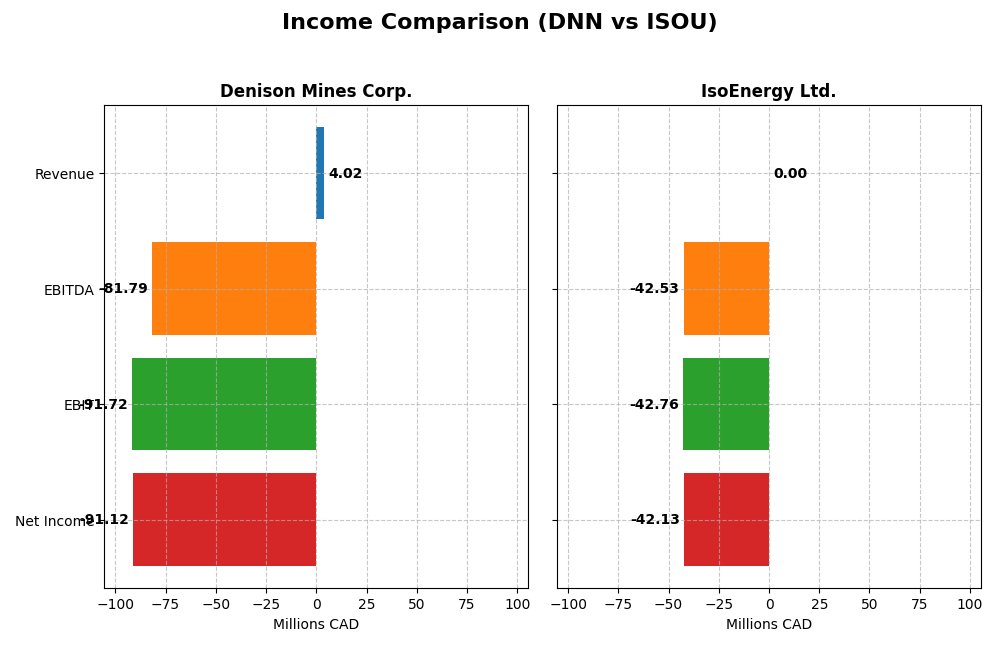
This table compares key income statement metrics for Denison Mines Corp. and IsoEnergy Ltd. for the fiscal year 2024.
| Metric | Denison Mines Corp. (DNN) | IsoEnergy Ltd. (ISOU) |
|---|---|---|
| Market Cap | 2.97B CAD | 599M CAD |
| Revenue | 4.0M CAD | 0 CAD |
| EBITDA | -81.8M CAD | -42.5M CAD |
| EBIT | -91.7M CAD | -42.8M CAD |
| Net Income | -91.1M CAD | -42.1M CAD |
| EPS | -0.10 CAD | -1.38 CAD |
| Fiscal Year | 2024 | 2024 |
Income Statement Interpretations
Denison Mines Corp.
Denison Mines Corp. experienced a significant decline in revenue and net income from 2020 to 2024, with revenue dropping by 72% overall and net income turning deeply negative in 2024 at -91.1M CAD. Margins deteriorated substantially, as seen in a negative gross margin of -19.69% and a net margin plummeting to -2264.95%. The 2024 year showed a revenue rebound of 116.87%, but margins and profitability worsened sharply, indicating operational challenges.
IsoEnergy Ltd.
IsoEnergy Ltd. reported zero revenue throughout 2020-2024, resulting in continuous net losses growing from -9.5M CAD in 2020 to -42.1M CAD in 2024. Margins remained unfavorable with nil gross and EBIT margins. The latest fiscal year saw a deepening net loss and a 76.47% decline in EPS, reflecting no commercial revenue and rising operating expenses, which negatively impacted overall financial health.
Which one has the stronger fundamentals?
Both companies show unfavorable income statement fundamentals, with Denison exhibiting large net losses and deteriorating margins despite recent revenue growth. IsoEnergy, lacking any revenue, incurred escalating losses and stable negative margins. Denison’s partial revenue recovery contrasts with IsoEnergy’s zero revenue, yet both face critical profitability and margin weaknesses, presenting significant risks for investors.
Financial Ratios Comparison
The table below presents a side-by-side comparison of the most recent financial ratios for Denison Mines Corp. and IsoEnergy Ltd. as of fiscal year 2024, providing insight into their profitability, liquidity, leverage, and valuation metrics.
| Ratios | Denison Mines Corp. (DNN) | IsoEnergy Ltd. (ISOU) |
|---|---|---|
| ROE | -16.1% | -13.9% |
| ROIC | -10.0% | -12.5% |
| P/E | -25.3 | -9.6 |
| P/B | 4.09 | 1.34 |
| Current Ratio | 3.65 | 1.70 |
| Quick Ratio | 3.54 | 1.70 |
| D/E (Debt-to-Equity) | 0 | 0.10 |
| Debt-to-Assets | 0 | 9.0% |
| Interest Coverage | -586.3 | -32.1 |
| Asset Turnover | 0.0061 | 0 |
| Fixed Asset Turnover | 0.0155 | 0 |
| Payout ratio | 0 | 0 |
| Dividend yield | 0 | 0 |
Interpretation of the Ratios
Denison Mines Corp.
Denison Mines shows mostly unfavorable financial ratios in 2024, with negative net margin (-2264.95%) and return on equity (-16.15%), indicating operational and profitability challenges. Its quick ratio (3.54) is favorable, suggesting good short-term liquidity, but interest coverage is deeply negative (-849.24), a concern for debt servicing. The company does not pay dividends, likely reflecting reinvestment needs or losses.
IsoEnergy Ltd.
IsoEnergy’s 2024 ratios present a mixed picture with 42.86% favorable and 50% unfavorable ratios, including a negative return on equity (-13.9%) and net margin of zero. Liquidity ratios (current and quick) are favorable at 1.7, and debt levels appear manageable. Like Denison Mines, IsoEnergy pays no dividends, possibly due to ongoing development and reinvestment priorities in its growth phase.
Which one has the best ratios?
IsoEnergy holds a slightly more favorable ratio profile than Denison Mines, with a higher proportion of favorable metrics and better debt management. However, both companies face profitability and operational challenges, reflected in negative returns and weak interest coverage. Overall, IsoEnergy’s ratios appear less unfavorable but still warrant cautious evaluation.
Strategic Positioning
This section compares the strategic positioning of Denison Mines Corp. and IsoEnergy Ltd., focusing on market position, key segments, and exposure to technological disruption:
Denison Mines Corp.
- Established uranium producer with flagship Wheeler River project, facing competitive pressure in Canadian uranium market.
- Focused on uranium acquisition, exploration, development, and processing mainly in Canada’s Athabasca Basin.
- No explicit data on exposure to technological disruption; operates in traditional uranium mining and processing.
IsoEnergy Ltd.
- Emerging uranium explorer with diversified Athabasca Basin properties, subsidiary of NexGen Energy.
- Engages in uranium acquisition, development, and exploration across multiple basin properties in Canada.
- No explicit data on exposure to technological disruption; active in uranium exploration and development.
Denison Mines Corp. vs IsoEnergy Ltd. Positioning
Denison Mines has a concentrated strategic focus on a flagship uranium project with established operations, while IsoEnergy pursues broader exploration across multiple properties. Denison’s scale offers potential operational stability, whereas IsoEnergy’s diversification implies exploratory risk and growth potential.
Which has the best competitive advantage?
Both companies show unfavorable MOAT evaluations, indicating value destruction. Denison’s stable but negative returns contrast with IsoEnergy’s improving profitability trend, suggesting neither currently holds a strong competitive advantage.
Stock Comparison
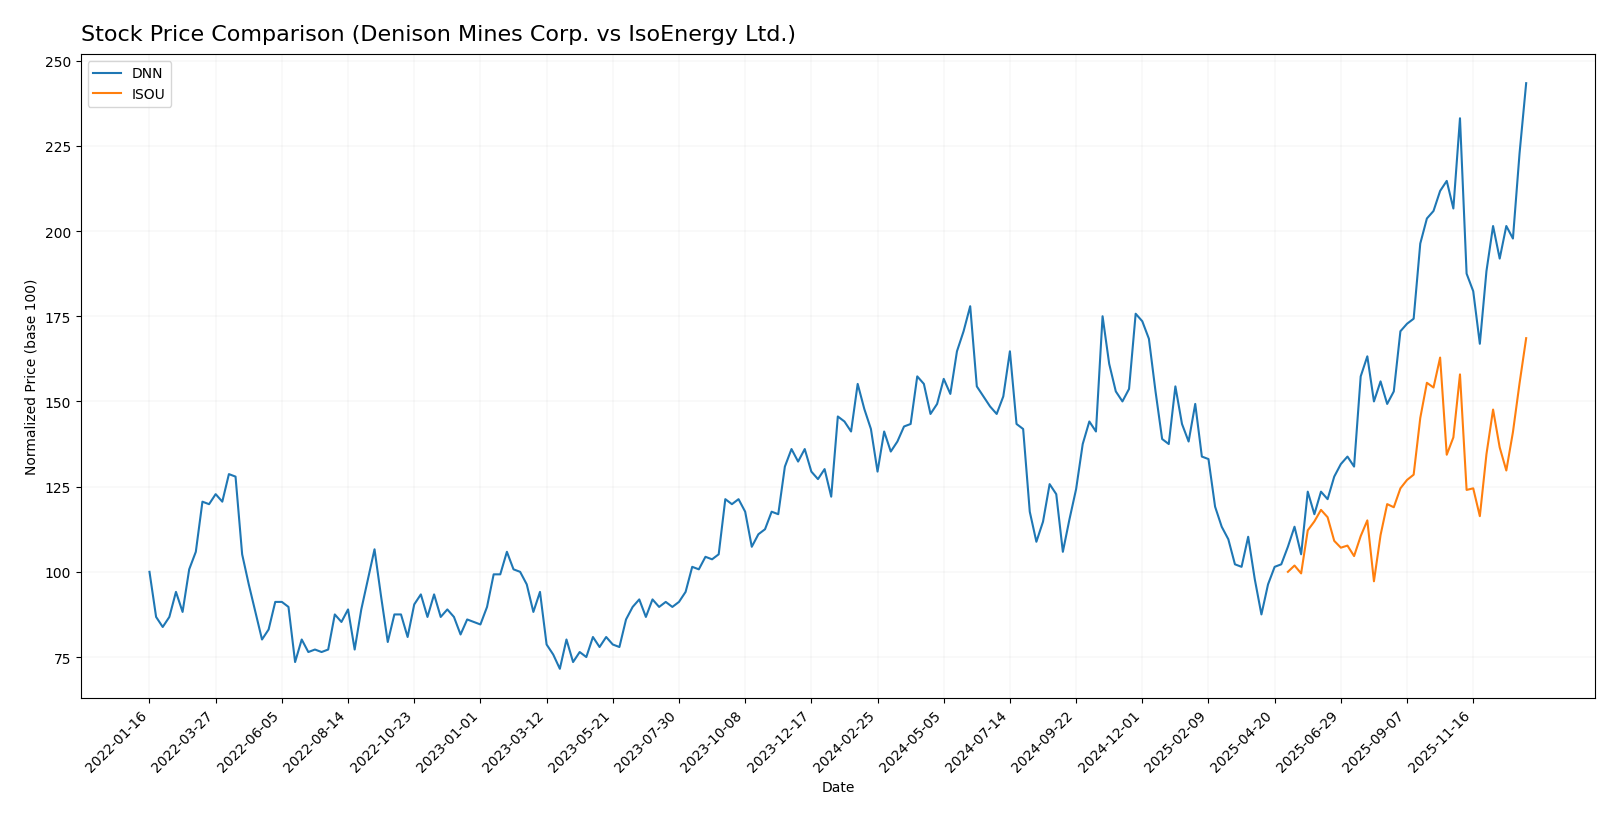
The stock prices of Denison Mines Corp. (DNN) and IsoEnergy Ltd. (ISOU) have shown strong bullish momentum over the past 12 months, with both stocks experiencing significant gains and accelerating upward trends.
Trend Analysis
Denison Mines Corp. (DNN) recorded a 71.5% price increase over the past year, showing a bullish trend with acceleration. The stock moved between a low of 1.19 and a high of 3.31, with moderate volatility (std dev 0.44).
IsoEnergy Ltd. (ISOU) posted a 68.57% gain over the same period, also bullish and accelerating. Its price fluctuated from 6.31 to 10.94 with higher volatility (std dev 1.25).
Comparatively, DNN outperformed ISOU slightly in market performance over the year, despite ISOU exhibiting higher volatility and stronger buyer dominance recently.
Target Prices
A clear consensus target price is available for Denison Mines Corp.
| Company | Target High | Target Low | Consensus |
|---|---|---|---|
| Denison Mines Corp. | 2.6 | 2.6 | 2.6 |
Analysts expect Denison Mines’ stock to trade around $2.60, which is notably below the current price of $3.31, indicating potential downside risk. No verified target price data is available for IsoEnergy Ltd.
Analyst Opinions Comparison
This section compares analysts’ ratings and grades for Denison Mines Corp. and IsoEnergy Ltd.:
Rating Comparison
Denison Mines Corp. Rating
- Rating: C-, considered very favorable by analysts.
- Discounted Cash Flow Score: Moderate at 3, indicating average valuation based on future cash flows.
- ROE Score: Very unfavorable at 1, showing low efficiency in generating profit from equity.
- ROA Score: Very unfavorable at 1, reflecting poor asset utilization.
- Debt To Equity Score: Very unfavorable at 1, implying higher financial risk due to debt.
- Overall Score: Very unfavorable at 1, summarizing weak financial health.
IsoEnergy Ltd. Rating
- Rating: C-, also considered very favorable by analysts.
- Discounted Cash Flow Score: Very unfavorable at 1, suggesting poor valuation outlook.
- ROE Score: Very unfavorable at 1, similarly low efficiency in profit generation.
- ROA Score: Very unfavorable at 1, also indicating ineffective asset use.
- Debt To Equity Score: Moderate at 3, showing relatively better financial stability.
- Overall Score: Very unfavorable at 1, similarly indicating weak financial health.
Which one is the best rated?
Both companies share the same overall rating of C- and identical very unfavorable overall scores of 1. Denison Mines has a stronger discounted cash flow score, while IsoEnergy shows a better debt-to-equity score. Neither company stands out clearly as better rated.
Scores Comparison
Here is a comparison of the Altman Z-Score and Piotroski Score for Denison Mines Corp. and IsoEnergy Ltd.:
DNN Scores
- Altman Z-Score: 0.73, indicating distress zone and high bankruptcy risk.
- Piotroski Score: 4, reflecting average financial strength.
ISOU Scores
- Altman Z-Score: 19.22, indicating safe zone and low bankruptcy risk.
- Piotroski Score: 2, reflecting very weak financial strength.
Which company has the best scores?
IsoEnergy Ltd. shows a much stronger Altman Z-Score, placing it in the safe zone, whereas Denison Mines is in financial distress. However, Denison Mines has a higher Piotroski Score, indicating better financial strength than IsoEnergy.
Grades Comparison
Here is the comparison of available grades for Denison Mines Corp. and IsoEnergy Ltd.:
Denison Mines Corp. Grades
This table shows recent and historical analyst grades for Denison Mines Corp.:
| Grading Company | Action | New Grade | Date |
|---|---|---|---|
| Roth MKM | Maintain | Buy | 2024-10-23 |
| TD Securities | Maintain | Speculative Buy | 2023-06-27 |
| Raymond James | Maintain | Outperform | 2023-06-27 |
| TD Securities | Maintain | Speculative Buy | 2023-06-26 |
| Raymond James | Maintain | Outperform | 2023-06-26 |
| Credit Suisse | Downgrade | Underperform | 2017-07-18 |
| Credit Suisse | Downgrade | Underperform | 2017-07-17 |
| Roth Capital | Maintain | Buy | 2016-02-10 |
| Credit Suisse | Upgrade | Neutral | 2014-04-01 |
| Credit Suisse | Upgrade | Neutral | 2014-03-31 |
The overall trend shows consistent buy and outperform ratings from reputable firms recently, with some downgrades in earlier years.
IsoEnergy Ltd. has no available reliable grades from verifiable grading companies.
Which company has the best grades?
Denison Mines Corp. has received multiple buy, speculative buy, and outperform grades from established firms, while IsoEnergy Ltd. lacks any reliable grades. This suggests Denison Mines has stronger analyst support, which could influence investor confidence and portfolio decisions.
Strengths and Weaknesses
Below is a comparison of key strengths and weaknesses for Denison Mines Corp. (DNN) and IsoEnergy Ltd. (ISOU) based on their latest financial and operational data.
| Criterion | Denison Mines Corp. (DNN) | IsoEnergy Ltd. (ISOU) |
|---|---|---|
| Diversification | Limited diversification; focused on uranium mining | Limited diversification; uranium exploration focus |
| Profitability | Negative net margin (-2264.95%), ROIC -10.03%, value destroying | Negative net margin (0%), ROIC -12.5%, value destroying but improving ROIC |
| Innovation | No significant innovation data available, stable but unfavorable financials | Growing ROIC indicates improving operational efficiency and potential innovation in exploration |
| Global presence | Moderate, primarily North America focused | Smaller scale, exploration phase, limited global presence |
| Market Share | Established in uranium market but financially weak | Emerging player, smaller market share but with growth potential |
Key takeaways: Both companies face profitability challenges, with Denison Mines showing more severe financial difficulties. IsoEnergy, while still unprofitable, exhibits improving returns on capital, suggesting potential for future value creation. Investors should consider IsoEnergy’s growth trajectory but remain cautious due to overall sector risks and limited diversification.
Risk Analysis
Below is a comparative table of key risks for Denison Mines Corp. (DNN) and IsoEnergy Ltd. (ISOU) based on the most recent data from 2024.
| Metric | Denison Mines Corp. (DNN) | IsoEnergy Ltd. (ISOU) |
|---|---|---|
| Market Risk | High beta 1.89 indicates higher volatility; uranium sector exposure | Moderate beta 0.955; uranium sector with less price volatility |
| Debt level | Debt-free (0 DE ratio); very low financial risk | Low debt (DE 0.1); moderate financial stability |
| Regulatory Risk | High, due to uranium mining regulations in Canada | High, similar regulatory environment in uranium mining |
| Operational Risk | Low employee count (65); potential operational scale limits | Very low employee count (18); higher operational risk due to scale |
| Environmental Risk | High, uranium mining involves significant environmental compliance | High, uranium exploration exposes to environmental constraints |
| Geopolitical Risk | Moderate, Canadian operations with stable political risk | Moderate, same Canadian jurisdiction with political stability |
Denison Mines faces significant market volatility and regulatory risks typical of uranium mining, though its debt-free status reduces financial strain. IsoEnergy benefits from moderate financial stability but has higher operational risk due to smaller scale. Environmental and regulatory risks are impactful for both, given the sensitive nature of uranium operations.
Which Stock to Choose?
Denison Mines Corp. (DNN) shows a mixed income evolution with a strong 116.87% revenue growth in 2024 but overall unfavorable profitability and financial ratios, including negative ROE (-16.15%) and ROIC (-10.03%), although it carries no debt and has a high current ratio. Its rating is very favorable at C-, despite many unfavorable financial scores.
IsoEnergy Ltd. (ISOU) displays stagnant revenue with no growth over the last year, negative profitability metrics including ROE (-13.9%) and ROIC (-12.5%), moderate debt levels, and a current ratio of 1.7. Its rating also stands at C- with slightly better financial ratios but an overall slightly unfavorable income statement.
Investors focused on growth may find DNN’s sharp recent revenue increase and zero debt attractive despite its negative profitability and unfavorable overall financial health. Conversely, more risk-tolerant investors might consider ISOU’s improving ROIC trend and moderate financial ratios, although it faces stagnant income and higher debt. Both companies currently demonstrate value destruction, but ISOU shows signs of improving profitability.
Disclaimer: Investment carries a risk of loss of initial capital. The past performance is not a reliable indicator of future results. Be sure to understand risks before making an investment decision.
Go Further
I encourage you to read the complete analyses of Denison Mines Corp. and IsoEnergy Ltd. to enhance your investment decisions: