Home > Comparison > Technology > DELL vs WDC
The strategic rivalry between Dell Technologies Inc. and Western Digital Corporation defines the current trajectory of the Technology sector’s Computer Hardware industry. Dell operates a diversified model spanning IT infrastructure, client solutions, and cloud services, while Western Digital focuses on specialized data storage devices and solutions. This analysis pits diversification against focused innovation, aiming to identify which firm delivers superior risk-adjusted returns for a balanced portfolio in 2026.
Table of contents
Companies Overview
Dell Technologies and Western Digital stand as pivotal players shaping the computer hardware landscape.
Dell Technologies Inc.: Integrated IT Solutions Powerhouse
Dell Technologies leads in IT infrastructure and client solutions, generating revenue through hardware sales and cloud software services. Its strategic focus in 2026 emphasizes hybrid and multi-cloud environments, bolstered by VMware’s software offerings. The company balances traditional storage and modern cloud solutions, aiming to transform business IT infrastructure globally.
Western Digital Corporation: Data Storage Specialist
Western Digital dominates the data storage devices market, specializing in HDDs, SSDs, and flash products for consumer and enterprise clients. Its 2026 strategy prioritizes expanding data center solutions and embedded storage for diverse applications, including IoT and automotive. The firm leverages its strong brand portfolio to capture growing demand in digital storage across multiple industries.
Strategic Collision: Similarities & Divergences
Both firms operate within computer hardware but diverge sharply: Dell pursues an integrated ecosystem blending hardware and cloud software, while Western Digital focuses on specialized storage technology. Their battleground centers on enterprise data management and storage innovation. Investors will find Dell’s hybrid cloud approach contrasts with Western Digital’s deep storage expertise, reflecting distinct risk and growth profiles.
Income Statement Comparison
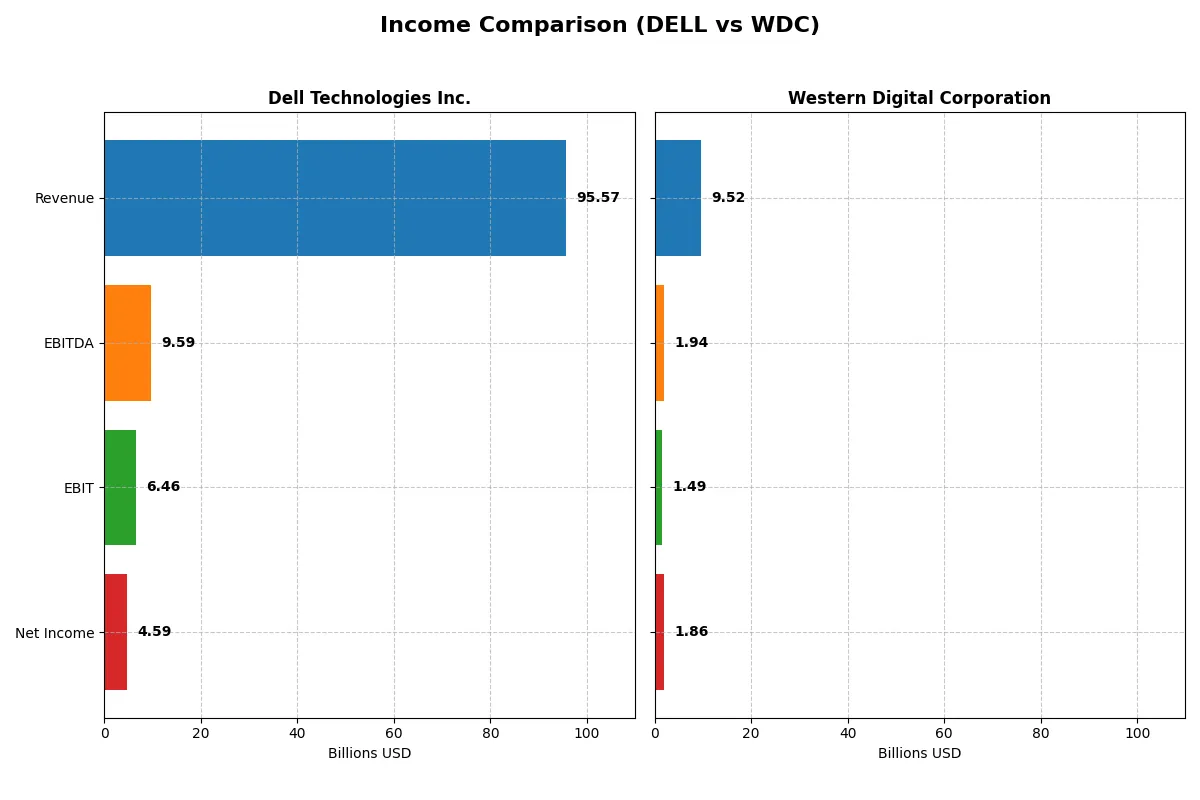
This data dissects the core profitability and scalability of both corporate engines to reveal who dominates the bottom line:
| Metric | Dell Technologies Inc. (DELL) | Western Digital Corporation (WDC) |
|---|---|---|
| Revenue | 95.6B | 9.52B |
| Cost of Revenue | 74.3B | 5.83B |
| Operating Expenses | 15.0B | 1.36B |
| Gross Profit | 21.3B | 3.69B |
| EBITDA | 9.59B | 1.94B |
| EBIT | 6.46B | 1.49B |
| Interest Expense | 1.41B | 357M |
| Net Income | 4.59B | 1.84B |
| EPS | 6.51 | 5.31 |
| Fiscal Year | 2025 | 2025 |
Income Statement Analysis: The Bottom-Line Duel
This income statement comparison reveals each company’s true efficiency in converting revenue into profit and managing costs over time.
Dell Technologies Inc. Analysis
Dell’s revenue grew steadily from 87B in 2021 to 96B in 2025, with net income rising from 3.2B to 4.6B. Gross margin holds firm at 22%, signaling solid cost control. The 2025 year showed strong momentum with net margin improving 25% year-over-year, reflecting enhanced operational efficiency and disciplined capital allocation.
Western Digital Corporation Analysis
Western Digital’s revenue rebounded sharply to 9.5B in 2025 from a low of 6.3B in 2024, with net income surging to 1.8B from a loss. Its gross margin remains impressive near 39%, and net margin expanded dramatically to nearly 20%. The latest fiscal year exhibits a robust turnaround driven by exceptional margin expansion and operational leverage.
Margin Resilience vs. Turnaround Momentum
Dell delivers consistent revenue growth and stable margins, reflecting mature, efficient operations. Western Digital, while smaller, posted a striking profit rebound with superior margin expansion. Dell’s profile favors steady, reliable profit growth, whereas Western Digital appeals to investors seeking high momentum in a recovering business.
Financial Ratios Comparison
These vital ratios act as a diagnostic tool to expose the underlying fiscal health, valuation premiums, and capital efficiency of the companies compared below:
| Ratios | Dell Technologies Inc. (DELL) | Western Digital Corporation (WDC) |
|---|---|---|
| ROE | -3.10% | 35.04% |
| ROIC | 14.71% | 21.53% |
| P/E | 15.7 | 11.8 |
| P/B | -48.66 | 4.14 |
| Current Ratio | 0.78 | 1.08 |
| Quick Ratio | 0.63 | 0.84 |
| D/E (Debt-to-Equity) | -16.58 | 0.96 |
| Debt-to-Assets | 30.81% | 36.29% |
| Interest Coverage | 4.41 | 6.54 |
| Asset Turnover | 1.20 | 0.68 |
| Fixed Asset Turnover | 15.08 | 4.06 |
| Payout ratio | 27.77% | 2.36% |
| Dividend yield | 1.77% | 0.20% |
| Fiscal Year | 2025 | 2025 |
Efficiency & Valuation Duel: The Vital Signs
Financial ratios act as a company’s DNA, exposing hidden risks and operational strengths critical to investor insight.
Dell Technologies Inc.
Dell displays weak profitability with a negative ROE of -310%, signaling shareholder value erosion. Its net margin at 4.8% is unfavorable, yet a 14.7% ROIC surpasses its 8.1% WACC, indicating efficient capital use. The P/E ratio of 15.7 appears fairly valued. Dell offers a 1.77% dividend yield, balancing modest returns with reinvestment in R&D for growth.
Western Digital Corporation
Western Digital excels with strong profitability: a 35% ROE and a 19.5% net margin highlight operational strength. It trades at an attractive P/E of 11.8, suggesting undervaluation versus peers. The 21.5% ROIC significantly outpaces its 12.2% WACC, reflecting robust capital allocation. Dividend yield is low at 0.2%, implying focus on reinvestment over shareholder payouts.
Premium Valuation vs. Operational Safety
Western Digital offers superior profitability and a lower P/E, presenting a more attractive risk-reward profile. Dell’s capital efficiency is solid but overshadowed by poor equity returns and valuation neutrality. Investors favoring growth and strong returns may prefer Western Digital, while those seeking modest dividends with R&D focus might lean toward Dell.
Which one offers the Superior Shareholder Reward?
I compare Dell Technologies Inc. (DELL) and Western Digital Corporation (WDC) on shareholder distributions in 2026. Dell pays a 1.77% dividend yield with a 28% payout ratio, well-covered by free cash flow (FCF/OCF ratio ~0.41). Dell’s buybacks are modest but consistent, supporting total return. Western Digital yields only 0.20%, with a minimal 2.4% payout ratio, reflecting a cautious dividend policy. WDC’s buyback intensity is stronger, driven by higher FCF conversion (~76% FCF/OCF ratio). Dell’s balanced dividend and buyback mix offers more sustainable, reliable income with moderate growth reinvestment. WDC’s lower yield and higher buyback reliance increase risk amid volatile margins. I favor Dell for superior total shareholder reward in 2026 due to consistent dividends, prudent buybacks, and sustainable cash flow coverage.
Comparative Score Analysis: The Strategic Profile
The radar chart reveals the fundamental DNA and trade-offs of Dell Technologies Inc. and Western Digital Corporation, highlighting their financial strengths and vulnerabilities:
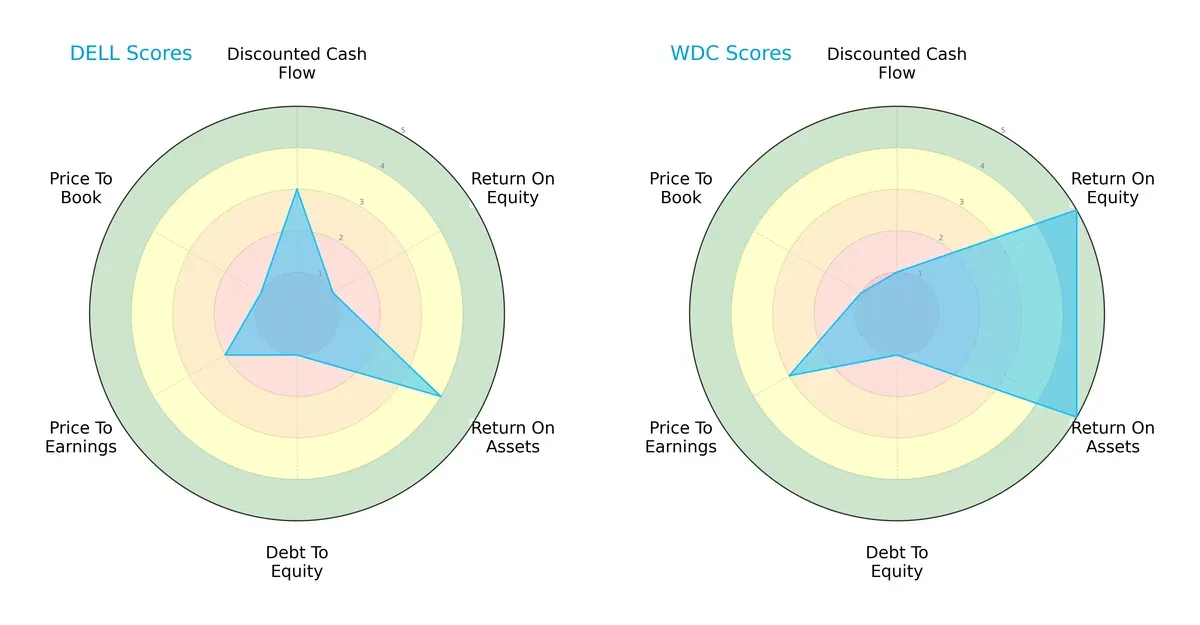
Dell shows a stronger discounted cash flow score (3 vs. 1), indicating better valuation based on future cash flows. Western Digital excels in return on equity (5 vs. 1) and return on assets (5 vs. 4), signaling superior profitability and asset efficiency. Both face challenges with debt-to-equity (1) and price-to-book (1), reflecting elevated leverage and potentially rich market valuations. Western Digital presents a more balanced profile, relying on operational efficiency, while Dell leans on cash flow valuation.
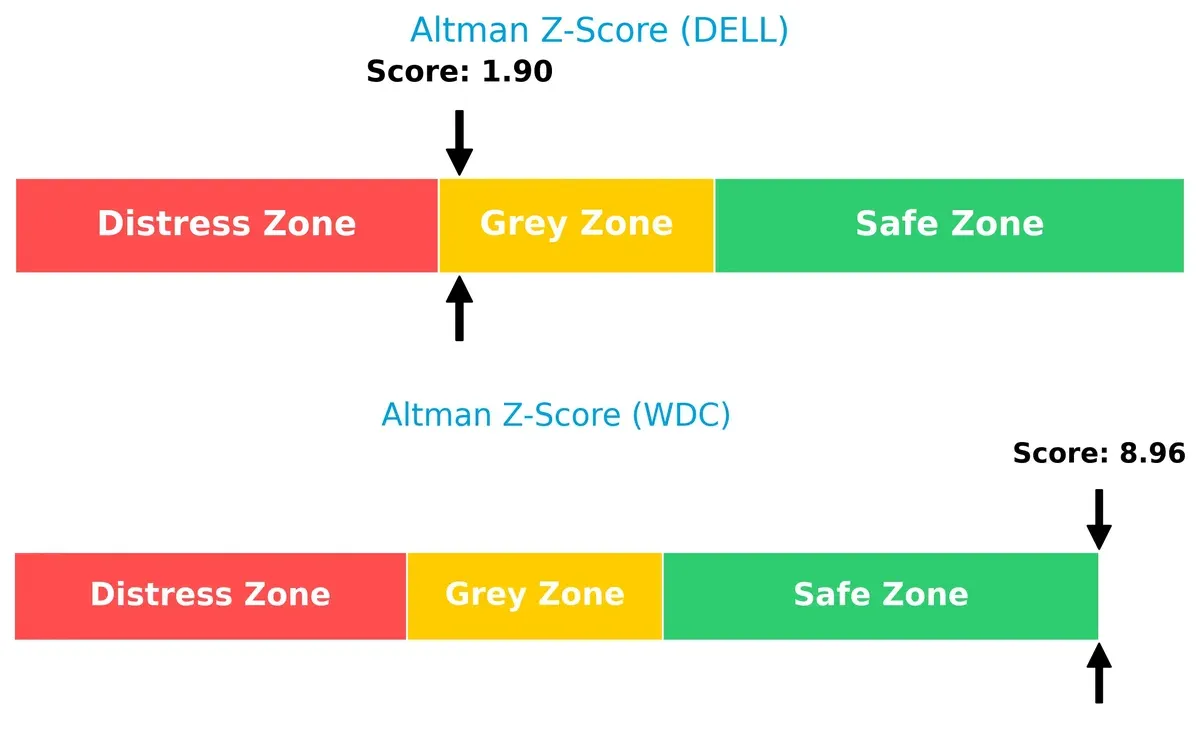
Bankruptcy Risk: Solvency Showdown
Western Digital’s Altman Z-Score of 8.96 places it safely above distress thresholds, indicating robust long-term solvency. Dell’s 1.90 score lies in the grey zone, signaling moderate bankruptcy risk in this cycle:
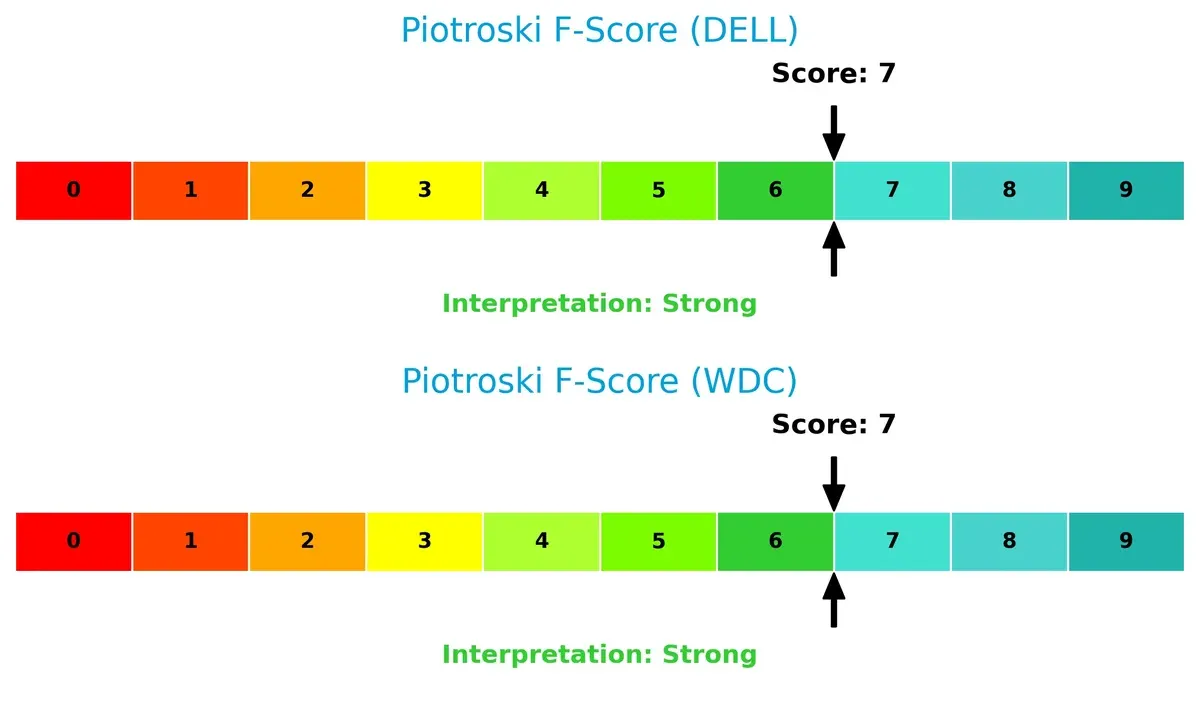
Financial Health: Quality of Operations
Both firms share a strong Piotroski F-Score of 7, reflecting solid internal financial health. Neither company shows critical red flags, but continuous monitoring remains prudent:
How are the two companies positioned?
This section dissects Dell and WDC’s operational DNA by comparing revenue distribution and internal strengths and weaknesses. The goal is to confront their economic moats, identifying which model delivers the most resilient competitive advantage today.
Revenue Segmentation: The Strategic Mix
The following comparison dissects how Dell Technologies and Western Digital diversify their income streams and where their primary sector bets lie:
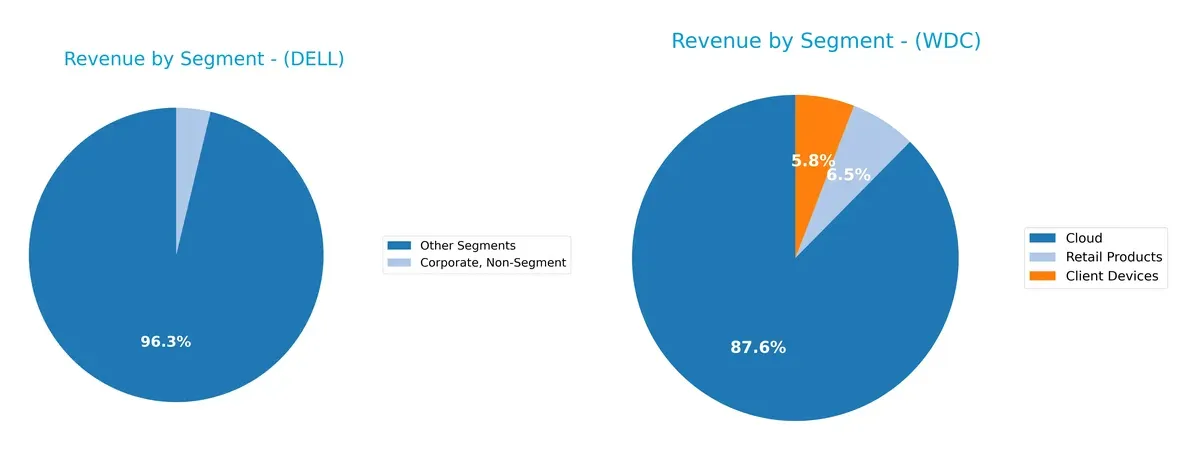
Dell Technologies anchors its revenue in Client Solutions, generating $49B in 2024, complemented by $34B from Infrastructure Solutions. This mix shows moderate diversification with a strong enterprise focus. In contrast, Western Digital relies heavily on Client Devices at $4.6B and Cloud at $5.4B in 2024 but shows a narrower segment spread. Dell’s broader ecosystem reduces concentration risk, while Western Digital’s focus implies higher exposure to device demand cycles.
Strengths and Weaknesses Comparison
This table compares the strengths and weaknesses of Dell Technologies Inc. and Western Digital Corporation:
Dell Strengths
- Diversified product segments including Client Solutions and Infrastructure
- Favorable ROIC at 14.71% exceeding WACC
- Strong asset and fixed asset turnover ratios
- Nearly equal US and Non-US revenue indicating global presence
Western Digital Strengths
- Higher net margin at 19.55% and ROE at 35.04% indicate strong profitability
- Favorable ROIC at 21.53%
- Favorable fixed asset turnover
- Diverse geographic revenue across Asia, EMEA, and Americas
Dell Weaknesses
- Negative ROE at -309.85% signals poor equity returns
- Low current and quick ratios below 1 signal liquidity concerns
- Neutral debt-to-assets but negative debt/equity ratio is anomalous
- Net margin is unfavorable at 4.81%
Western Digital Weaknesses
- Higher WACC at 12.18% than ROIC suggests cost of capital pressure
- Unfavorable PB ratio at 4.14
- Dividend yield very low at 0.2%
- Asset turnover below 1 indicates less efficient use of assets
Dell shows operational efficiency with strong turnover ratios and balanced geographic revenue but faces significant profitability and liquidity challenges. Western Digital exhibits superior profitability and global diversification but contends with higher capital costs and weaker asset efficiency. Both companies maintain a slightly favorable overall financial profile, highlighting differing strategic priorities.
The Moat Duel: Analyzing Competitive Defensibility
A structural moat is the only barrier shielding long-term profits from competitive erosion. Let’s dissect how these two tech giants defend their turf:
Dell Technologies Inc.: Integrated IT Solutions Moat
Dell’s moat stems from its diversified IT infrastructure and client solutions, creating strong switching costs. I see this reflected in steady ROIC growth of 217% and margin stability. Its expansion into hybrid-cloud services in 2026 could deepen this advantage.
Western Digital Corporation: Data Storage Cost Leadership
Western Digital leverages cost advantage through advanced storage tech and scale, outperforming Dell with a 329% ROIC growth trend. Its aggressive revenue surge signals strong market disruption potential, especially in enterprise SSDs and data centers.
Integrated Solutions vs. Cost Leadership: The Moat Face-Off
Both companies show durable moats with growing ROIC above WACC. However, Western Digital’s wider moat and faster profitability growth position it better to defend and expand market share amid intensifying competition.
Which stock offers better returns?
Over the past year, Dell Technologies Inc. showed a mild decline with decelerating bearish momentum, while Western Digital Corporation exhibited a strong accelerating bullish trend with substantial price gains.
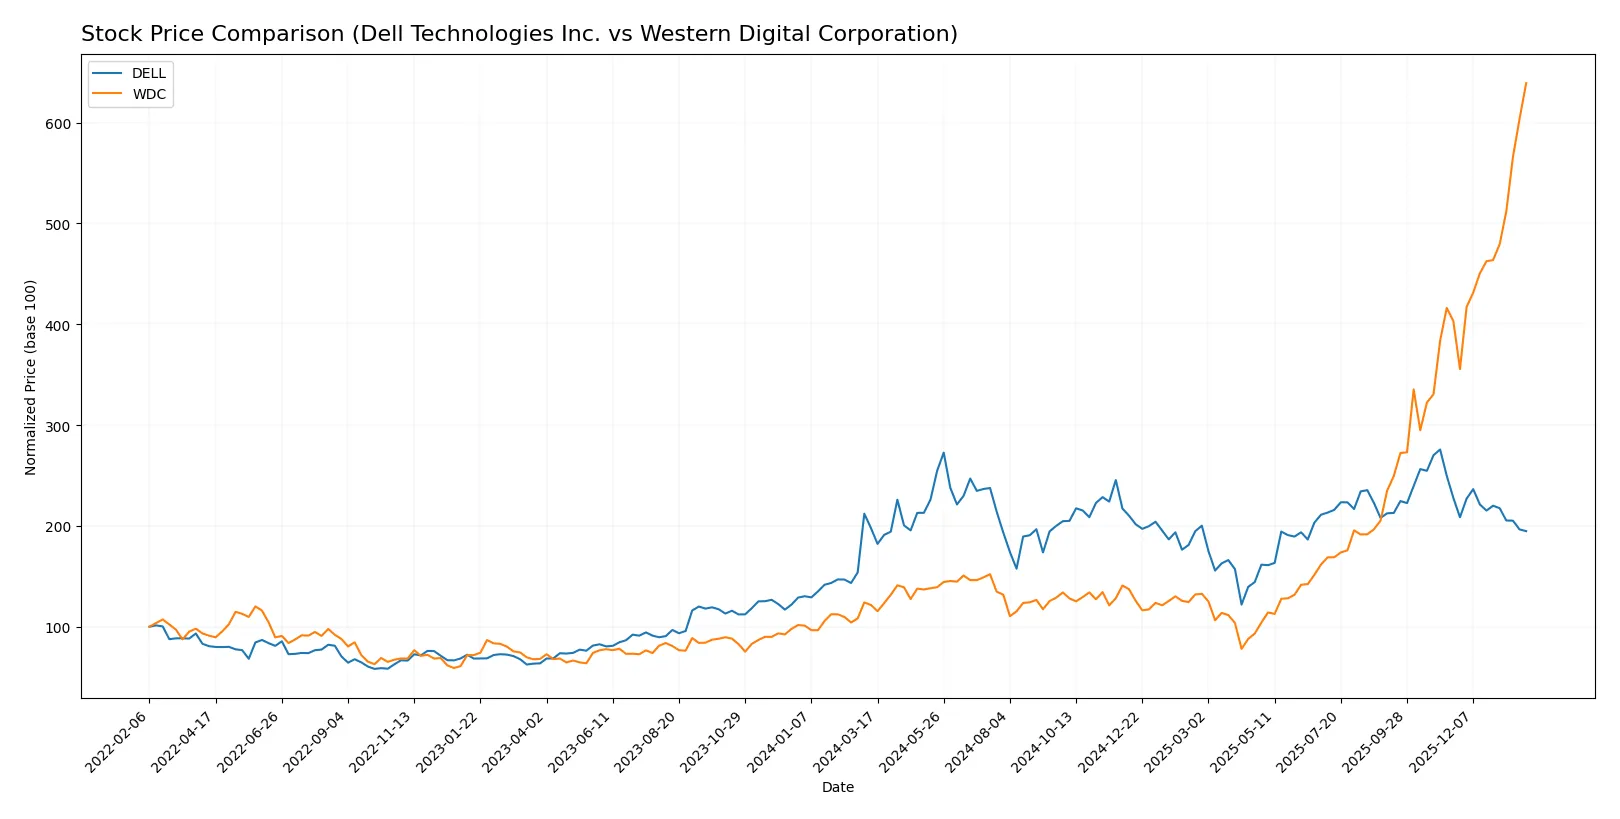
Trend Comparison
Dell Technologies Inc.’s stock declined by 1.56% over 12 months, indicating a neutral to slightly bearish trend with deceleration. The price ranged from 71.63 to 162.01, showing moderate volatility.
Western Digital Corporation surged 425.69% over the same period, reflecting a robust bullish trend with accelerating momentum. Its price fluctuated widely from 30.54 to 250.23, highlighting significant volatility.
Comparing both, Western Digital outperformed Dell substantially, delivering the highest market returns and stronger positive price momentum over the past year.
Target Prices
Analysts show a bullish consensus for Dell Technologies Inc. and Western Digital Corporation with substantial upside potential.
| Company | Target Low | Target High | Consensus |
|---|---|---|---|
| Dell Technologies Inc. | 111 | 200 | 163.67 |
| Western Digital Corporation | 180 | 325 | 268.2 |
Both Dell and Western Digital trade well below their consensus targets, suggesting significant analyst optimism despite recent price weakness. This gap highlights potential upside if market conditions stabilize.

Don’t Let Luck Decide Your Entry Point
Optimize your entry points with our advanced ProRealTime indicators. You’ll get efficient buy signals with precise price targets for maximum performance. Start outperforming now!
How do institutions grade them?
Dell Technologies Inc. Grades
The following table summarizes recent grade actions from major financial institutions for Dell Technologies Inc.:
| Grading Company | Action | New Grade | Date |
|---|---|---|---|
| Citigroup | Maintain | Buy | 2026-01-20 |
| Morgan Stanley | Maintain | Underweight | 2026-01-20 |
| Barclays | Upgrade | Overweight | 2026-01-15 |
| Goldman Sachs | Maintain | Buy | 2026-01-14 |
| Morgan Stanley | Maintain | Underweight | 2025-11-26 |
| B of A Securities | Maintain | Buy | 2025-11-26 |
| Mizuho | Maintain | Outperform | 2025-11-26 |
| Barclays | Maintain | Equal Weight | 2025-11-26 |
| UBS | Maintain | Buy | 2025-11-26 |
| B of A Securities | Maintain | Buy | 2025-11-20 |
Western Digital Corporation Grades
Below is a summary of the latest institutional grades for Western Digital Corporation:
| Grading Company | Action | New Grade | Date |
|---|---|---|---|
| TD Cowen | Maintain | Buy | 2026-01-30 |
| Goldman Sachs | Maintain | Neutral | 2026-01-30 |
| Cantor Fitzgerald | Maintain | Overweight | 2026-01-30 |
| Morgan Stanley | Maintain | Overweight | 2026-01-30 |
| Wedbush | Maintain | Outperform | 2026-01-30 |
| Wells Fargo | Maintain | Overweight | 2026-01-30 |
| Mizuho | Maintain | Outperform | 2026-01-27 |
| Morgan Stanley | Maintain | Overweight | 2026-01-22 |
| Citigroup | Maintain | Buy | 2026-01-20 |
| B of A Securities | Maintain | Buy | 2026-01-20 |
Which company has the best grades?
Western Digital consistently receives higher grades, including multiple Overweight and Outperform ratings. Dell shows a mix of Buy and Underweight grades. This disparity may influence investor sentiment and portfolio positioning.
Risks specific to each company
The following categories identify the critical pressure points and systemic threats facing both Dell Technologies Inc. and Western Digital Corporation in the 2026 market environment:
1. Market & Competition
Dell Technologies Inc.
- Faces fierce competition in IT infrastructure and cloud solutions, with pressure to innovate rapidly.
Western Digital Corporation
- Competes aggressively in data storage devices; must keep pace with SSD and HDD technological shifts.
2. Capital Structure & Debt
Dell Technologies Inc.
- Maintains moderate debt-to-assets ratio (30.8%) with favorable debt-to-equity metrics, signaling manageable leverage.
Western Digital Corporation
- Holds slightly higher debt-to-assets (36.3%) and neutral debt-to-equity score, posing moderate financial risk.
3. Stock Volatility
Dell Technologies Inc.
- Exhibits beta of 1.11, suggesting moderate volatility relative to the market.
Western Digital Corporation
- Shows elevated beta of 1.85, indicating higher share price swings and risk exposure.
4. Regulatory & Legal
Dell Technologies Inc.
- Operates globally with exposure to data privacy laws and IT compliance mandates.
Western Digital Corporation
- Faces stringent regulatory scrutiny in multiple jurisdictions for storage device standards and IP protections.
5. Supply Chain & Operations
Dell Technologies Inc.
- Relies on complex supply chains for hardware and software components, vulnerable to disruption risks.
Western Digital Corporation
- Supply chain vulnerable to raw material costs and logistics bottlenecks affecting manufacturing timelines.
6. ESG & Climate Transition
Dell Technologies Inc.
- Committed to sustainability initiatives but must accelerate climate risk mitigation to meet sector standards.
Western Digital Corporation
- ESG compliance improving, yet faces challenges in reducing carbon footprint in manufacturing processes.
7. Geopolitical Exposure
Dell Technologies Inc.
- Global footprint exposes it to trade tensions and tariff risks, especially between US and Asia.
Western Digital Corporation
- Similarly exposed to geopolitical tensions impacting supply routes and international sales.
Which company shows a better risk-adjusted profile?
Western Digital faces higher stock volatility and a riskier capital structure but delivers stronger profitability and financial stability scores. Dell has manageable leverage and moderate volatility but struggles with weak returns on equity and liquidity ratios. Western Digital’s Altman Z-score in the safe zone contrasts with Dell’s grey zone, reflecting superior bankruptcy risk management. However, Dell’s better debt-to-equity position tempers concerns. Overall, Western Digital’s robust operational profitability and financial scores provide a better risk-adjusted profile despite its higher market volatility. The steep recent price drop (-10.1%) in Western Digital signals market apprehension, underscoring the need for caution.
Final Verdict: Which stock to choose?
Dell Technologies Inc. excels as a cash-generating machine with a durable competitive advantage, evidenced by a steadily growing ROIC well above its cost of capital. Its point of vigilance lies in liquidity constraints, which may pressure short-term operations. Dell suits portfolios targeting aggressive growth with tolerance for cyclical risk.
Western Digital Corporation’s moat is anchored in robust operating margins and recurring revenue strength, delivering superior profitability and cash flow stability. Its financial safety profile is more balanced than Dell’s, supported by a healthier liquidity ratio and consistent earnings growth. WDC fits well within growth-at-a-reasonable-price (GARP) strategies seeking stable returns with moderate risk.
If you prioritize aggressive capital efficiency and high growth potential, Dell outshines due to its value-creating capital deployment despite near-term liquidity challenges. However, if you seek better stability and margin resilience in your portfolio, Western Digital offers superior financial safety and accelerating growth momentum. Each presents a compelling scenario tailored to distinct investor risk appetites.
Disclaimer: Investment carries a risk of loss of initial capital. The past performance is not a reliable indicator of future results. Be sure to understand risks before making an investment decision.
Go Further
I encourage you to read the complete analyses of Dell Technologies Inc. and Western Digital Corporation to enhance your investment decisions: