In the fast-evolving world of computer hardware, Dell Technologies Inc. and Super Micro Computer, Inc. stand out as key players driving innovation and infrastructure solutions. Both companies serve enterprise data centers and cloud markets, yet differ in scale and strategic focus. This comparison highlights their market positioning, product offerings, and growth potential. Join me as we explore which company presents the most compelling opportunity for investors in 2026.

Table of contents
Companies Overview
I will begin the comparison between Dell and Super Micro Computer by providing an overview of these two companies and their main differences.
Dell Overview
Dell Technologies Inc. designs, develops, manufactures, markets, sells, and supports IT solutions, products, and services globally. Operating through Infrastructure Solutions Group, Client Solutions Group, and VMware segments, Dell offers storage, servers, networking products, desktops, notebooks, and cloud software. Founded in 1984 and headquartered in Round Rock, Texas, Dell has a significant market presence with 108K employees and a market cap of $80B.
Super Micro Computer Overview
Super Micro Computer, Inc. develops and manufactures high-performance server and storage solutions built on modular open architecture. Headquartered in San Jose, California, the company provides a wide range of servers, storage systems, networking devices, and software to enterprise data centers, cloud computing, AI, and 5G markets. Founded in 1993, SMCI employs 5.7K people and has a market cap of $17B.
Key similarities and differences
Both Dell and Super Micro operate in the computer hardware industry, focusing on servers, storage, and related IT infrastructure. Dell’s broader business model includes cloud software and VMware services, while SMCI emphasizes modular, application-optimized server solutions and system integration. Dell’s scale is much larger, reflected in its workforce and market cap, whereas SMCI maintains a more specialized product portfolio with a higher beta indicating greater stock volatility.
Income Statement Comparison
This table compares the most recent fiscal year income statement metrics for Dell Technologies Inc. and Super Micro Computer, Inc., providing a snapshot of their financial performance.

| Metric | Dell Technologies Inc. | Super Micro Computer, Inc. |
|---|---|---|
| Market Cap | 80.2B | 17.0B |
| Revenue | 95.6B | 21.97B |
| EBITDA | 9.59B | 1.33B |
| EBIT | 6.46B | 1.27B |
| Net Income | 4.59B | 1.05B |
| EPS | 6.51 | 1.77 |
| Fiscal Year | 2025 | 2025 |
Income Statement Interpretations
Dell Technologies Inc.
Dell exhibited steady growth from 2021 to 2025, with revenue rising from $86.7B to $95.6B and net income increasing from $3.2B to $4.6B. Gross margin remained stable around 22%, while EBIT and net margins were neutral but consistent. In 2025, revenue growth of 8.1% and a 25.4% net margin increase highlighted margin improvement and solid profitability.
Super Micro Computer, Inc.
Super Micro’s revenue surged from $3.6B in 2021 to $21.97B in 2025, with net income growing from $112M to $1.05B. Gross margin hovered near 11%, and EBIT margin stayed neutral at 5.8%. Despite a strong 46.6% revenue growth in 2025, net margin declined by 37.9%, signaling pressure on profitability despite operational expansion.
Which one has the stronger fundamentals?
Dell’s income statement shows more balanced and consistent margin stability with favorable net margin growth and strong EPS improvement, reflecting robust profitability. Super Micro demonstrates impressive top-line growth and expanding net income over the period but faces recent profitability challenges with declining net margin. Dell’s fundamentals appear more resilient and stable in comparison.
Financial Ratios Comparison
The table below presents a side-by-side comparison of key financial ratios for Dell Technologies Inc. and Super Micro Computer, Inc. based on their most recent fiscal year data.
| Ratios | Dell Technologies Inc. (2025) | Super Micro Computer, Inc. (2025) |
|---|---|---|
| ROE | -3.10% | 16.64% |
| ROIC | 14.71% | 9.26% |
| P/E | 15.7 | 27.7 |
| P/B | -48.7 | 4.62 |
| Current Ratio | 0.78 | 5.25 |
| Quick Ratio | 0.63 | 3.25 |
| D/E (Debt-to-Equity) | -16.58 | 0.76 |
| Debt-to-Assets | 30.8% | 34.1% |
| Interest Coverage | 4.41 | 21.03 |
| Asset Turnover | 1.20 | 1.57 |
| Fixed Asset Turnover | 15.1 | 27.5 |
| Payout Ratio | 27.8% | 0% |
| Dividend Yield | 1.77% | 0% |
Interpretation of the Ratios
Dell Technologies Inc.
Dell shows a mixed ratio profile with favorable returns on invested capital (14.71%) and strong asset turnover, indicating efficient use of assets. However, its negative return on equity (-309.85%) and weak liquidity ratios (current ratio 0.78) raise concerns. The company pays dividends with a moderate yield of 1.77%, supported by free cash flow, but payout sustainability should be monitored given profitability challenges.
Super Micro Computer, Inc.
Super Micro exhibits a blend of strengths such as a favorable return on equity (16.64%), high interest coverage (21.34), and efficient asset turnover. Nevertheless, its valuation ratios like P/E (27.74) and P/B (4.62) are unfavorable, and the very high current ratio (5.25) could indicate excess liquidity. The company does not pay dividends, likely focusing on reinvestment and growth strategies.
Which one has the best ratios?
Dell’s slightly favorable overall rating reflects strong operational efficiency and dividend payments but is tempered by weak profitability and liquidity. Super Micro’s neutral stance is driven by solid profitability and coverage ratios but offset by high valuation multiples and no dividend payout. Both companies present a balance of favorable and unfavorable ratios without a clear superiority.
Strategic Positioning
This section compares the strategic positioning of Dell Technologies Inc. and Super Micro Computer, Inc. covering market position, key segments, and exposure to technological disruption:
Dell Technologies Inc.
- Large market cap of 80B, facing competitive pressure in IT hardware and services globally.
- Diversified segments: Client Solutions, Infrastructure Solutions, VMware cloud and security services.
- Exposure includes hybrid and multi-cloud IT, security, and modern applications via VMware segment.
Super Micro Computer, Inc.
- Smaller market cap of 17B, operating in competitive server and storage hardware markets.
- Focused on high-performance server and storage systems, subsystems, and server management software.
- Focused on modular architecture for servers, cloud computing, AI, 5G, and edge computing markets.
Dell Technologies Inc. vs Super Micro Computer, Inc. Positioning
Dell’s diversified approach spans client devices, infrastructure, and cloud services, enabling broad market reach. Super Micro concentrates on server and storage solutions with modular designs, focusing on niche high-performance and emerging tech sectors. Dell’s scale offers broad stability; Super Micro’s focus targets specialized growth areas.
Which has the best competitive advantage?
Dell demonstrates a very favorable moat with strong value creation and growing ROIC, indicating durable competitive advantage. Super Micro shows slightly unfavorable moat status, shedding value despite improving profitability. Dell holds the stronger competitive advantage based on MOAT evaluation.
Stock Comparison
The past year reveals contrasting price movements in Dell Technologies Inc. and Super Micro Computer, Inc., with Dell showing a significant overall gain despite recent declines, while Super Micro’s stock has experienced a pronounced downward trajectory.
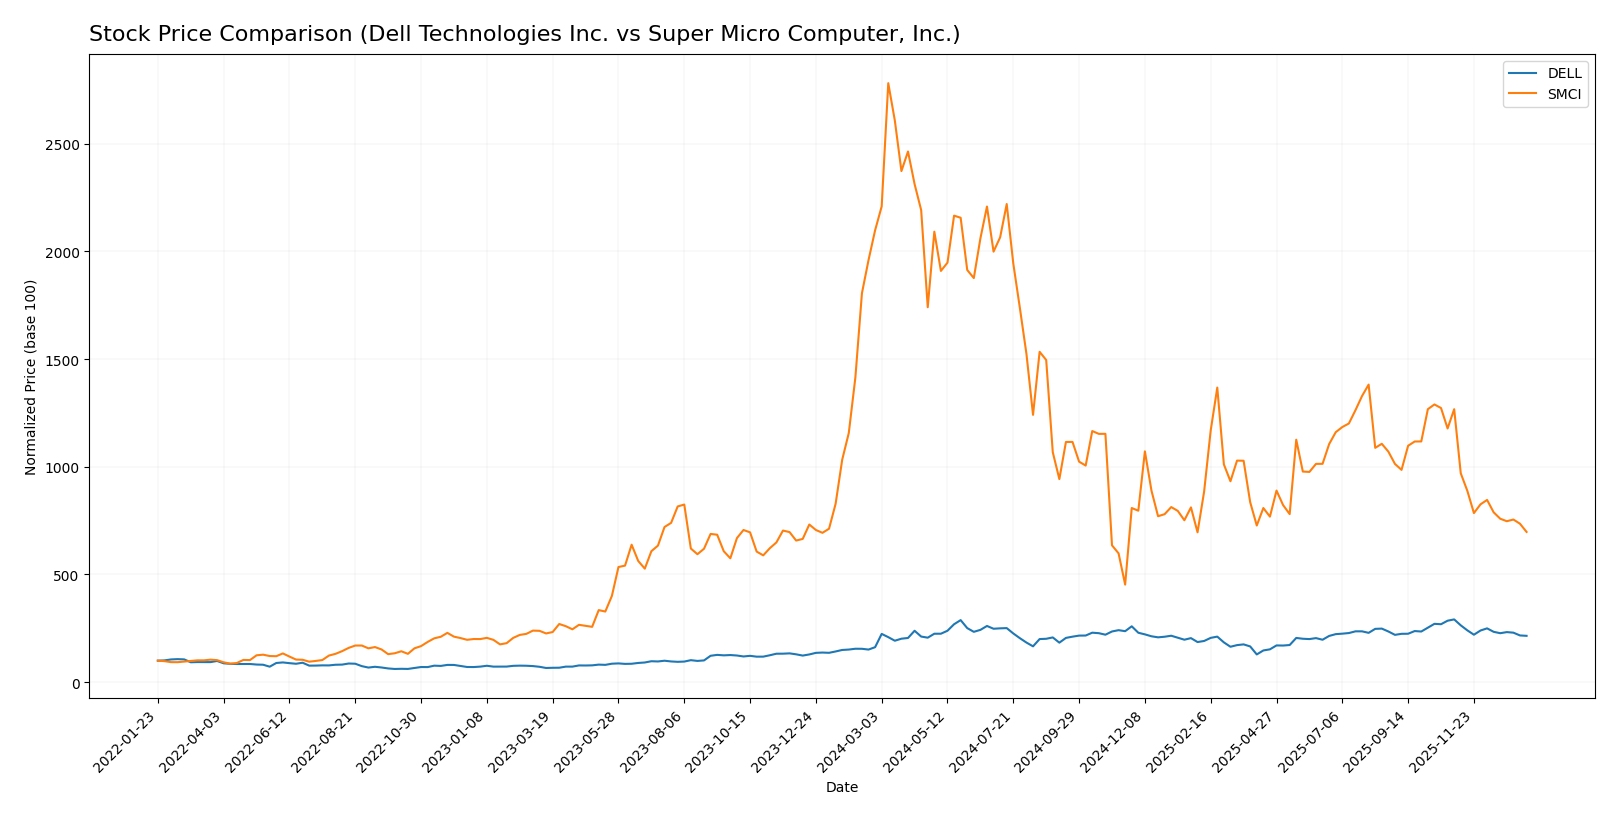
Trend Analysis
Dell Technologies Inc. posted a 32.44% price increase over the past 12 months, indicating a bullish trend with decelerating momentum. The stock reached a high of 162.01 and a low of 71.63, with volatility measured by a 16.95 standard deviation.
Super Micro Computer, Inc. experienced a 66.74% decline over the same period, marking a bearish trend with deceleration. Its price fluctuated between 18.58 and 114.0, showing higher volatility with a 21.77 standard deviation.
Comparing the two, Dell Technologies delivered the highest market performance over the past year, contrasting with Super Micro’s significant losses.
Target Prices
Analysts present a bullish consensus for both Dell Technologies Inc. and Super Micro Computer, Inc.
| Company | Target High | Target Low | Consensus |
|---|---|---|---|
| Dell Technologies Inc. | 200 | 113 | 163.83 |
| Super Micro Computer, Inc. | 64 | 26 | 49.71 |
The consensus target prices exceed current stock prices, indicating general analyst optimism for Dell and Super Micro’s future performance relative to their present valuations.
Analyst Opinions Comparison
This section compares analysts’ ratings and grades for Dell Technologies Inc. and Super Micro Computer, Inc.:
Rating Comparison
Dell Rating
- Rating: C+ with a very favorable status
- Discounted Cash Flow Score: 3 (Moderate)
- ROE Score: 1 (Very Unfavorable)
- ROA Score: 4 (Favorable)
- Debt To Equity Score: 1 (Very Unfavorable)
- Overall Score: 2 (Moderate)
SMCI Rating
- Rating: B- with a very favorable status
- Discounted Cash Flow Score: 1 (Very Unfavorable)
- ROE Score: 4 (Favorable)
- ROA Score: 4 (Favorable)
- Debt To Equity Score: 1 (Very Unfavorable)
- Overall Score: 2 (Moderate)
Which one is the best rated?
SMCI holds a higher letter rating (B-) than Dell (C+), reflecting more favorable assessments in ROE and ROA scores. However, both have identical overall and debt-to-equity scores, indicating similar moderate financial standings.
Scores Comparison
Here is a comparison of the key financial scores for Dell and SMCI:
DELL Scores
- Altman Z-Score: 1.93, in the grey zone indicating moderate bankruptcy risk.
- Piotroski Score: 7, classified as strong financial health.
SMCI Scores
- Altman Z-Score: 4.70, in the safe zone indicating low bankruptcy risk.
- Piotroski Score: 4, classified as average financial health.
Which company has the best scores?
SMCI has a significantly higher Altman Z-Score, placing it firmly in the safe zone, while Dell is in the grey zone. Conversely, Dell’s Piotroski Score is stronger than SMCI’s, suggesting better financial strength in that metric.
Grades Comparison
Here is the comparison of recent reliable grades for Dell Technologies Inc. and Super Micro Computer, Inc.:
Dell Technologies Inc. Grades
The following table summarizes recent grades from recognized financial institutions for Dell Technologies Inc.:
| Grading Company | Action | New Grade | Date |
|---|---|---|---|
| Mizuho | Maintain | Outperform | 2025-11-26 |
| B of A Securities | Maintain | Buy | 2025-11-26 |
| Morgan Stanley | Maintain | Underweight | 2025-11-26 |
| UBS | Maintain | Buy | 2025-11-26 |
| Barclays | Maintain | Equal Weight | 2025-11-26 |
| B of A Securities | Maintain | Buy | 2025-11-20 |
| JP Morgan | Maintain | Overweight | 2025-11-17 |
| Morgan Stanley | Downgrade | Underweight | 2025-11-17 |
| Raymond James | Maintain | Outperform | 2025-10-21 |
| Argus Research | Maintain | Buy | 2025-10-09 |
Dell shows a mixed but generally positive trend, with multiple “Buy” and “Outperform” ratings despite a few downgrades to “Underweight” and “Equal Weight.”
Super Micro Computer, Inc. Grades
The following table summarizes recent grades from recognized financial institutions for Super Micro Computer, Inc.:
| Grading Company | Action | New Grade | Date |
|---|---|---|---|
| Barclays | Maintain | Equal Weight | 2024-10-02 |
| Loop Capital | Maintain | Buy | 2024-09-23 |
| JP Morgan | Downgrade | Neutral | 2024-09-06 |
| Barclays | Downgrade | Equal Weight | 2024-09-04 |
| Wells Fargo | Maintain | Equal Weight | 2024-08-28 |
| CFRA | Downgrade | Hold | 2024-08-28 |
| Barclays | Maintain | Overweight | 2024-08-28 |
| Goldman Sachs | Maintain | Neutral | 2024-08-08 |
| Rosenblatt | Maintain | Buy | 2024-08-07 |
| B of A Securities | Downgrade | Neutral | 2024-08-07 |
Super Micro displays a more cautious pattern with several downgrades from “Buy” or “Overweight” to “Neutral,” “Hold,” or “Equal Weight,” indicating a less favorable consensus.
Which company has the best grades?
Dell Technologies Inc. has received stronger and more consistent grades, including multiple “Buy” and “Outperform” ratings, whereas Super Micro Computer, Inc.’s grades tend toward “Hold” or “Neutral.” This suggests Dell’s outlook is viewed more positively by analysts, potentially influencing investor confidence and portfolio decisions accordingly.
Strengths and Weaknesses
Below is a comparison of key strengths and weaknesses for Dell Technologies Inc. and Super Micro Computer, Inc. based on the most recent financial and operational data.
| Criterion | Dell Technologies Inc. | Super Micro Computer, Inc. |
|---|---|---|
| Diversification | Highly diversified with multiple segments including Client Solutions and Infrastructure Solutions generating over 90B in revenues (2025). | More focused primarily on Server and Storage Systems with 21.3B revenue in 2025, less diversified. |
| Profitability | Creating value with ROIC at 14.7% (favorable), but net margin is low at 4.81%. | Slightly unfavorable overall value creation (negative ROIC vs WACC), but improving profitability with ROIC at 9.3%. |
| Innovation | Strong innovation capacity demonstrated by durable competitive advantage and growing ROIC. | Growing ROIC suggests improving innovation impact but still shedding value overall. |
| Global presence | Extensive global presence with a broad product range and infrastructure solutions. | More niche presence focused on server/storage markets, smaller scale globally. |
| Market Share | Large market share in client and infrastructure solutions sectors. | Smaller market share, rapidly growing server/storage revenue but still niche. |
Key takeaways: Dell leads in diversification and sustainable profitability with a very favorable competitive moat, while Super Micro shows promising growth and innovation but remains less diversified and slightly value-destructive. Investors should weigh Dell’s stability against SMCI’s growth potential and higher risk.
Risk Analysis
The table below summarizes key risks for Dell Technologies Inc. and Super Micro Computer, Inc. based on the most recent financial and market data from 2025.
| Metric | Dell Technologies Inc. | Super Micro Computer, Inc. |
|---|---|---|
| Market Risk | Beta 1.11, moderate volatility, NYSE-listed | Beta 1.53, higher volatility, NASDAQ-listed |
| Debt level | Debt to Assets 30.8%, favorable debt/equity ratio | Debt to Assets 34.1%, moderate leverage |
| Regulatory Risk | Moderate; operates globally with exposure to IT regulations | Moderate; US and international markets exposure |
| Operational Risk | Large scale, complex supply chain, 108K employees | Smaller scale, niche server solutions, 5.7K employees |
| Environmental Risk | Increasing focus on sustainability; moderate exposure | Moderate exposure; emphasis on energy-efficient products |
| Geopolitical Risk | Global supply chain sensitive to trade tensions | Exposure to US-China trade, global markets |
Dell shows a moderate market risk with steady but cautious financial metrics, while Super Micro faces higher volatility and leverage risk. Dell’s operational complexity poses execution risks, whereas Super Micro’s smaller scale may limit resilience. Geopolitical and regulatory factors remain significant for both, especially with global supply chain dependencies. Investors should weigh Dell’s slightly favorable financial health against Super Micro’s higher growth risk profile.
Which Stock to Choose?
Dell Technologies Inc. shows favorable income growth with a 10.27% revenue increase over 2021-2025 and a very favorable global income statement evaluation. Its financial ratios are slightly favorable, despite unfavorable ROE and liquidity ratios, supported by a very favorable moat rating indicating durable competitive advantage.
Super Micro Computer, Inc. exhibits strong revenue growth at 517.64% over the period but mixed income quality and a neutral global income statement evaluation. Its financial ratios are neutral overall, with favorable ROE and liquidity ratios, but a slightly unfavorable moat rating reflecting value destruction despite improving profitability.
Investors focused on stability and durable competitive advantage might find Dell’s profile more appealing due to its very favorable moat and income statement, while those seeking high growth potential could consider Super Micro’s substantial revenue gains, acknowledging its mixed financial ratio performance and moat status.
Disclaimer: Investment carries a risk of loss of initial capital. The past performance is not a reliable indicator of future results. Be sure to understand risks before making an investment decision.
Go Further
I encourage you to read the complete analyses of Dell Technologies Inc. and Super Micro Computer, Inc. to enhance your investment decisions: