Home > Comparison > Technology > DELL vs STX
The strategic rivalry between Dell Technologies Inc. and Seagate Technology Holdings plc shapes the evolution of the computer hardware sector. Dell operates as a diversified IT solutions provider, blending infrastructure, client devices, and cloud services. Seagate focuses on high-capacity data storage products, emphasizing mass capacity drives and platforms. This analysis contrasts growth models and capital intensity to identify which company offers superior risk-adjusted returns for a diversified portfolio in 2026.
Table of contents
Companies Overview
Dell Technologies and Seagate Technology both command significant roles in the global computer hardware sector.
Dell Technologies Inc.: Comprehensive IT Infrastructure Leader
Dell Technologies dominates as a provider of integrated IT solutions worldwide. Its revenue stems from three segments: Infrastructure Solutions Group delivering storage and servers, Client Solutions Group offering desktops and notebooks, and VMware’s cloud and security services. In 2026, Dell strategically focuses on modernizing IT infrastructures and expanding hybrid cloud capabilities to support complex multi-cloud environments.
Seagate Technology Holdings plc: Data Storage Specialist
Seagate Technology stands as a leader in mass capacity data storage solutions. It generates revenue through enterprise HDDs, SSDs, external storage devices, and the Lyve edge-to-cloud platform. In 2026, Seagate emphasizes scaling its mass capacity storage and expanding cloud-integrated platforms to meet rising data demands from OEMs and global distributors.
Strategic Collision: Similarities & Divergences
Both companies operate in computer hardware but adopt different philosophies: Dell pursues a diversified IT ecosystem involving hardware and cloud services, while Seagate sharpens its focus on specialized storage solutions. Their primary battleground is data management infrastructure, where Dell’s broad portfolio meets Seagate’s deep storage expertise. This divergence shapes distinct investment profiles—Dell offers broad tech exposure; Seagate targets storage-centric growth.
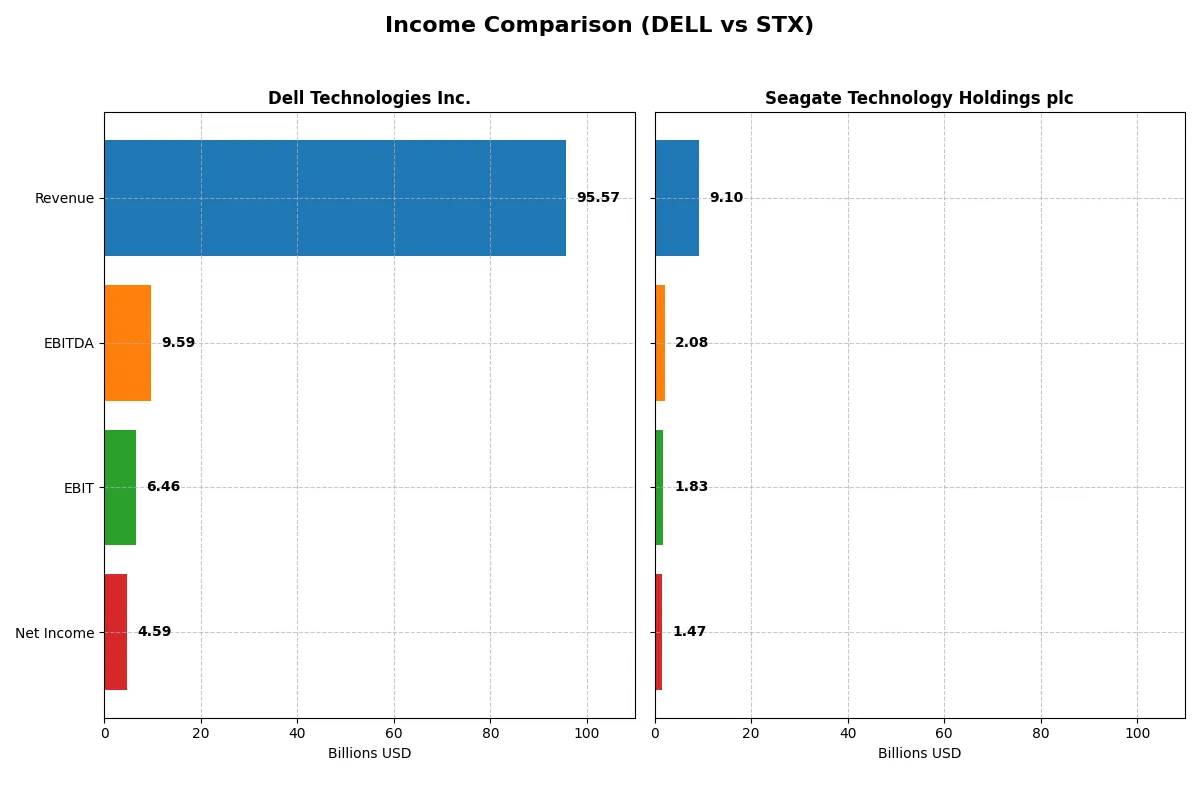
Income Statement Comparison
The following data dissects the core profitability and scalability of both corporate engines to reveal who dominates the bottom line:
| Metric | Dell Technologies Inc. (DELL) | Seagate Technology Holdings plc (STX) |
|---|---|---|
| Revenue | 95.6B | 9.1B |
| Cost of Revenue | 74.3B | 5.9B |
| Operating Expenses | 15.0B | 1.3B |
| Gross Profit | 21.3B | 3.2B |
| EBITDA | 9.6B | 2.1B |
| EBIT | 6.5B | 1.8B |
| Interest Expense | 1.4B | 321M |
| Net Income | 4.6B | 1.5B |
| EPS | 6.51 | 6.93 |
| Fiscal Year | 2025 | 2025 |
Income Statement Analysis: The Bottom-Line Duel
The income statement comparison reveals which company runs a more efficient and profitable business engine in the current market environment.
Dell Technologies Inc. Analysis
Dell’s revenue climbed steadily from $86.7B in 2021 to $95.6B in 2025, marking an 8% growth in the last year. Gross margin remains stable near 22%, while net margin improved to 4.8%, signaling healthy profitability. The 2025 net income of $4.6B shows strong momentum, supported by disciplined cost management and favorable interest expense ratios.
Seagate Technology Holdings plc Analysis
Seagate’s revenue surged 39% to $9.1B in 2025 after earlier volatility, but remains below its 2022 peak. The company boasts a robust 35% gross margin and an impressive 16% net margin, reflecting operational efficiency. Net income soared to $1.47B in 2025, driven by exceptional EBIT growth and margin expansion, indicating strong recovery and profitability acceleration.
Margin Power vs. Revenue Scale
Seagate outperforms Dell on margin strength, with a 16% net margin nearly triple Dell’s 4.8%. However, Dell’s $95.6B revenue dwarfs Seagate’s $9.1B, underscoring its scale advantage. Dell’s consistent top-line growth and solid profit gains contrast with Seagate’s more volatile but margin-rich profile. Investors seeking scale with steady growth may prefer Dell; those favoring margin efficiency might lean toward Seagate.
Financial Ratios Comparison
These vital ratios act as a diagnostic tool to expose the underlying fiscal health, valuation premiums, and capital efficiency of the companies compared below:
| Ratios | Dell Technologies Inc. (DELL) | Seagate Technology Holdings plc (STX) |
|---|---|---|
| ROE | -3.10% (2025) | -3.24% (2025) |
| ROIC | 14.7% (2025) | 33.8% (2025) |
| P/E | 15.7 (2025) | 20.4 (2025) |
| P/B | -48.7 (2025) | -66.2 (2025) |
| Current Ratio | 0.78 (2025) | 1.38 (2025) |
| Quick Ratio | 0.63 (2025) | 0.84 (2025) |
| D/E (Debt-to-Equity) | -16.6 (2025) | -11.9 (2025) |
| Debt-to-Assets | 30.8% (2025) | 66.97% (2025) |
| Interest Coverage | 4.41 (2025) | 5.89 (2025) |
| Asset Turnover | 1.20 (2025) | 1.13 (2025) |
| Fixed Asset Turnover | 15.08 (2025) | 5.49 (2025) |
| Payout ratio | 27.8% (2025) | 40.8% (2025) |
| Dividend yield | 1.77% (2025) | 2.00% (2025) |
| Fiscal Year | 2025 | 2025 |
Efficiency & Valuation Duel: The Vital Signs
Financial ratios serve as a company’s DNA, unveiling its hidden risks and operational excellence through key profitability and valuation metrics.
Dell Technologies Inc.
Dell shows a weak ROE at -310%, signaling shareholder value erosion, despite a slightly favorable ROIC of 14.7%. The P/E ratio of 15.7 suggests a fairly valued stock. Dividend yield stands at 1.77%, reflecting moderate shareholder returns amid reinvestment in R&D at 3.2% of revenue. Liquidity remains a concern with a 0.78 current ratio.
Seagate Technology Holdings plc
Seagate posts a strong net margin of 16.2% and a robust ROIC of 33.8%, highlighting operational efficiency. Its P/E at 20.4 is neutral but leans toward expensive relative to Dell. The dividend yield of 2.0% combined with favorable interest coverage and asset turnover ratios indicates solid shareholder returns and financial health, despite elevated debt-to-assets at 67%.
Operational Efficiency vs. Valuation Discipline
Seagate offers a better balance of profitability and shareholder return with stronger margins and cash flow metrics. Dell’s valuation appears more conservative but is weighed down by poor ROE and liquidity risks. Investors prioritizing operational strength might lean toward Seagate, while those valuing valuation discipline may consider Dell’s profile.
Which one offers the Superior Shareholder Reward?
I see Dell offers a modest 1.77% dividend yield with a sustainable payout ratio near 28%, backed by a free cash flow of 2.7/share. Its buybacks appear less aggressive. Seagate yields 2.0%, with a higher payout ratio around 41%, supported by solid free cash flow of 3.9/share. Seagate’s buyback intensity is stronger, enhancing total returns. Historically, Seagate’s distribution combines dividends and buybacks more aggressively, aligning with shareholder value growth. I conclude Seagate offers a superior total return profile in 2026, balancing yield and capital return more sustainably than Dell.
Comparative Score Analysis: The Strategic Profile
The radar chart reveals the fundamental DNA and trade-offs of Dell Technologies Inc. and Seagate Technology Holdings plc:
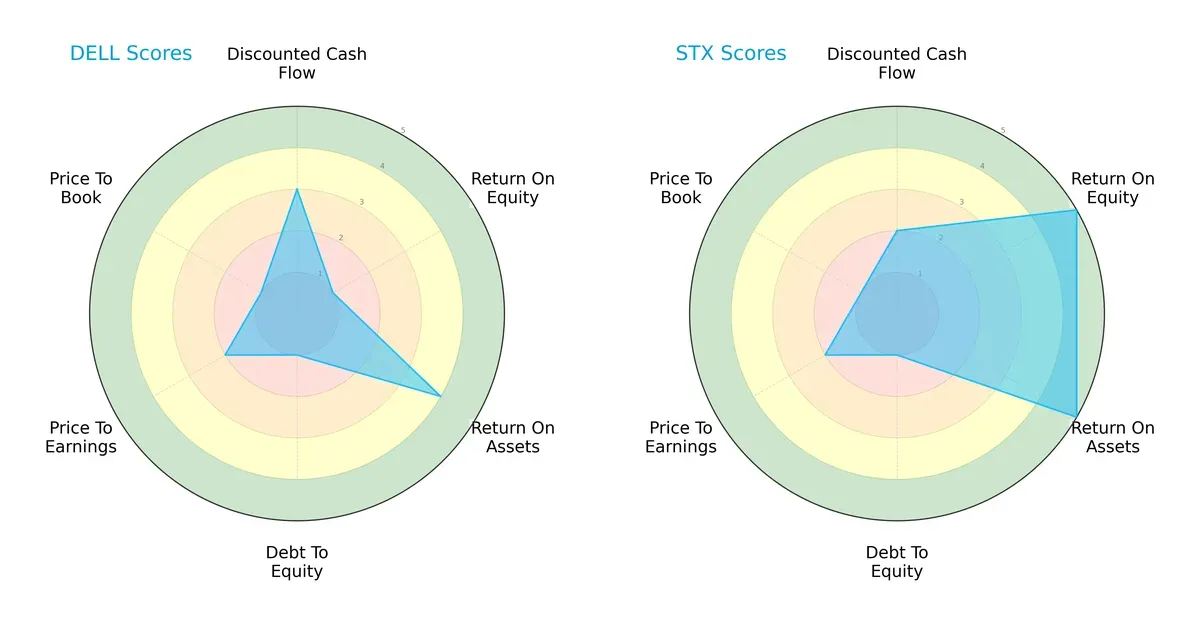
Seagate boasts superior returns, with ROE and ROA scores at 5, demonstrating operational efficiency. Dell trails with a weak ROE of 1, though it has a slightly better DCF score of 3 versus Seagate’s 2. Both firms carry high financial risk, shown by identical low debt-to-equity scores of 1. Valuation metrics (PE and PB) remain moderate to unfavorable for both. Seagate offers a more balanced profile, powered by profitability, while Dell relies on cash flow projections despite weaker equity returns.
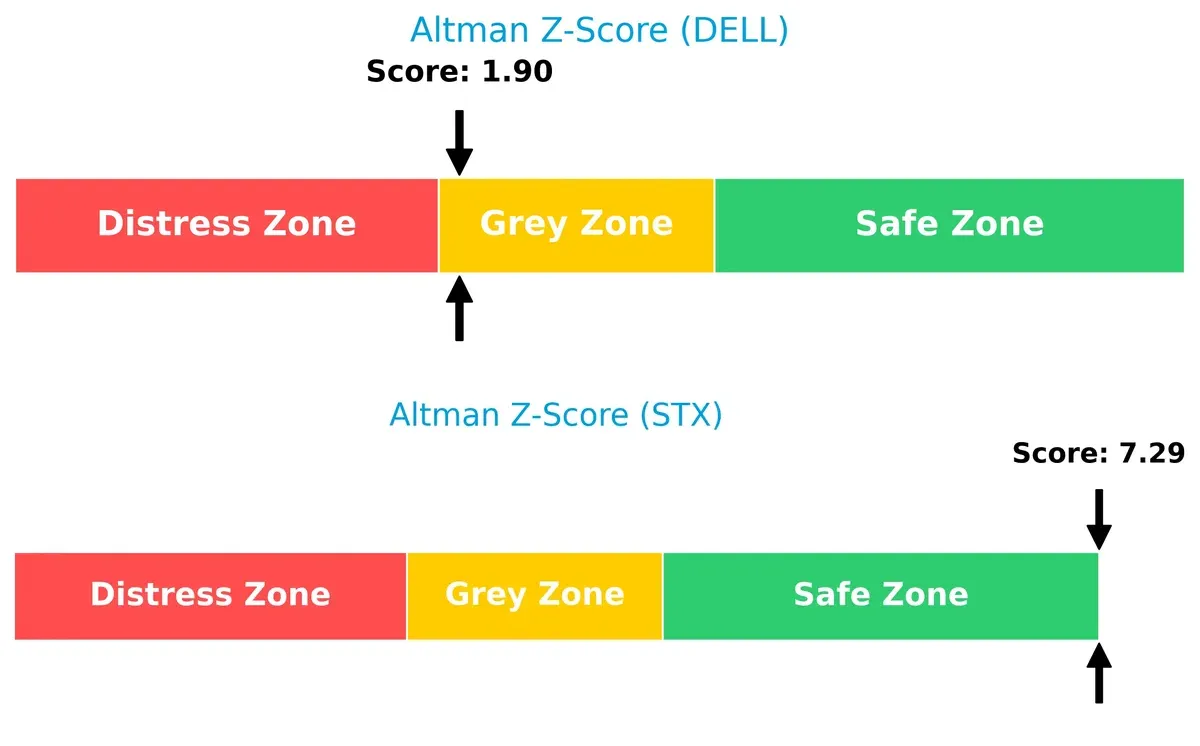
Bankruptcy Risk: Solvency Showdown
Seagate’s Altman Z-Score of 7.29 places it firmly in the safe zone, signaling strong long-term survival potential. Dell’s score of 1.90 situates it in the grey zone, hinting at moderate bankruptcy risk in this economic cycle:
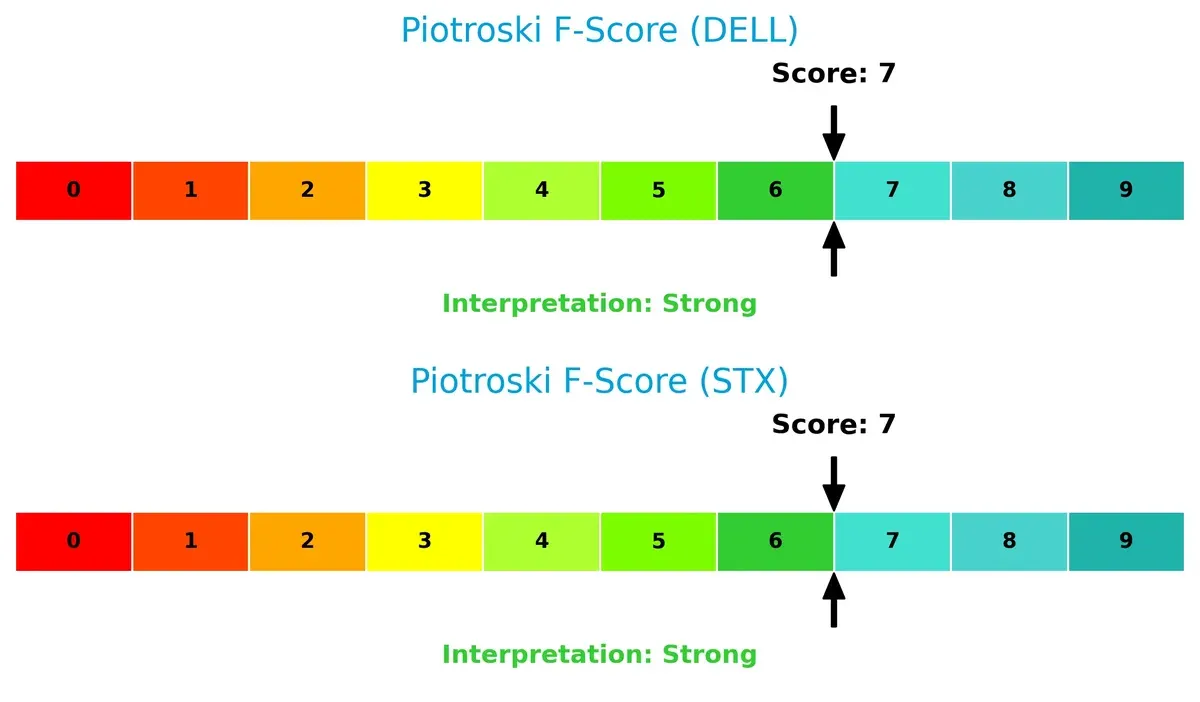
Financial Health: Quality of Operations
Both companies score a healthy 7 on the Piotroski F-Score, indicating strong internal financial health. Neither shows immediate red flags, but Dell’s lower equity returns and solvency risk warrant careful monitoring:
How are the two companies positioned?
This section dissects Dell and Seagate’s operational DNA by comparing revenue distribution and internal dynamics. The goal is to confront their economic moats to identify the more resilient, sustainable competitive advantage today.
Revenue Segmentation: The Strategic Mix
This visual comparison dissects how Dell Technologies Inc. and Seagate Technology Holdings plc diversify their income streams and where their primary sector bets lie:
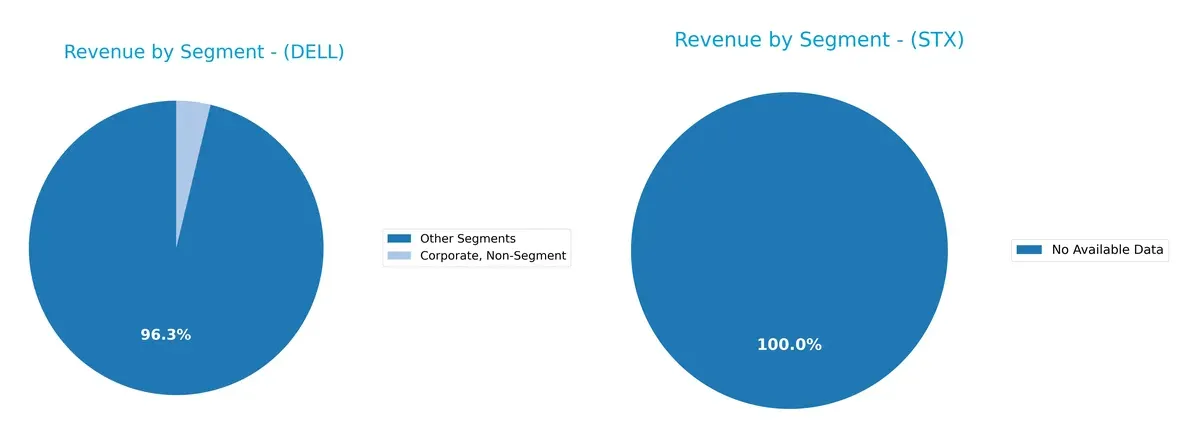
Dell Technologies anchors its revenue in Client Solutions ($49B in 2024) and Infrastructure Solutions Group ($34B), showing a balanced mix between end-user devices and enterprise infrastructure. By contrast, Seagate lacks available segmentation data, preventing a direct comparison. Dell’s diversified segments reduce concentration risk and reinforce ecosystem lock-in, leveraging robust infrastructure dominance alongside steady client demand. This balance underpins Dell’s resilience in volatile tech cycles.
Strengths and Weaknesses Comparison
This table compares the strengths and weaknesses of Dell Technologies Inc. and Seagate Technology Holdings plc:
Dell Strengths
- Diversified revenue streams including Client Solutions and Infrastructure Solutions
- Balanced US and Non-US sales near 51B and 44B respectively
- Favorable ROIC at 14.7% exceeding WACC at 8.1%
- Strong asset turnover ratios indicating efficient use of assets
Seagate Strengths
- High net margin at 16.2% showing strong profitability
- Superior ROIC at 33.8% well above WACC at 11.1%
- Favorable interest coverage ratio of 5.7
- Higher dividend yield of 2.0% indicating shareholder returns
- Asset turnover and fixed asset turnover both favorable
Dell Weaknesses
- Unfavorable net margin at 4.8% showing pressure on profitability
- Negative and extreme ROE at -310%
- Current and quick ratios below 1, signaling liquidity risk
- High proportion of unfavorable ratios at 28.6%
- Negative PB ratio may reflect accounting or valuation concerns
Seagate Weaknesses
- Negative and extreme ROE at -324% despite profitability
- Elevated debt to assets ratio at 67%, increasing financial risk
- Unfavorable WACC at 11.1%, higher cost of capital
- Fewer geographic diversification with concentration in US, Singapore, Netherlands
Both companies show strengths in efficient capital use and asset management. Dell enjoys more balanced geographic revenue diversification, while Seagate excels in profitability and shareholder yield but carries higher financial leverage risks. These factors shape each firm’s strategic focus on growth, liquidity, and capital structure management.
The Moat Duel: Analyzing Competitive Defensibility
A structural moat protects long-term profits from relentless competition erosion. Let’s dissect how Dell and Seagate defend their turf:
Dell Technologies Inc.: Cost Advantage and Ecosystem Integration
Dell leverages scale and integrated IT solutions, reflecting in a solid ROIC advantage over WACC by 6.6%. Its diversified product segments sustain margin stability. In 2026, hybrid cloud and multi-device management deepen Dell’s moat amid rising IT complexity.
Seagate Technology Holdings plc: Cost Leadership with Specialized Storage
Seagate’s moat stems from cost leadership in mass capacity storage, shown by a superior ROIC premium of 22.7%. It outperforms Dell in profitability metrics. Seagate’s edge-to-cloud platform and enterprise SSD growth position it to widen its moat as data demand surges.
Verdict: Cost Advantage vs. Specialized Scale Economies
Seagate commands a wider moat through higher ROIC and margin dominance, fueled by specialized storage expertise. Dell maintains a durable, growing moat via integrated IT ecosystems. Seagate is better equipped to defend market share in the evolving data storage landscape.
Which stock offers better returns?
The past year reveals stark contrasts in price dynamics. Dell Technologies exhibits slight decline with decelerating losses, while Seagate Technology surges strongly, accelerating gains amid rising volume dominance.
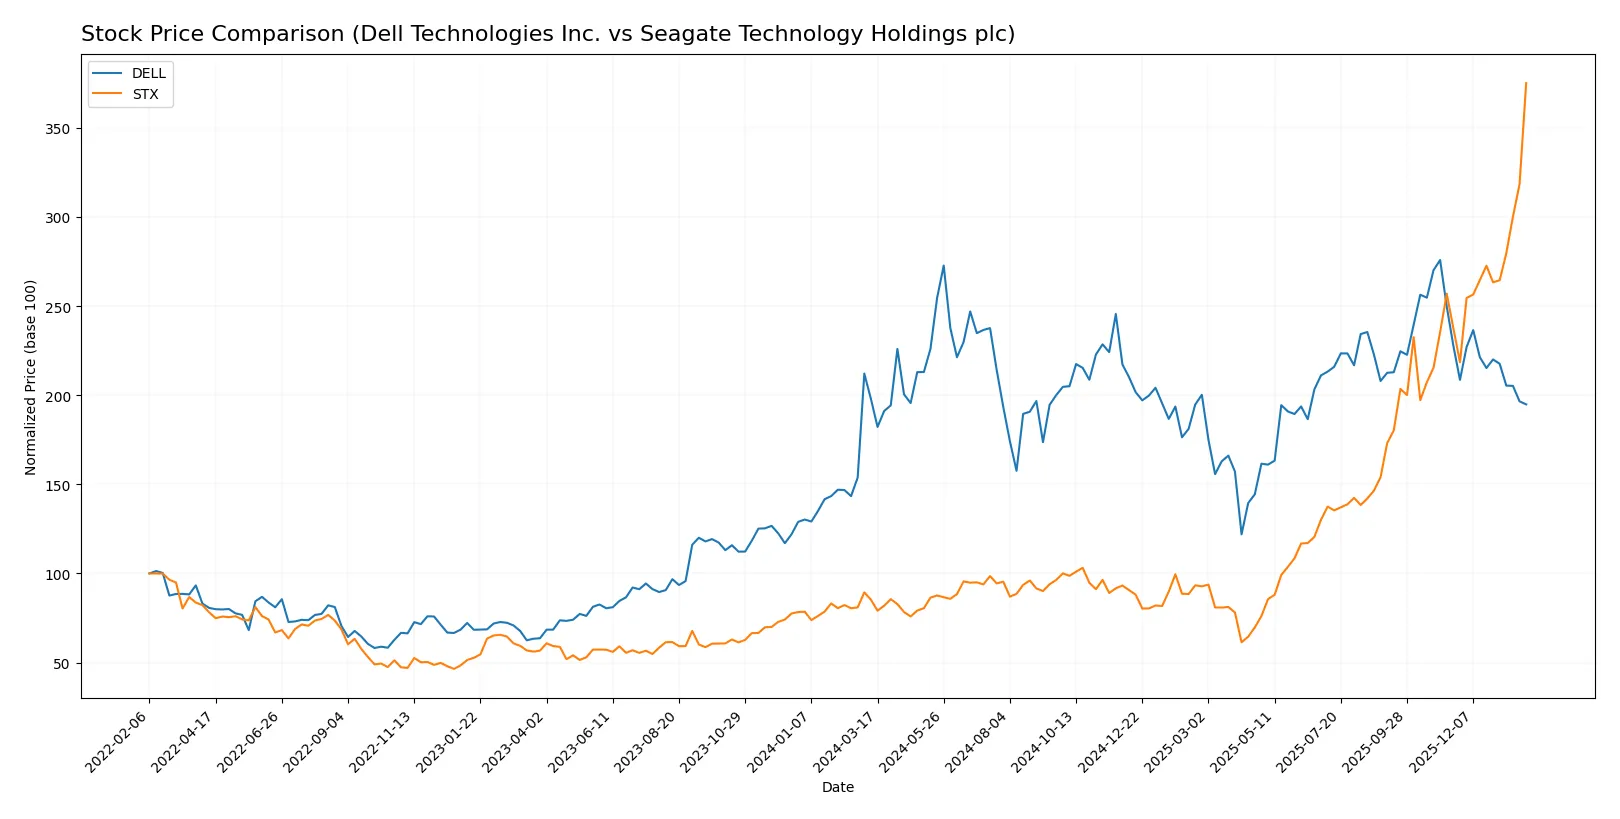
Trend Comparison
Dell Technologies’ stock fell 1.56% over the past 12 months, signaling a bearish trend with decelerating losses. It reached a high of 162.01 and low of 71.63, showing moderate volatility (16.69 std deviation).
Seagate Technology’s price soared 339.84% over the same period, reflecting a bullish trend with accelerating momentum. The stock ranged between 66.73 and 407.69, with high volatility (73.81 std deviation).
Seagate outperformed Dell markedly, delivering superior market returns and stronger volume trends, underscoring its dominant position in this comparison.
Target Prices
Analysts present a cautiously optimistic consensus on Dell Technologies and Seagate Technology.
| Company | Target Low | Target High | Consensus |
|---|---|---|---|
| Dell Technologies Inc. | 111 | 200 | 163.67 |
| Seagate Technology Holdings plc | 270 | 505 | 407.2 |
The consensus targets show significant upside for Dell, currently at $114.44, and a near match for Seagate’s $407.69 price, signaling moderate growth expectations.

Don’t Let Luck Decide Your Entry Point
Optimize your entry points with our advanced ProRealTime indicators. You’ll get efficient buy signals with precise price targets for maximum performance. Start outperforming now!
How do institutions grade them?
Dell Technologies Inc. Grades
This table summarizes recent grades from major financial institutions for Dell Technologies Inc.:
| Grading Company | Action | New Grade | Date |
|---|---|---|---|
| Citigroup | Maintain | Buy | 2026-01-20 |
| Morgan Stanley | Maintain | Underweight | 2026-01-20 |
| Barclays | Upgrade | Overweight | 2026-01-15 |
| Goldman Sachs | Maintain | Buy | 2026-01-14 |
| Morgan Stanley | Maintain | Underweight | 2025-11-26 |
| B of A Securities | Maintain | Buy | 2025-11-26 |
| Mizuho | Maintain | Outperform | 2025-11-26 |
| Barclays | Maintain | Equal Weight | 2025-11-26 |
| UBS | Maintain | Buy | 2025-11-26 |
| B of A Securities | Maintain | Buy | 2025-11-20 |
Seagate Technology Holdings plc Grades
This table summarizes recent grades from major financial institutions for Seagate Technology Holdings plc:
| Grading Company | Action | New Grade | Date |
|---|---|---|---|
| Citigroup | Maintain | Buy | 2026-01-29 |
| Baird | Maintain | Outperform | 2026-01-29 |
| Rosenblatt | Maintain | Buy | 2026-01-28 |
| Wells Fargo | Maintain | Equal Weight | 2026-01-28 |
| Cantor Fitzgerald | Maintain | Overweight | 2026-01-28 |
| Mizuho | Maintain | Outperform | 2026-01-28 |
| UBS | Maintain | Neutral | 2026-01-28 |
| Goldman Sachs | Maintain | Buy | 2026-01-28 |
| Barclays | Maintain | Equal Weight | 2026-01-28 |
| Mizuho | Maintain | Outperform | 2026-01-27 |
Which company has the best grades?
Seagate Technology consistently receives “Buy” and “Outperform” grades from multiple firms, indicating a strong consensus. Dell’s grades are more mixed, with some “Buy” and “Overweight” ratings but also repeated “Underweight” calls. Seagate’s stronger grades may attract investors seeking more bullish institutional sentiment.
Risks specific to each company
The following categories identify the critical pressure points and systemic threats facing both firms in the 2026 market environment:
1. Market & Competition
Dell Technologies Inc.
- Faces intense competition across diversified IT hardware and cloud segments, impacting margins.
Seagate Technology Holdings plc
- Competes heavily in specialized storage products, with pressure from cloud alternatives.
2. Capital Structure & Debt
Dell Technologies Inc.
- Moderate debt-to-assets at 31%, with decent interest coverage but weak current liquidity ratios.
Seagate Technology Holdings plc
- High debt-to-assets at 67%, though interest coverage is stronger; liquidity ratios are neutral.
3. Stock Volatility
Dell Technologies Inc.
- Beta of 1.11 indicates moderate volatility, with recent price drops signaling pressure.
Seagate Technology Holdings plc
- Higher beta of 1.62 signals greater volatility and sensitivity to market swings.
4. Regulatory & Legal
Dell Technologies Inc.
- Operates globally with exposure to evolving data privacy and tech export regulations.
Seagate Technology Holdings plc
- Faces similar regulatory risks, especially in data and cross-border trade compliance.
5. Supply Chain & Operations
Dell Technologies Inc.
- Complex global supply chain risks including chip shortages and logistics delays.
Seagate Technology Holdings plc
- Supply chain exposed to component scarcity and geopolitical tensions affecting manufacturing hubs.
6. ESG & Climate Transition
Dell Technologies Inc.
- Increasing focus on sustainability in IT hardware lifecycle; transitioning to greener operations.
Seagate Technology Holdings plc
- Actively advancing ESG initiatives, but dependent on energy-intensive manufacturing processes.
7. Geopolitical Exposure
Dell Technologies Inc.
- US-based with global operations; exposed to US-China tensions and trade policies.
Seagate Technology Holdings plc
- Ireland-based with manufacturing in Asia; vulnerable to cross-border tariffs and supply disruptions.
Which company shows a better risk-adjusted profile?
Seagate’s primary risk lies in its high leverage, raising financial vulnerability despite strong profitability and cash flow metrics. Dell struggles with weaker liquidity and volatile profitability, risking operational flexibility. Seagate’s higher Altman Z-score (7.29, safe zone) versus Dell’s 1.9 (grey zone) confirms better financial health. Despite volatility, Seagate’s superior profitability and capital efficiency create a more favorable risk-adjusted profile in 2026.
Final Verdict: Which stock to choose?
Dell Technologies Inc. shines with its superpower of efficient capital allocation, evidenced by a steadily growing ROIC well above WACC. This signals durable value creation despite its weaker liquidity position, which remains a point of vigilance. Dell suits investors focused on long-term value and operational resilience in cyclical markets.
Seagate Technology Holdings plc boasts a strategic moat rooted in strong profitability and recurring revenue streams. Its higher current ratio and interest coverage offer a safer financial profile relative to Dell. Seagate fits investors seeking growth at a reasonable price with a preference for stability amid sector volatility.
If you prioritize durable value creation and operational efficiency, Dell outshines with its proven ability to generate returns above capital costs. However, if you seek growth combined with better liquidity and a more stable balance sheet, Seagate offers superior safety and margin expansion potential. Both present compelling but distinct analytical scenarios for different investor profiles.
Disclaimer: Investment carries a risk of loss of initial capital. The past performance is not a reliable indicator of future results. Be sure to understand risks before making an investment decision.
Go Further
I encourage you to read the complete analyses of Dell Technologies Inc. and Seagate Technology Holdings plc to enhance your investment decisions: