In today’s fast-evolving tech landscape, Dell Technologies Inc. and Rigetti Computing, Inc. stand out as influential players in the computer hardware sector. Dell, a seasoned giant, excels in IT infrastructure and cloud solutions, while Rigetti pioneers quantum computing innovation. Their contrasting approaches and market positions make this comparison essential. Join me as we analyze which company presents the most compelling investment opportunity for your portfolio in 2026.
Table of contents
Companies Overview
I will begin the comparison between Dell Technologies Inc. and Rigetti Computing, Inc. by providing an overview of these two companies and their main differences.
Dell Technologies Inc. Overview
Dell Technologies Inc. designs, develops, manufactures, markets, sells, and supports IT solutions, products, and services worldwide. Operating through Infrastructure Solutions Group, Client Solutions Group, and VMware segments, Dell focuses on traditional and next-generation storage, servers, desktops, cloud, and security. Founded in 1984 and headquartered in Round Rock, Texas, it is a major player in the computer hardware industry with a market cap of 80B USD.
Rigetti Computing, Inc. Overview
Rigetti Computing, Inc. is an integrated systems company specializing in building quantum computers and superconducting quantum processors. Founded in 2013 and based in Berkeley, California, it offers Quantum Cloud Services that integrate its machines into various cloud environments. Rigetti is a smaller player in the computer hardware sector, with a market cap of 8B USD, focusing on cutting-edge quantum technology.
Key similarities and differences
Both companies operate in the technology sector within computer hardware but differ significantly in scale and focus. Dell provides a broad range of IT infrastructure solutions including servers, storage, and cloud services, while Rigetti concentrates exclusively on the niche quantum computing market. Dell’s business model spans multiple segments and established markets, whereas Rigetti targets emerging quantum computing technologies integrated with cloud platforms.
Income Statement Comparison
This table compares key income statement metrics for Dell Technologies Inc. and Rigetti Computing, Inc. for their most recent fiscal years.
| Metric | Dell Technologies Inc. | Rigetti Computing, Inc. |
|---|---|---|
| Market Cap | 80.2B | 8.1B |
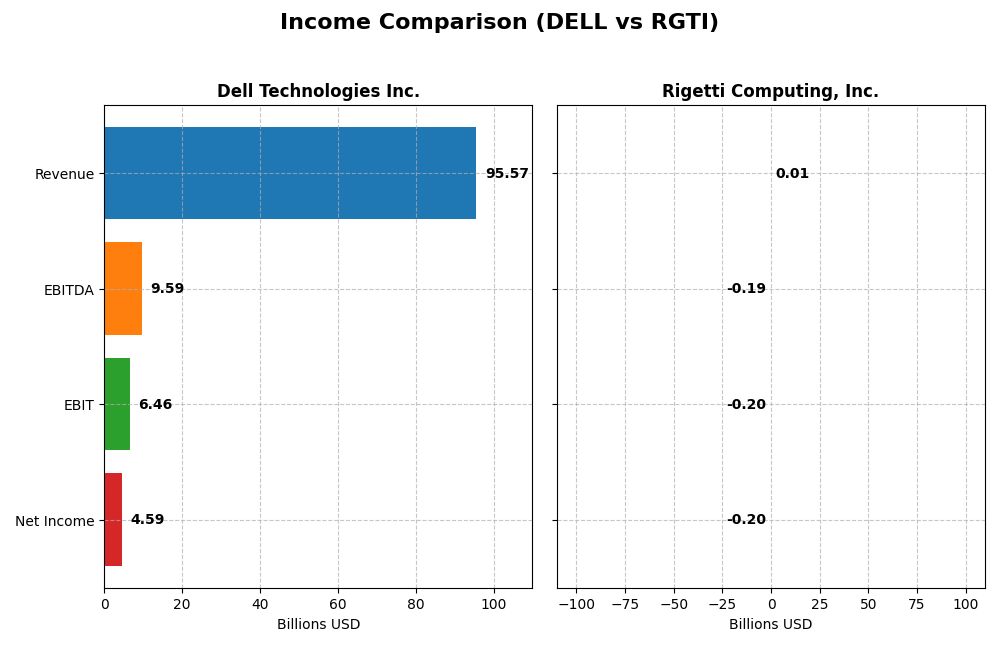
| Revenue | 95.6B | 10.8M |
| EBITDA | 9.6B | -191M |
| EBIT | 6.5B | -198M |
| Net Income | 4.6B | -201M |
| EPS | 6.51 | -1.09 |
| Fiscal Year | 2025 | 2024 |
Income Statement Interpretations
Dell Technologies Inc.
Dell Technologies showed steady revenue growth from 2021 to 2025, rising from $86.7B to $95.6B, with net income increasing significantly from $3.2B to $4.6B. Gross margins remained stable around 22%, while net margins hovered near 4.8%. In 2025, revenue growth accelerated to 8.1%, net margin improved by 25.4%, and EPS rose 38.7%, indicating strengthened profitability.
Rigetti Computing, Inc.
Rigetti Computing experienced fluctuating revenues, peaking around $13.1M in 2022 before declining to $10.8M in 2024, with net losses deepening from -$17.2M in 2020 to -$201M in 2024. Despite a high gross margin near 53%, EBIT and net margins were deeply negative, exceeding -1800%, reflecting ongoing operational losses. The latest year showed a 10% revenue decline and worsening margins.
Which one has the stronger fundamentals?
Dell demonstrates stronger fundamentals with consistent revenue and net income growth, stable gross margins, and improving profitability metrics, supported by favorable operational efficiency. Conversely, Rigetti’s business suffers from significant losses, unfavorable margin trends, and declining recent revenues, reflecting fundamental challenges. Dell’s overall income statement evaluation is favorable; Rigetti’s is unfavorable.
Financial Ratios Comparison
The table below presents the most recent key financial ratios for Dell Technologies Inc. and Rigetti Computing, Inc., providing a snapshot of their fiscal year 2025 and 2024 performances, respectively.
| Ratios | Dell Technologies Inc. (2025) | Rigetti Computing, Inc. (2024) |
|---|---|---|
| ROE | -3.10% | -158.77% |
| ROIC | 14.71% | -24.91% |
| P/E | 15.71 | -14.02 |
| P/B | -48.66 | 22.26 |
| Current Ratio | 0.78 | 17.42 |
| Quick Ratio | 0.63 | 17.42 |
| D/E (Debt-to-Equity) | -16.58 | 0.07 |
| Debt-to-Assets | 30.81% | 3.09% |
| Interest Coverage | 4.41 | -21.05 |
| Asset Turnover | 1.20 | 0.04 |
| Fixed Asset Turnover | 15.08 | 0.20 |
| Payout Ratio | 27.77% | 0% |
| Dividend Yield | 1.77% | 0% |
Interpretation of the Ratios
Dell Technologies Inc.
Dell shows a mixed ratio profile with 35.71% favorable and 28.57% unfavorable indicators, resulting in a slightly favorable global opinion. Its return on invested capital (14.71%) and asset turnover ratios are strong, but negative return on equity (-309.85%) and low liquidity ratios (current ratio 0.78) raise concerns. Dell pays dividends with a 1.77% yield, supported moderately by free cash flow, but payout sustainability should be monitored carefully.
Rigetti Computing, Inc.
Rigetti presents predominantly unfavorable ratios, with 71.43% negative indicators and no neutral ones, leading to an unfavorable overall view. It suffers from significant negative profitability metrics, such as a net margin of -1862.72% and return on equity of -158.77%. Rigetti does not pay dividends, reflecting its high growth and reinvestment phase, prioritizing R&D over shareholder returns, with a strong current ratio but weak operational efficiency.
Which one has the best ratios?
Based on the evaluations, Dell Technologies has a clearly superior ratio profile compared to Rigetti, showing more favorable profitability and operational metrics alongside dividend payments. Rigetti’s financial ratios indicate high risk with poor profitability and no dividend returns, emphasizing its developmental stage. Dell’s mix of strengths and manageable weaknesses presents a relatively better financial health picture.
Strategic Positioning
This section compares the strategic positioning of Dell Technologies Inc. and Rigetti Computing, Inc., focusing on Market position, Key segments, and exposure to disruption:
Dell Technologies Inc.
- Large market cap of 80B, operating globally with established competition.
- Diverse segments: Infrastructure, Client Solutions, VMware cloud services.
- Exposure to IT infrastructure modernization, cloud, and hybrid cloud trends.
Rigetti Computing, Inc.
- Smaller market cap of 8B, niche player in quantum computing hardware.
- Concentrated on quantum computers and related cloud integration services.
- High exposure to quantum technology disruption and emerging cloud platforms.
Dell Technologies Inc. vs Rigetti Computing, Inc. Positioning
Dell employs a diversified approach with multiple mature IT segments supporting stable revenues, while Rigetti focuses narrowly on quantum computing, offering high growth potential but with concentrated risk and emerging market challenges.
Which has the best competitive advantage?
Dell shows a very favorable moat with ROIC exceeding WACC by over 6.5% and growing profitability, indicating durable competitive advantage. Rigetti’s moat is slightly unfavorable, shedding value despite improving profitability.
Stock Comparison
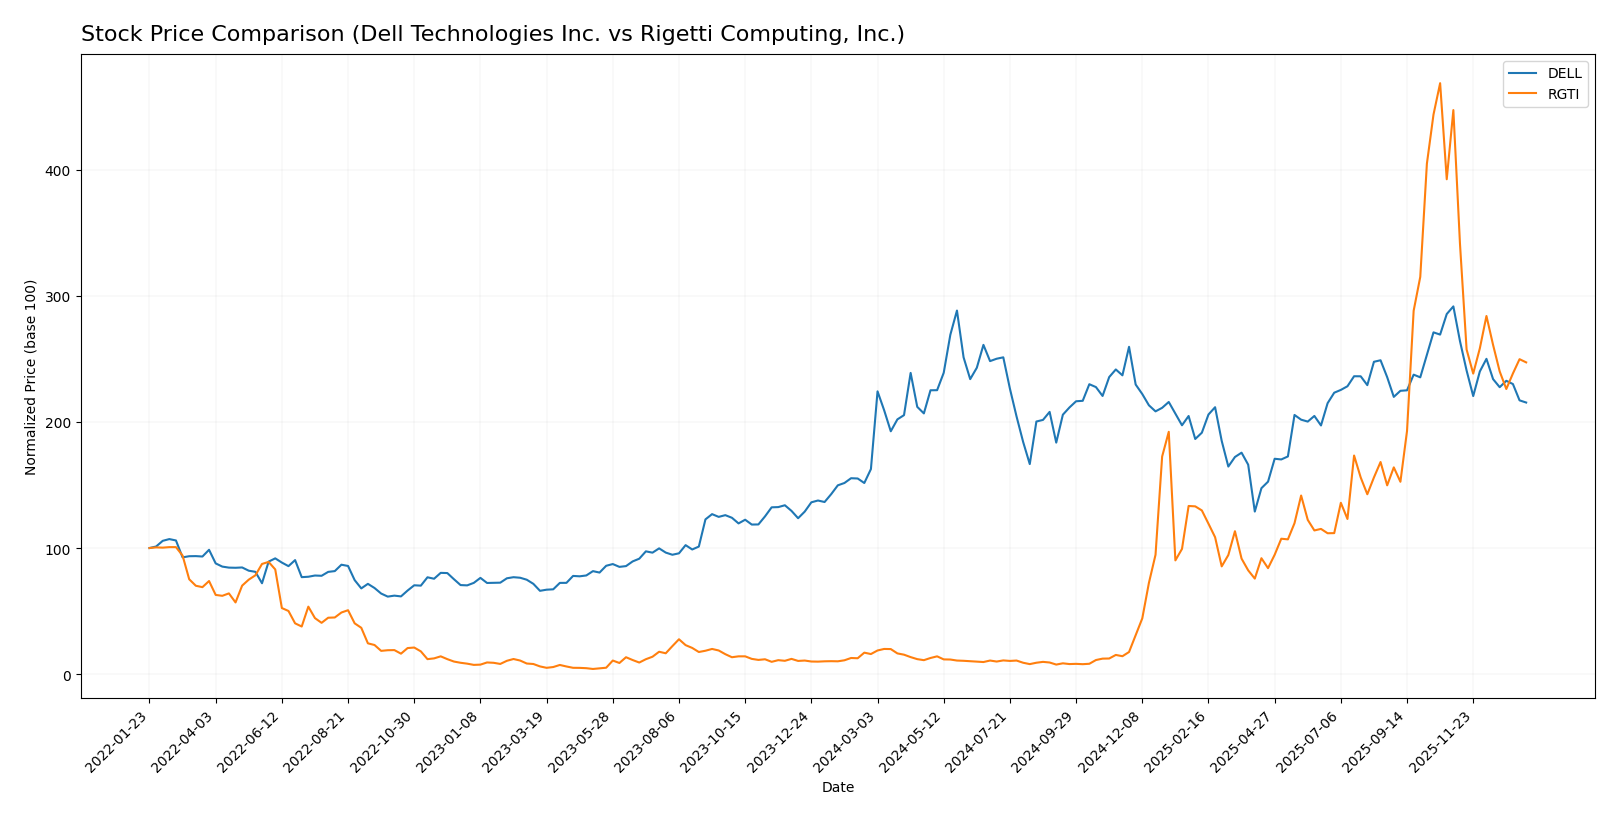
The stock price movements of Dell Technologies Inc. and Rigetti Computing, Inc. over the past year reveal significant gains for both, with Rigetti exhibiting a markedly stronger upward trajectory despite recent downturns in both stocks.
Trend Analysis
Dell Technologies Inc. showed a bullish trend over the past 12 months with a 32.44% price increase, though the trend is decelerating. The stock reached a high of 162.01 and a low of 71.63, with recent weeks showing a -26.14% decline.
Rigetti Computing, Inc. experienced a strong bullish trend with a 1448.73% price increase over the year, also decelerating. The stock ranged from 0.75 to 46.38, but recent months saw a -44.73% decrease.
Comparing the two, Rigetti delivered the highest market performance with a substantially greater overall price increase, despite both stocks facing recent short-term declines.
Target Prices
Analysts present a cautiously optimistic consensus on Dell Technologies Inc. and Rigetti Computing, Inc.
| Company | Target High | Target Low | Consensus |
|---|---|---|---|
| Dell Technologies Inc. | 200 | 113 | 163.83 |
| Rigetti Computing, Inc. | 50 | 18 | 35.83 |
The target consensus for Dell suggests a substantial upside from its current price of 119.7 USD, indicating positive growth expectations. Rigetti’s consensus target is also above its current price of 24.47 USD, reflecting moderate confidence in its quantum computing prospects.
Analyst Opinions Comparison
This section compares analysts’ ratings and grades for Dell Technologies Inc. (DELL) and Rigetti Computing, Inc. (RGTI):
Rating Comparison
DELL Rating
- Rating: C+ (Very Favorable)
- Discounted Cash Flow Score: 3, Moderate valuation indication
- ROE Score: 1, Very Unfavorable efficiency in generating profit from equity
- ROA Score: 4, Favorable asset utilization
- Debt To Equity Score: 1, Very Unfavorable financial risk
- Overall Score: 2, Moderate overall financial standing
RGTI Rating
- Rating: C (Very Favorable)
- Discounted Cash Flow Score: 1, Very Unfavorable valuation indication
- ROE Score: 1, Very Unfavorable efficiency in generating profit from equity
- ROA Score: 1, Very Unfavorable asset utilization
- Debt To Equity Score: 4, Favorable financial risk
- Overall Score: 2, Moderate overall financial standing
Which one is the best rated?
Based strictly on the data, DELL holds a slightly better rating grade (C+) compared to RGTI (C). DELL shows stronger discounted cash flow and return on assets scores, while RGTI has a better debt-to-equity score. Overall scores are equal.
Scores Comparison
Here is a comparison of the Altman Z-Score and Piotroski Score for Dell Technologies Inc. and Rigetti Computing, Inc.:
Dell Scores
- Altman Z-Score: 1.93, grey zone indicating moderate bankruptcy risk.
- Piotroski Score: 7, strong financial health rating.
Rigetti Scores
- Altman Z-Score: 101.71, safe zone indicating very low bankruptcy risk.
- Piotroski Score: 2, very weak financial health rating.
Which company has the best scores?
Based strictly on the provided data, Rigetti has a much stronger Altman Z-Score indicating financial safety, but Dell has a significantly stronger Piotroski Score reflecting better overall financial health. Each company leads in one key score.
Grades Comparison
Here is a detailed comparison of recent grades assigned to Dell Technologies Inc. and Rigetti Computing, Inc.:
Dell Technologies Inc. Grades
The following table lists recent grades from well-known grading companies for Dell Technologies Inc.:
| Grading Company | Action | New Grade | Date |
|---|---|---|---|
| Mizuho | Maintain | Outperform | 2025-11-26 |
| B of A Securities | Maintain | Buy | 2025-11-26 |
| Morgan Stanley | Maintain | Underweight | 2025-11-26 |
| UBS | Maintain | Buy | 2025-11-26 |
| Barclays | Maintain | Equal Weight | 2025-11-26 |
| B of A Securities | Maintain | Buy | 2025-11-20 |
| JP Morgan | Maintain | Overweight | 2025-11-17 |
| Morgan Stanley | Downgrade | Underweight | 2025-11-17 |
| Raymond James | Maintain | Outperform | 2025-10-21 |
| Argus Research | Maintain | Buy | 2025-10-09 |
Dell’s grades exhibit a mix of Buy and Outperform ratings, with some Equal Weight and Underweight views, indicating varied analyst sentiment but a general leaning toward positive outlooks.
Rigetti Computing, Inc. Grades
The following table summarizes recent grades from reputable grading firms for Rigetti Computing, Inc.:
| Grading Company | Action | New Grade | Date |
|---|---|---|---|
| B. Riley Securities | Maintain | Neutral | 2025-11-12 |
| Benchmark | Maintain | Buy | 2025-11-12 |
| B. Riley Securities | Downgrade | Neutral | 2025-11-03 |
| Benchmark | Maintain | Buy | 2025-10-07 |
| B. Riley Securities | Maintain | Buy | 2025-09-22 |
| Benchmark | Maintain | Buy | 2025-08-13 |
| Needham | Maintain | Buy | 2025-08-04 |
| B. Riley Securities | Maintain | Buy | 2025-07-23 |
| Benchmark | Maintain | Buy | 2025-05-15 |
| Needham | Maintain | Buy | 2025-05-14 |
Rigetti’s grades are predominantly Buy, with a few Neutral ratings from B. Riley Securities, reflecting mostly positive analyst sentiment with some caution.
Which company has the best grades?
Dell Technologies shows a broader range of grades, including several Buy and Outperform ratings but also some Underweight and Equal Weight, suggesting mixed analyst views. Rigetti Computing exhibits mostly Buy ratings with occasional Neutral positions, indicating a generally positive but more consistent outlook. Investors may interpret Dell’s varied grades as reflecting sector or company-specific risks, while Rigetti’s grades suggest steadier confidence from analysts.
Strengths and Weaknesses
Below is a comparative overview of key strengths and weaknesses for Dell Technologies Inc. and Rigetti Computing, Inc. based on the most recent financial and operational data.
| Criterion | Dell Technologies Inc. | Rigetti Computing, Inc. |
|---|---|---|
| Diversification | Highly diversified with multiple segments including Client Solutions and Infrastructure Solutions, generating $91.9B in Other Segments (2025). | Limited diversification, primarily focused on quantum computing services with minimal revenue of $0.36M (2024). |
| Profitability | Positive ROIC of 14.7% and growing ROIC trend; net margin low at 4.81%, some unfavorable profitability ratios. | Negative ROIC (-24.9%) and net margin (-1862.7%), currently shedding value despite improving profitability. |
| Innovation | Established in traditional IT sectors; moderate investment in innovation. | Strong innovation focus in quantum computing, a cutting-edge technology with high growth potential. |
| Global presence | Large global footprint as a major IT hardware and services provider. | Smaller scale with niche market focus, limited global reach. |
| Market Share | Large market share in IT hardware with solid asset turnover ratios. | Emerging player with negligible market share in the quantum computing industry. |
Key takeaways: Dell shows a durable competitive advantage with strong diversification and improving profitability, though some margin pressures exist. Rigetti is an innovative but high-risk company still struggling to achieve profitability, suitable only for investors with high risk tolerance.
Risk Analysis
Below is a comparative table highlighting key risks for Dell Technologies Inc. and Rigetti Computing, Inc. based on the most recent financial and operational data available.
| Metric | Dell Technologies Inc. | Rigetti Computing, Inc. |
|---|---|---|
| Market Risk | Moderate (Beta 1.11) | High (Beta 1.71) |
| Debt level | Moderate (Debt/Assets 30.8%) | Low (Debt/Assets 3.1%) |
| Regulatory Risk | Moderate (Tech industry scrutiny) | Moderate (Quantum tech emerging regulation) |
| Operational Risk | Moderate (Complex global supply chain) | High (Early stage, tech development risks) |
| Environmental Risk | Moderate (Manufacturing footprint) | Low (Smaller scale operations) |
| Geopolitical Risk | Moderate (Global IT markets exposure) | Moderate (US-based, global cloud services) |
The most impactful risks are operational and market risks for Rigetti due to its early-stage technology and high beta, indicating volatility. Dell’s moderate debt and supply chain complexities also pose notable risks, but its diversified segments provide some resilience. Investors should weigh Rigetti’s high growth potential against its financial instability and Dell’s steadier, though less dynamic, profile.
Which Stock to Choose?
Dell Technologies Inc. shows a favorable income evolution with 10.27% revenue growth overall and 8.08% in the last year, supported by a solid gross margin of 22.24%. Its financial ratios are slightly favorable, with a strong ROIC at 14.71% and a net margin of 4.81%, despite some unfavorable indicators like negative ROE and low current ratio. Its debt levels are moderate, and it holds a very favorable rating of C+.
Rigetti Computing, Inc. presents an unfavorable income evolution, with negative net margin of -1862.72% and declining revenue growth last year by 10.14%, despite a 94.67% growth over the longer term. The company’s financial ratios are mostly unfavorable, including negative ROIC and ROE, though it maintains low debt levels and a strong current ratio. Its overall rating is very favorable at C but reflects mixed metrics.
For investors, Dell’s very favorable moat and consistent value creation suggest it might appeal to those seeking quality and stable growth. In contrast, Rigetti’s profile, marked by higher volatility and unfavorable profitability ratios but rapid growth potential, could be more aligned with risk-tolerant or speculative growth-oriented investors.
Disclaimer: Investment carries a risk of loss of initial capital. The past performance is not a reliable indicator of future results. Be sure to understand risks before making an investment decision.
Go Further
I encourage you to read the complete analyses of Dell Technologies Inc. and Rigetti Computing, Inc. to enhance your investment decisions: