In the rapidly evolving technology sector, Dell Technologies Inc. and Quantum Computing, Inc. represent two fascinating yet distinct players. Dell, a global leader in traditional IT infrastructure and hybrid cloud solutions, contrasts with Quantum Computing’s cutting-edge focus on quantum software and hardware innovation. This comparison explores their market overlap, innovation strategies, and growth potential. Join me as we analyze which company offers the most compelling investment opportunity in 2026.
Table of contents
Companies Overview
I will begin the comparison between Dell Technologies Inc. and Quantum Computing, Inc. by providing an overview of these two companies and their main differences.
Dell Technologies Inc. Overview
Dell Technologies Inc. designs, develops, manufactures, markets, sells, and supports IT solutions, products, and services globally. Operating through Infrastructure Solutions Group, Client Solutions Group, and VMware segments, it provides storage, servers, networking, desktops, and cloud software. Founded in 1984 and headquartered in Round Rock, Texas, Dell holds a strong position in the computer hardware industry with a market cap of 80.2B USD and 108,000 employees.
Quantum Computing, Inc. Overview
Quantum Computing, Inc. focuses on software tools and applications for quantum computers, offering products like Qatalyst and multiple quantum processing units. Founded in 2018 and based in Virginia, it serves commercial and government customers. The company operates with 41 employees and a market cap of 1.6B USD, positioning itself in a niche computer hardware sector centered on quantum computing technologies.
Key similarities and differences
Both Dell and Quantum Computing operate in the technology sector within the computer hardware industry. Dell has a diversified portfolio spanning traditional and cloud IT solutions with a large workforce, while Quantum Computing specializes in quantum software and hardware with a much smaller team. Dell targets broad IT infrastructure markets, whereas Quantum Computing focuses on emerging quantum computing applications for select commercial and government clients.
Income Statement Comparison
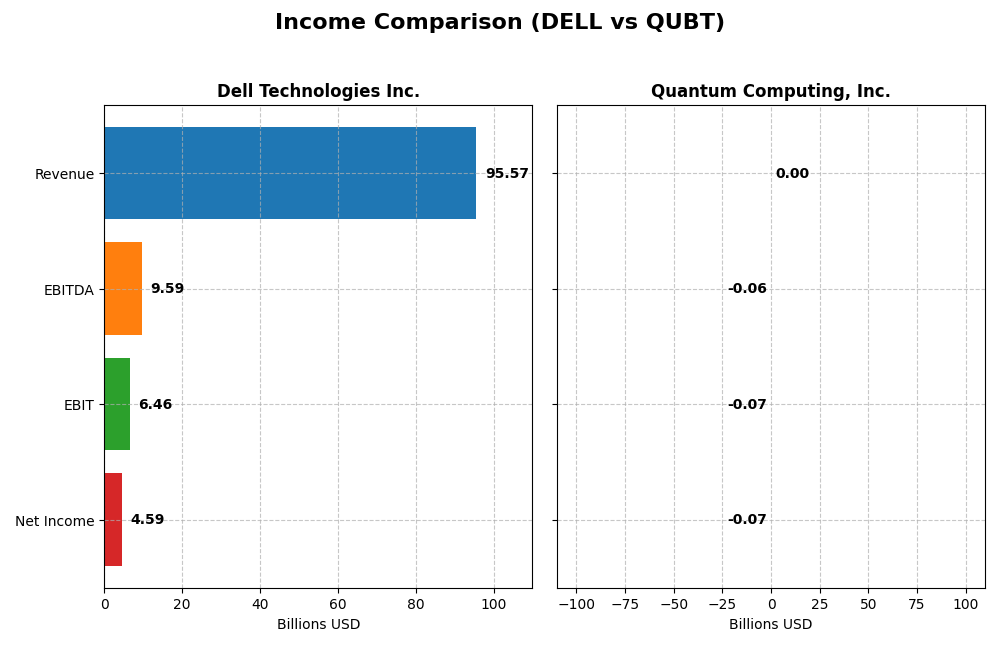
The table below presents a clear comparison of the most recent fiscal year income statement metrics for Dell Technologies Inc. and Quantum Computing, Inc., highlighting key financial figures.
| Metric | Dell Technologies Inc. | Quantum Computing, Inc. |
|---|---|---|
| Market Cap | 80.2B | 1.6B |
| Revenue | 95.6B | 373K |
| EBITDA | 9.6B | -62.2M |
| EBIT | 6.5B | -66.0M |
| Net Income | 4.6B | -68.5M |
| EPS | 6.51 | -0.73 |
| Fiscal Year | 2025 | 2024 |
Income Statement Interpretations
Dell Technologies Inc.
Dell Technologies showed consistent revenue growth from 2021 to 2025, with an 8.08% increase in the latest year and a favorable 10.27% overall period growth. Net income rose significantly by 41.29% over five years, supported by a 25.41% net margin improvement. The 2025 fiscal year saw stronger EBIT growth of 15.64%, indicating enhanced operational efficiency despite stable gross margins.
Quantum Computing, Inc.
Quantum Computing’s revenue remained minimal, growing only 4.19% in 2024, with persistently negative gross and EBIT margins indicating ongoing operational losses. Net income declined sharply by 177.11% over the period, with worsening net margins and a 73.81% drop in EPS last year. Despite slight EPS growth over five years, the overall income statement profile remains unfavorable.
Which one has the stronger fundamentals?
Dell Technologies exhibits stronger fundamentals with favorable revenue and net income growth, improving margins, and controlled interest expenses. Conversely, Quantum Computing faces significant challenges with negative profitability metrics and net losses dominating its income statement. Dell’s consistent positive trends contrast sharply with Quantum’s persistent unfavorable financial performance.
Financial Ratios Comparison
The table below compares key financial ratios for Dell Technologies Inc. and Quantum Computing, Inc. based on their most recent fiscal year data, providing a snapshot of their financial performance and stability.
| Ratios | Dell Technologies Inc. (2025) | Quantum Computing, Inc. (2024) |
|---|---|---|
| ROE | -3.10% | -63.89% |
| ROIC | 14.71% | -17.41% |
| P/E | 15.71 | -22.67 |
| P/B | -48.66 | 14.48 |
| Current Ratio | 0.78 | 17.36 |
| Quick Ratio | 0.63 | 17.36 |
| D/E | -16.58 | 0.01 |
| Debt-to-Assets | 30.81% | 0.77% |
| Interest Coverage | 4.41 | -10.39 |
| Asset Turnover | 1.20 | 0.0024 |
| Fixed Asset Turnover | 15.08 | 0.038 |
| Payout ratio | 27.77% | -0.31% |
| Dividend yield | 1.77% | 0.01% |
Interpretation of the Ratios
Dell Technologies Inc.
Dell’s financial ratios present a mixed picture with 35.71% favorable and 28.57% unfavorable indicators. Strong points include a solid return on invested capital (14.71%) and asset turnover ratios, while concerns arise from a negative return on equity (-309.85%) and liquidity ratios below 1. Dell pays dividends with a 1.77% yield, suggesting moderate shareholder returns supported by stable free cash flow coverage.
Quantum Computing, Inc.
Quantum Computing’s ratios are predominantly weak, with 71.43% unfavorable metrics highlighting negative profitability and returns, including net margin at -18375.87% and return on equity at -63.89%. Its liquidity ratios are inconsistent, but it maintains low debt levels. The company does not pay dividends, reflecting its high-risk, early-stage growth profile focused on reinvestment and R&D.
Which one has the best ratios?
Dell Technologies shows a slightly favorable overall ratio profile with balanced strengths in capital efficiency and shareholder returns, whereas Quantum Computing displays predominantly unfavorable ratios marked by poor profitability and high risk. Thus, Dell’s ratios are generally more robust compared to Quantum Computing’s current financial standing.
Strategic Positioning
This section compares the strategic positioning of Dell Technologies Inc. and Quantum Computing, Inc., including market position, key segments, and exposure to technological disruption:
Dell Technologies Inc.
- Large market cap of 80B with moderate competitive pressure in computer hardware industry.
- Diversified segments: Client Solutions, Infrastructure, VMware cloud services, and others generating significant revenue.
- Moderate exposure to disruption; leverages hybrid cloud and IT infrastructure modernization amid evolving technology.
Quantum Computing, Inc.
- Small market cap of 1.6B, facing high volatility and competitive pressure in emerging quantum computing.
- Focused on quantum software tools and quantum processing units for commercial and government clients.
- High exposure to technological disruption as a pure quantum computing software and hardware developer.
Dell Technologies Inc. vs Quantum Computing, Inc. Positioning
Dell’s diversified business model spans hardware, cloud, and software, providing stable revenue streams but moderate disruption risk. Quantum Computing is highly specialized in quantum technology, offering growth potential but limited diversification and revenue scale.
Which has the best competitive advantage?
Dell demonstrates a very favorable moat with strong value creation and growing ROIC, indicating durable competitive advantage. Quantum Computing shows slightly unfavorable moat status, destroying value despite growing profitability, reflecting higher risk and less established advantage.
Stock Comparison
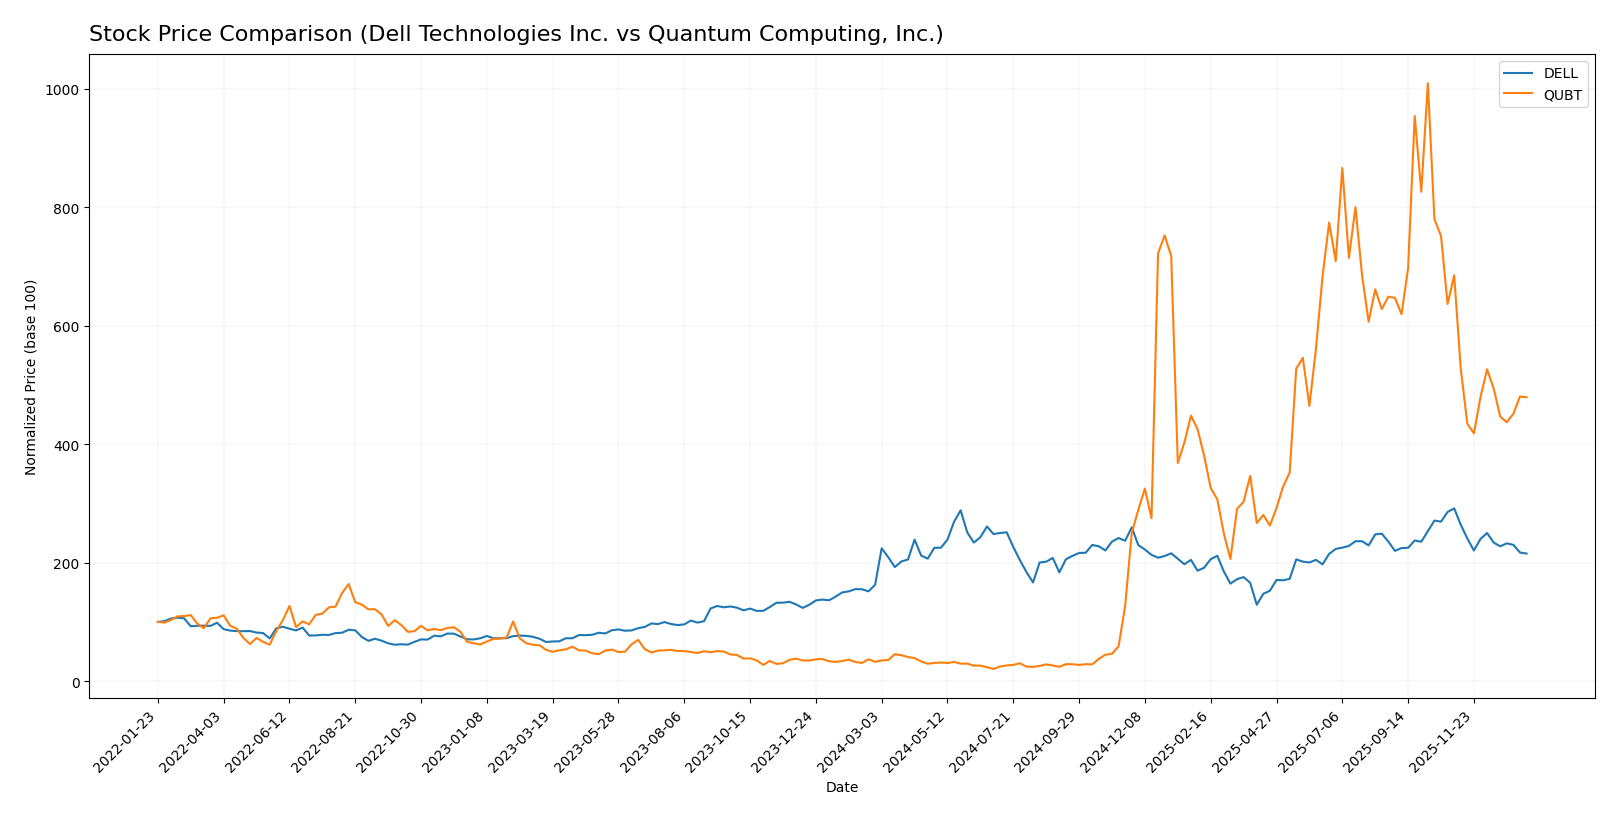
The stock price movements of Dell Technologies Inc. and Quantum Computing, Inc. over the past year reveal significant bullish trends with notable deceleration and recent declines in both equities.
Trend Analysis
Dell Technologies Inc. experienced a 32.44% price increase over the past year, indicating a bullish trend with deceleration. Its price ranged from 71.63 to 162.01, showing moderate volatility with a standard deviation of 16.95.
Quantum Computing, Inc. showed an extraordinary 1362.9% price increase over the same period, also bullish with deceleration. Prices fluctuated between 0.5 and 24.62 with lower volatility, reflected by a 6.91 standard deviation.
Comparing both stocks, Quantum Computing, Inc. delivered the highest market performance with a substantially larger percentage gain despite recent downward trends in both companies.
Target Prices
The target price consensus from recognized analysts indicates potential upside for both Dell Technologies Inc. and Quantum Computing, Inc.
| Company | Target High | Target Low | Consensus |
|---|---|---|---|
| Dell Technologies Inc. | 200 | 113 | 163.83 |
| Quantum Computing, Inc. | 40 | 10 | 19.5 |
Analysts expect Dell’s stock price to rise significantly above its current level of $119.7, while Quantum Computing’s consensus target of $19.5 suggests a near doubling from the current price of $11.69.
Analyst Opinions Comparison
This section compares analysts’ ratings and grades for Dell Technologies Inc. and Quantum Computing, Inc.:
Rating Comparison
Dell Rating
- Rating: C+ with a very favorable overall rating status.
- Discounted Cash Flow Score: 3, moderate status.
- ROE Score: 1, very unfavorable status.
- ROA Score: 4, favorable status.
- Debt To Equity Score: 1, very unfavorable status.
- Overall Score: 2, moderate status.
Quantum Computing Rating
- Rating: C+ with a very favorable overall rating status.
- Discounted Cash Flow Score: 2, moderate status.
- ROE Score: 1, very unfavorable status.
- ROA Score: 1, very unfavorable status.
- Debt To Equity Score: 5, very favorable status.
- Overall Score: 2, moderate status.
Which one is the best rated?
Both companies share the same overall rating of C+ and equal overall scores of 2. Dell has stronger ROA and DCF scores, while Quantum Computing excels in debt-to-equity, showing divergent strengths in their financial profiles.
Scores Comparison
Here is a comparison of the Altman Z-Score and Piotroski Score for Dell Technologies Inc. and Quantum Computing, Inc.:
Dell Scores
- Altman Z-Score: 1.93, in the grey zone indicating moderate bankruptcy risk.
- Piotroski Score: 7, classified as strong financial health.
Quantum Computing Scores
- Altman Z-Score: 50.17, in the safe zone indicating very low bankruptcy risk.
- Piotroski Score: 4, classified as average financial health.
Which company has the best scores?
Quantum Computing, Inc. has a significantly higher Altman Z-Score indicating strong financial stability, but Dell Technologies shows a stronger Piotroski Score, suggesting better overall financial health based on profitability and efficiency.
Grades Comparison
Here is a comparison of the latest reliable grades for Dell Technologies Inc. and Quantum Computing, Inc.:
Dell Technologies Inc. Grades
The table below summarizes recent grades from major financial institutions for Dell Technologies Inc.:
| Grading Company | Action | New Grade | Date |
|---|---|---|---|
| Mizuho | Maintain | Outperform | 2025-11-26 |
| B of A Securities | Maintain | Buy | 2025-11-26 |
| Morgan Stanley | Maintain | Underweight | 2025-11-26 |
| UBS | Maintain | Buy | 2025-11-26 |
| Barclays | Maintain | Equal Weight | 2025-11-26 |
| B of A Securities | Maintain | Buy | 2025-11-20 |
| JP Morgan | Maintain | Overweight | 2025-11-17 |
| Morgan Stanley | Downgrade | Underweight | 2025-11-17 |
| Raymond James | Maintain | Outperform | 2025-10-21 |
| Argus Research | Maintain | Buy | 2025-10-09 |
The overall trend for Dell shows a mix of buy and outperform ratings, with some hold and underweight opinions indicating a cautious but generally positive outlook.
Quantum Computing, Inc. Grades
The following table collects the latest grades from verified sources for Quantum Computing, Inc.:
| Grading Company | Action | New Grade | Date |
|---|---|---|---|
| Ascendiant Capital | Maintain | Buy | 2025-12-22 |
| Cantor Fitzgerald | Maintain | Neutral | 2025-12-18 |
| Lake Street | Maintain | Buy | 2025-11-17 |
| Ascendiant Capital | Maintain | Buy | 2025-10-03 |
| Ascendiant Capital | Maintain | Buy | 2025-06-06 |
| Ascendiant Capital | Maintain | Buy | 2025-04-28 |
| Ascendiant Capital | Maintain | Buy | 2024-11-13 |
| Ascendiant Capital | Maintain | Buy | 2023-11-24 |
Quantum Computing, Inc.’s grades consistently show a buy consensus, with a single neutral rating, indicating stable confidence from analysts.
Which company has the best grades?
Dell Technologies Inc. presents a broader range of grades from multiple reputable firms, including several “Buy” and “Outperform” ratings but also some “Underweight” and “Equal Weight” opinions. Quantum Computing, Inc. displays a more uniform buy consensus with fewer grading sources. Investors may interpret Dell’s mixed grades as reflecting a nuanced risk-reward profile, while Quantum Computing’s consistent buy ratings suggest steady analyst confidence.
Strengths and Weaknesses
Below is a comparative overview of strengths and weaknesses for Dell Technologies Inc. and Quantum Computing, Inc., based on their recent financial and operational data.
| Criterion | Dell Technologies Inc. | Quantum Computing, Inc. |
|---|---|---|
| Diversification | Highly diversified with multiple segments including Client Solutions and Infrastructure Solutions Group generating tens of billions in revenue | Very limited, mainly focused on niche quantum computing services with minimal revenue |
| Profitability | Moderate net margin (4.81%) with favorable ROIC (14.71%) indicating value creation | Negative net margin and ROIC, indicating value destruction but with improving profitability trend |
| Innovation | Strong investment in infrastructure and enterprise solutions, maintaining competitive advantage | Early-stage innovative technology but struggling with profitability and financial efficiency |
| Global presence | Global operations with significant market penetration in IT hardware and services | Limited global footprint due to niche market and early development phase |
| Market Share | Large and well-established player in IT hardware and infrastructure market | Very small market share in emerging quantum computing sector |
Key takeaways: Dell demonstrates a durable competitive advantage with strong diversification and improving returns on invested capital. Quantum Computing, while innovative with growth potential, currently shows financial weaknesses and limited market reach, suggesting higher investment risk.
Risk Analysis
Below is a comparative table outlining key risk factors for Dell Technologies Inc. (DELL) and Quantum Computing, Inc. (QUBT) based on the most recent available data:
| Metric | Dell Technologies Inc. (DELL) | Quantum Computing, Inc. (QUBT) |
|---|---|---|
| Market Risk | Beta 1.11, moderate volatility | Beta 3.49, high volatility |
| Debt Level | Debt-to-assets 30.8%, moderate | Debt-to-assets 0.77%, very low |
| Regulatory Risk | Moderate, global IT regulations | Elevated, emerging tech sector |
| Operational Risk | Large scale, complex operations | Small scale, early-stage risks |
| Environmental Risk | Moderate, supply chain impact | Low, limited physical footprint |
| Geopolitical Risk | Moderate, global supply chains | Moderate, government contracts |
In synthesis, QUBT carries higher market risk due to its elevated beta and early-stage operational challenges, despite low debt levels and minimal environmental risk. Dell, while more stable, faces moderate debt and operational complexity risks. Market volatility and regulatory environments remain the most impactful risks for both companies in 2026. Investors should weigh QUBT’s growth potential against its higher risk profile, whereas Dell offers a more balanced but moderately leveraged exposure.
Which Stock to Choose?
Dell Technologies Inc. shows a favorable income evolution with 8.08% revenue growth in 2025, strong profitability metrics except for a negative ROE of -3.1%, manageable debt levels, and a slightly favorable global financial ratios evaluation. Its MOAT is very favorable, indicating durable competitive advantage, supported by a moderate Altman Z-Score and a strong Piotroski score. The company holds a very favorable overall rating.
Quantum Computing, Inc. presents unfavorable income statement metrics including significant negative net margin and ROE, despite a high current ratio and low debt-to-assets. Its global financial ratios evaluation is unfavorable, and the MOAT status is slightly unfavorable, reflecting value destruction despite increasing profitability. The Altman Z-Score is in the safe zone but the Piotroski score is average. The company’s overall rating is also very favorable.
Investors focused on growth may find Quantum Computing’s substantial price appreciation and bullish long-term trend appealing, though its financials show high risk and volatility. Conversely, those prioritizing stability and quality might see Dell’s consistent income growth, value-creating MOAT, and stronger financial health as more favorable indicators. The choice could depend on the investor’s risk tolerance and strategic focus.
Disclaimer: Investment carries a risk of loss of initial capital. The past performance is not a reliable indicator of future results. Be sure to understand risks before making an investment decision.
Go Further
I encourage you to read the complete analyses of Dell Technologies Inc. and Quantum Computing, Inc. to enhance your investment decisions: