In the fast-evolving world of computer hardware, Dell Technologies Inc. and Pure Storage, Inc. stand out as key players driving innovation and shaping the future of data management. Both companies operate in the technology sector, focusing on storage solutions, yet they differ in scale and strategic approach. This comparison explores their market presence, innovation strategies, and growth potential to help you decide which is the more compelling investment opportunity in 2026.

Table of contents
Companies Overview
I will begin the comparison between Dell Technologies Inc. and Pure Storage, Inc. by providing an overview of these two companies and their main differences.
Dell Overview
Dell Technologies Inc. designs, develops, manufactures, markets, sells, and supports IT solutions globally. Operating through Infrastructure Solutions Group, Client Solutions Group, and VMware segments, Dell offers a wide range of products including servers, storage, desktops, and cloud software. Founded in 1984 and headquartered in Round Rock, Texas, Dell holds a strong position in the computer hardware industry with a market cap of 80.2B USD.
Pure Storage Overview
Pure Storage, Inc. specializes in data storage technologies and services, providing products like FlashArray and FlashBlade for block and unstructured data workloads. It offers subscription-based storage and cloud-native data management solutions. Founded in 2009 and based in Mountain View, California, Pure Storage operates mainly in the computer hardware sector with a market cap of 24.7B USD, focusing on innovative flash storage solutions.
Key similarities and differences
Both companies operate in the computer hardware industry, focusing on storage solutions, but Dell has a broader IT portfolio including servers, desktops, and cloud infrastructure, while Pure Storage is more specialized in flash storage and data management services. Dell’s larger scale and diversified segments contrast with Pure Storage’s focus on innovative, subscription-based storage technology aimed at modern workloads.
Income Statement Comparison
This table presents a side-by-side comparison of key income statement metrics for Dell Technologies Inc. and Pure Storage, Inc. for the fiscal year 2025.

| Metric | Dell Technologies Inc. | Pure Storage, Inc. |
|---|---|---|
| Market Cap | 80.2B | 24.7B |
| Revenue | 95.6B | 3.2B |
| EBITDA | 9.6B | 282M |
| EBIT | 6.5B | 156M |
| Net Income | 4.6B | 107M |
| EPS | 6.51 | 0.33 |
| Fiscal Year | 2025 | 2025 |
Income Statement Interpretations
Dell Technologies Inc.
Dell showed steady revenue growth from 2021 to 2025, increasing from $86.7B to $95.6B, with net income rising notably from $3.24B to $4.59B. Gross margins remained stable around 22%, while net margin exhibited moderate improvement. In 2025, revenue growth slowed somewhat to 8.1%, but net margin growth accelerated, reflecting improved profitability and operational efficiency.
Pure Storage, Inc.
Pure Storage experienced rapid growth, with revenue climbing from $1.68B in 2021 to $3.17B in 2025 and net income turning positive after initial losses, reaching $107M in 2025. Gross margins stayed high near 70%, while net margins improved significantly from negative to positive territory. The latest year showed an 11.9% revenue increase and strong margin expansion, highlighting operational leverage gains.
Which one has the stronger fundamentals?
Both companies demonstrate favorable income statement fundamentals, with Pure Storage exhibiting higher growth rates and margin improvements, albeit from a smaller base. Dell’s scale and consistent profitability provide stability, with solid margin control and sustained earnings growth. Pure Storage’s rapid expansion contrasts with Dell’s steadier performance, making their fundamentals strong but distinct in nature.
Financial Ratios Comparison
The table below presents the most recent key financial ratios for Dell Technologies Inc. and Pure Storage, Inc., providing a clear side-by-side comparison for fiscal year 2025.
| Ratios | Dell Technologies Inc. | Pure Storage, Inc. |
|---|---|---|
| ROE | -3.10% | 8.17% |
| ROIC | 14.71% | 2.45% |
| P/E | 15.7 | 206.9 |
| P/B | -48.7 | 16.9 |
| Current Ratio | 0.78 | 1.61 |
| Quick Ratio | 0.63 | 1.58 |
| D/E | -16.6 | 0.22 |
| Debt-to-Assets | 30.8% | 7.1% |
| Interest Coverage | 4.41 | 10.91 |
| Asset Turnover | 1.20 | 0.80 |
| Fixed Asset Turnover | 15.1 | 5.21 |
| Payout ratio | 27.8% | 0% |
| Dividend yield | 1.77% | 0% |
Interpretation of the Ratios
Dell Technologies Inc.
Dell presents a mix of strong and weak financial ratios, with a slightly favorable overall assessment. Its return on invested capital at 14.71% and asset turnover metrics are positive, while net margin and return on equity show weaknesses. The company pays dividends with a 1.77% yield, reflecting moderate shareholder returns and balanced payout risk.
Pure Storage, Inc.
Pure Storage exhibits a neutral ratio profile with significant concerns in profitability metrics such as net margin, ROIC, and an elevated P/E of 206.9. Liquidity and leverage ratios are favorable, supporting operational stability. The company does not pay dividends, focusing resources on growth and R&D, with no dividend yield reported.
Which one has the best ratios?
Dell holds a slightly favorable rating due to its balanced strengths in capital efficiency and shareholder returns despite some profitability weaknesses. Pure Storage’s ratios are neutral, constrained by high valuation and lower profitability, though it benefits from strong liquidity and low leverage. Overall, Dell’s financial ratios appear more robust.
Strategic Positioning
This section compares the strategic positioning of Dell Technologies Inc. and Pure Storage, Inc. across Market position, Key segments, and Exposure to technological disruption:
Dell Technologies Inc.
- Large market cap of 80B with established NYSE listing; faces competitive pressure in IT hardware.
- Diverse segments: Infrastructure, Client Solutions, VMware; driven by IT infrastructure and cloud services.
- Operates in traditional and next-gen storage, cloud software, and hybrid cloud environments, adapting to IT infrastructure changes.
Pure Storage, Inc.
- Smaller market cap of 24.7B; competes primarily in enterprise data storage technology.
- Focused on data storage products and services including FlashArray and AI-ready infrastructure.
- Relies on innovative storage tech and software solutions, including Kubernetes data management, facing disruption risks.
Dell vs Pure Storage Positioning
Dell employs a diversified business model across hardware and cloud software, benefiting from scale but facing broad competition. Pure Storage concentrates on advanced data storage solutions, offering specialization but with narrower market scope and higher disruption exposure.
Which has the best competitive advantage?
Dell demonstrates a very favorable moat with ROIC exceeding WACC by 6.57%, indicating durable value creation and increasing profitability. Pure Storage shows a slightly unfavorable moat, shedding value despite improving ROIC trends.
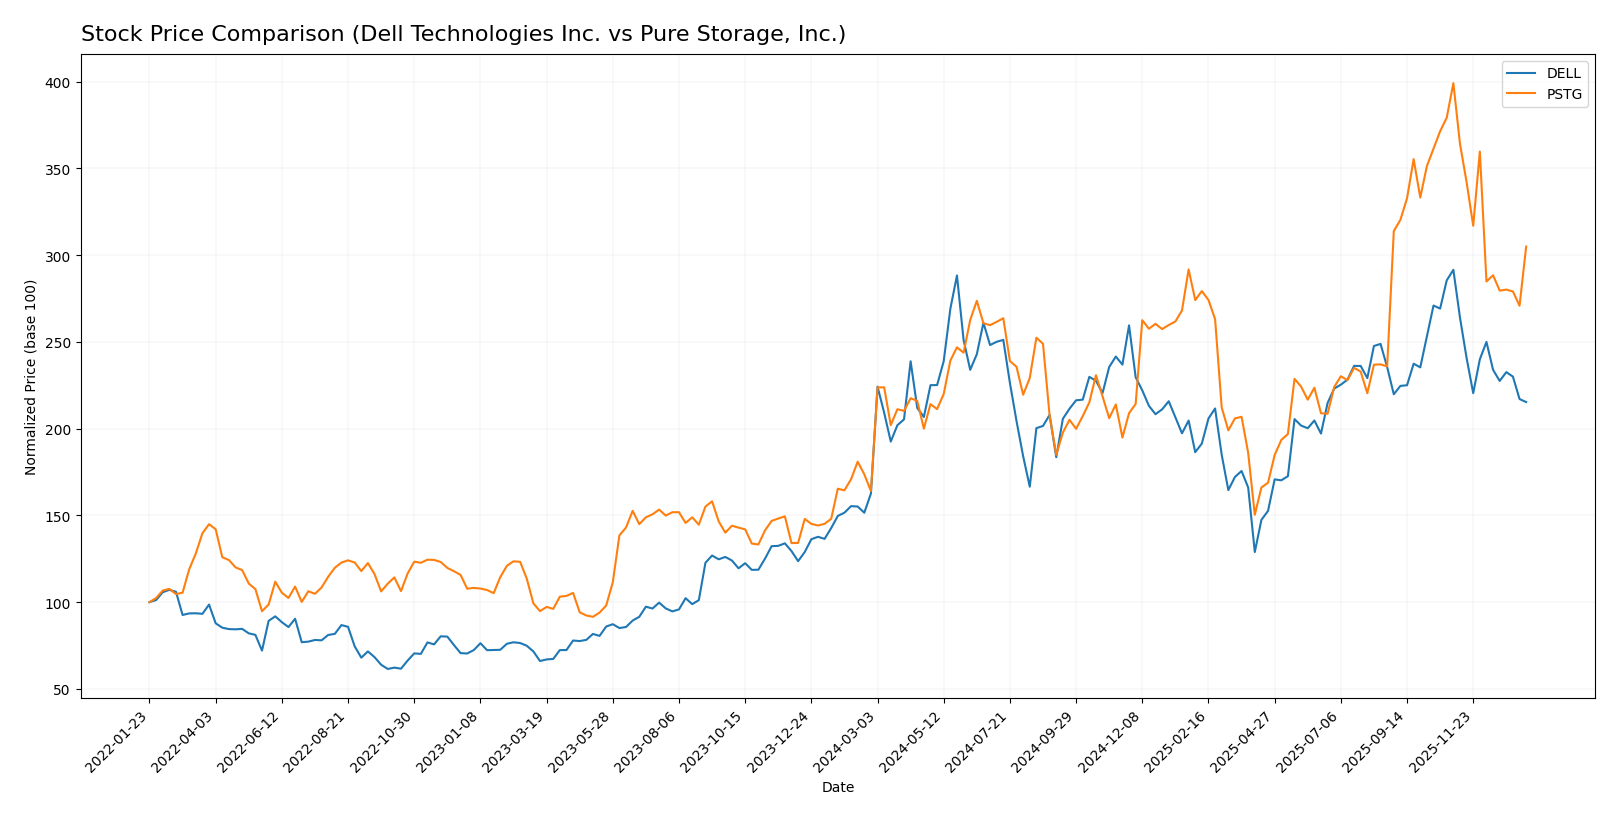
Stock Comparison
The past year showed significant bullish trends for both Dell Technologies Inc. and Pure Storage, Inc., with notable price appreciations followed by recent decelerations and seller dominance in trading volumes.
Trend Analysis
Dell Technologies Inc. exhibited a bullish trend over the past 12 months with a 32.44% price increase, though the upward momentum has decelerated. The stock reached a high of 162.01 and a low of 71.63, with a recent decline of 26.14% from November 2025 to January 2026.
Pure Storage, Inc. experienced a stronger bullish trend with an 85.88% price increase over the last 12 months but also showed deceleration. Its price ranged from 37.18 to 98.7. Recently, the stock declined 23.6% during the same November to January period.
Comparing both stocks, Pure Storage delivered the highest market performance with an 85.88% gain over the past year, outperforming Dell’s 32.44% increase despite similar recent downward trends.
Target Prices
Analysts present a clear target price consensus for both Dell Technologies Inc. and Pure Storage, Inc.
| Company | Target High | Target Low | Consensus |
|---|---|---|---|
| Dell Technologies Inc. | 200 | 113 | 163.83 |
| Pure Storage, Inc. | 105 | 60 | 91.15 |
The target prices suggest that analysts are generally optimistic about both stocks, with consensus targets well above current prices of $119.7 for Dell and $75.41 for Pure Storage. This indicates potential upside but requires cautious monitoring of market conditions.
Analyst Opinions Comparison
This section compares analysts’ ratings and grades for Dell Technologies Inc. and Pure Storage, Inc.:
Rating Comparison
Dell Technologies Inc. Rating
- Rating: C+, considered Very Favorable overall.
- Discounted Cash Flow Score: 3, Moderate status.
- ROE Score: 1, Very Unfavorable status.
- ROA Score: 4, Favorable status.
- Debt To Equity Score: 1, Very Unfavorable status.
- Overall Score: 2, Moderate status.
Pure Storage, Inc. Rating
- Rating: B-, considered Very Favorable overall.
- Discounted Cash Flow Score: 3, Moderate status.
- ROE Score: 3, Moderate status.
- ROA Score: 3, Moderate status.
- Debt To Equity Score: 3, Moderate status.
- Overall Score: 2, Moderate status.
Which one is the best rated?
Pure Storage holds a higher rating (B-) compared to Dell’s C+, with better scores in Return on Equity, Return on Assets, and Debt to Equity. Both share similar overall and discounted cash flow scores.
Scores Comparison
Here is a comparison of the Altman Z-Score and Piotroski Score for Dell Technologies Inc. and Pure Storage, Inc.:
Dell Scores
- Altman Z-Score: 1.93, in the grey zone indicating moderate bankruptcy risk.
- Piotroski Score: 7, considered strong financial health.
Pure Storage Scores
- Altman Z-Score: 5.91, in the safe zone indicating low bankruptcy risk.
- Piotroski Score: 5, considered average financial health.
Which company has the best scores?
Pure Storage has a significantly higher Altman Z-Score, placing it in the safe zone, while Dell is in the grey zone. However, Dell’s Piotroski Score is stronger than Pure Storage’s, indicating better overall financial health by that measure.
Grades Comparison
Here is a comparison of the recent grades assigned to Dell Technologies Inc. and Pure Storage, Inc.:
Dell Technologies Inc. Grades
The following table summarizes recent grades from recognized grading companies for Dell Technologies Inc.:
| Grading Company | Action | New Grade | Date |
|---|---|---|---|
| Mizuho | Maintain | Outperform | 2025-11-26 |
| B of A Securities | Maintain | Buy | 2025-11-26 |
| Morgan Stanley | Maintain | Underweight | 2025-11-26 |
| UBS | Maintain | Buy | 2025-11-26 |
| Barclays | Maintain | Equal Weight | 2025-11-26 |
| B of A Securities | Maintain | Buy | 2025-11-20 |
| JP Morgan | Maintain | Overweight | 2025-11-17 |
| Morgan Stanley | Downgrade | Underweight | 2025-11-17 |
| Raymond James | Maintain | Outperform | 2025-10-21 |
| Argus Research | Maintain | Buy | 2025-10-09 |
Dell shows a mixed rating trend, with several “Buy” and “Outperform” grades countered by a notable “Underweight” downgrade from Morgan Stanley.
Pure Storage, Inc. Grades
The following table summarizes recent grades from recognized grading companies for Pure Storage, Inc.:
| Grading Company | Action | New Grade | Date |
|---|---|---|---|
| UBS | Maintain | Sell | 2025-12-03 |
| Barclays | Maintain | Equal Weight | 2025-12-03 |
| Needham | Maintain | Buy | 2025-12-03 |
| Susquehanna | Downgrade | Neutral | 2025-12-03 |
| JP Morgan | Maintain | Overweight | 2025-12-03 |
| Citigroup | Maintain | Buy | 2025-12-03 |
| Wedbush | Maintain | Outperform | 2025-12-03 |
| Lake Street | Maintain | Buy | 2025-12-03 |
| JP Morgan | Maintain | Overweight | 2025-11-17 |
| Morgan Stanley | Maintain | Equal Weight | 2025-11-17 |
Pure Storage’s grades predominantly show “Buy,” “Outperform,” and “Overweight” recommendations, though UBS maintains a “Sell” rating and Susquehanna downgraded to “Neutral.”
Which company has the best grades?
Both companies have a consensus “Buy” rating, but Pure Storage has a higher proportion of “Buy” and “Outperform” grades, whereas Dell’s ratings are more mixed with significant underweight and equal weight opinions. This divergence may influence investors differently regarding growth expectations and risk tolerance.
Strengths and Weaknesses
Below is a comparison of Dell Technologies Inc. and Pure Storage, Inc. based on their recent performance across key criteria:
| Criterion | Dell Technologies Inc. | Pure Storage, Inc. |
|---|---|---|
| Diversification | Highly diversified with Client Solutions, Infrastructure Solutions, and Other Segments generating $91.9B in 2025 | Less diversified, mainly focused on Product and Service segments totaling $3.17B in 2025 |
| Profitability | Favorable ROIC (14.7%) but low net margin (4.81%) and negative ROE (-309.85%) | Lower ROIC (2.45%) and net margin (3.37%), with modest ROE (8.17%) |
| Innovation | Steady investment in infrastructure and client solutions; high fixed asset turnover (15.08) | Focus on storage innovation, improving profitability but still shedding value overall |
| Global presence | Strong global footprint with broad product offerings | Growing presence but smaller scale and market share |
| Market Share | Large market share in enterprise IT and client solutions | Niche player in storage solutions with growing but limited market share |
Key takeaways: Dell demonstrates a durable competitive advantage with strong diversification and efficient capital use, despite some profitability challenges. Pure Storage shows improving profitability and innovation but remains a smaller, less diversified player currently shedding value. Investors should weigh Dell’s scale and stability against Pure Storage’s growth potential and risks.
Risk Analysis
Below is a risk comparison table for Dell Technologies Inc. and Pure Storage, Inc. based on the most recent data from 2025.
| Metric | Dell Technologies Inc. | Pure Storage, Inc. |
|---|---|---|
| Market Risk | Beta 1.112, moderate volatility | Beta 1.264, higher volatility |
| Debt level | Debt-to-assets 30.81%, moderate leverage | Debt-to-assets 7.09%, low leverage |
| Regulatory Risk | Moderate, US tech sector exposure | Moderate, US tech sector exposure |
| Operational Risk | Large scale operations, complexity with VMware segment | Smaller scale, focused on storage tech innovation |
| Environmental Risk | Moderate, typical for hardware manufacturers | Moderate, focus on sustainable storage solutions |
| Geopolitical Risk | US-based but global supply chains exposure | US-based with international sales, supply chain sensitive |
Dell shows moderate market risk and leverage, with some operational complexity due to its diversified segments, while Pure Storage has higher market volatility but lower debt. Both face regulatory and geopolitical risks typical of global tech hardware firms.
The most impactful risk for Dell is its operational complexity and moderate leverage, which could affect profitability amid market shifts. Pure Storage’s higher market volatility and valuation metrics signal market sentiment risk, despite its strong balance sheet and safe Altman Z-score. Investors should monitor debt levels and market conditions closely for both.
Which Stock to Choose?
Dell Technologies Inc. shows a favorable income evolution with 78.57% positive income statement indicators and a slightly favorable global ratios evaluation at 35.71%. Despite a negative return on equity of -309.85%, it maintains a strong ROIC of 14.71% and manageable debt levels, supported by a very favorable C+ rating and a very favorable moat indicating durable competitive advantage.
Pure Storage, Inc. exhibits a strong income growth profile with 85.71% favorable income statement metrics and a neutral global ratios evaluation balanced between favorable and unfavorable at 42.86%. It has positive return on equity of 8.17% but a modest ROIC of 2.45%, low debt ratios, and a very favorable B- rating, yet its moat is slightly unfavorable, reflecting value destruction despite improving profitability.
Investors seeking durable competitive advantage and value creation might find Dell’s profile more aligned with quality and stability investing, while those prioritizing high growth and improving profitability could interpret Pure Storage’s metrics as more suited to growth-oriented strategies, considering their respective ratings and financial fundamentals.
Disclaimer: Investment carries a risk of loss of initial capital. The past performance is not a reliable indicator of future results. Be sure to understand risks before making an investment decision.
Go Further
I encourage you to read the complete analyses of Dell Technologies Inc. and Pure Storage, Inc. to enhance your investment decisions: