In the fast-evolving world of computer hardware and IT solutions, Dell Technologies Inc. and NetApp, Inc. stand out as key players with overlapping market focus and innovative strategies. Both companies lead in storage and cloud infrastructure, driving digital transformation for businesses globally. This article will analyze their strengths and risks to help you decide which stock deserves a place in your investment portfolio. Let’s explore which company offers the most compelling opportunity for investors today.

Table of contents
Companies Overview
I will begin the comparison between Dell Technologies Inc. and NetApp, Inc. by providing an overview of these two companies and their main differences.
Dell Overview
Dell Technologies Inc. designs, develops, manufactures, markets, sells, and supports IT solutions, products, and services worldwide. The company operates through three segments: Infrastructure Solutions Group, Client Solutions Group, and VMware, offering a broad range of computing hardware, storage, networking, cloud software, and support services. Founded in 1984 and headquartered in Round Rock, Texas, Dell is a major player in the computer hardware industry with a market cap of $80.2B.
NetApp Overview
NetApp, Inc. provides cloud-led and data-centric services to manage and share data across on-premises and cloud environments globally. The company operates two segments, Hybrid Cloud and Public Cloud, offering intelligent data management software and storage infrastructure solutions. Founded in 1992 and headquartered in San Jose, California, NetApp focuses on cloud storage and data services, with a market cap of $21.4B in the technology sector.
Key similarities and differences
Both Dell and NetApp operate in the computer hardware industry, targeting enterprise customers with IT infrastructure solutions. Dell’s business model covers a wider product range including client devices and virtualization through VMware, while NetApp specializes more narrowly in data management and cloud storage software and services. Dell has a significantly larger workforce and market capitalization, indicating a broader scale of operations compared to NetApp’s focused cloud-centric offerings.
Income Statement Comparison
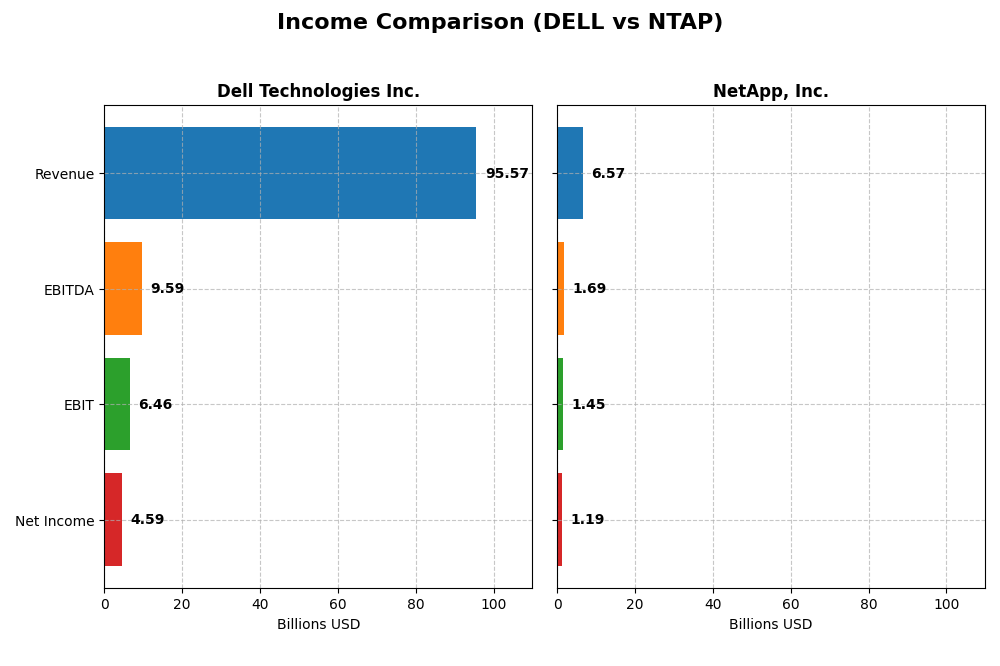
Below is a side-by-side comparison of the most recent fiscal year income statement metrics for Dell Technologies Inc. and NetApp, Inc.
| Metric | Dell Technologies Inc. | NetApp, Inc. |
|---|---|---|
| Market Cap | 80.2B | 21.4B |
| Revenue | 95.6B | 6.57B |
| EBITDA | 9.59B | 1.69B |
| EBIT | 6.46B | 1.45B |
| Net Income | 4.59B | 1.19B |
| EPS | 6.51 | 5.81 |
| Fiscal Year | 2025 | 2025 |
Income Statement Interpretations
Dell Technologies Inc.
Dell demonstrated consistent revenue growth over 2021-2025, rising from $86.7B to $95.6B in 2025, with net income increasing substantially from $3.2B to $4.6B. Gross margins remained relatively stable around 22%, while net margins showed moderate improvement. In 2025, revenue growth accelerated by 8.1%, EBIT margin was neutral at 6.8%, and net income growth was favorable at 25.4%, reflecting solid operational execution.
NetApp, Inc.
NetApp’s revenue grew steadily from $5.7B in 2021 to $6.6B in 2025, with net income rising from $730M to $1.2B. Gross margin improved favorably to 70.2%, and EBIT margin reached 22%, indicating strong profitability. The company posted a moderate 4.9% revenue growth in 2025, with net margin growth at 14.7% and EPS growth at 22.5%, signaling efficient cost control and margin expansion.
Which one has the stronger fundamentals?
Both companies show favorable income statement trends, but NetApp exhibits higher profitability margins and stronger net margin growth over the period. Dell has larger scale and solid revenue growth with stable margins but lower EBIT and net margin percentages. Overall, NetApp’s superior margin profile and consistent earnings expansion suggest stronger income statement fundamentals.
Financial Ratios Comparison
The table below presents a side-by-side comparison of key financial ratios for Dell Technologies Inc. and NetApp, Inc. based on their most recent fiscal year data available.
| Ratios | Dell Technologies Inc. (2025) | NetApp, Inc. (2025) |
|---|---|---|
| ROE | -3.10% | 1.14% |
| ROIC | 14.7% | 16.5% |
| P/E | 15.7 | 15.4 |
| P/B | -48.7 | 17.6 |
| Current Ratio | 0.78 | 1.26 |
| Quick Ratio | 0.63 | 1.22 |
| D/E | -16.6 | 3.36 |
| Debt-to-Assets | 30.8% | 32.3% |
| Interest Coverage | 4.41 | 20.9 |
| Asset Turnover | 1.20 | 0.61 |
| Fixed Asset Turnover | 15.1 | 8.17 |
| Payout Ratio | 27.8% | 35.8% |
| Dividend Yield | 1.77% | 2.32% |
Interpretation of the Ratios
Dell Technologies Inc.
Dell shows mixed financial ratios in 2025 with favorable returns on invested capital (14.7%) and asset turnover but unfavorable net margin (4.81%) and negative return on equity (-310%). Liquidity ratios like current (0.78) and quick ratio (0.63) are below 1, indicating potential short-term risk. Dell pays dividends with a 1.77% yield, suggesting moderate shareholder returns supported by cautious payout levels.
NetApp, Inc.
NetApp displays generally strong ratios in 2025, including a solid net margin of 18.05%, high return on equity (114%), and favorable interest coverage (22.61), though its price-to-book ratio of 17.6 is unfavorable. Liquidity ratios are adequate, with a quick ratio of 1.22. The company pays dividends with a 2.32% yield, reflecting consistent shareholder returns backed by robust cash flow metrics.
Which one has the best ratios?
Both companies have slightly favorable overall ratio profiles, but NetApp outperforms Dell in profitability and liquidity metrics, with fewer unfavorable ratios. Dell’s negative return on equity and weak liquidity contrast with NetApp’s stronger margins and coverage ratios. However, Dell benefits from better asset turnover and debt metrics, making the comparison balanced but leaning toward NetApp for operational efficiency.
Strategic Positioning
This section compares the strategic positioning of Dell Technologies Inc. and NetApp, Inc., focusing on Market position, Key segments, and Exposure to technological disruption:
Dell Technologies Inc.
- Large market cap (~80B USD) with diversified products in IT hardware and software, facing competitive pressure in multiple segments.
- Operates in three segments: Infrastructure Solutions, Client Solutions, and VMware, driving revenues from hardware, software, and services.
- Invests in hybrid and multi-cloud IT solutions, including cloud software and infrastructure-as-a-service, adapting to digital transformation trends.
NetApp, Inc.
- Smaller market cap (~21B USD) focusing on cloud-led and data-centric services, facing competition in cloud and storage markets.
- Operates two main segments: Hybrid Cloud and Public Cloud, emphasizing intelligent data management and cloud storage solutions.
- Focused on cloud data services and software innovations to manage data across on-premises and cloud environments, addressing cloud disruption.
Dell Technologies Inc. vs NetApp, Inc. Positioning
Dell presents a diversified approach with broad IT hardware and software segments, enabling multiple revenue streams. NetApp concentrates on cloud and data management services, offering specialized solutions but with narrower market scope. Dell’s scale contrasts with NetApp’s focused innovation.
Which has the best competitive advantage?
Both companies demonstrate a very favorable moat with growing ROIC above WACC, indicating durable competitive advantages. Dell shows stronger ROIC growth, while NetApp maintains efficient capital use, suggesting both sustain profitability through distinct strategic strengths.
Stock Comparison
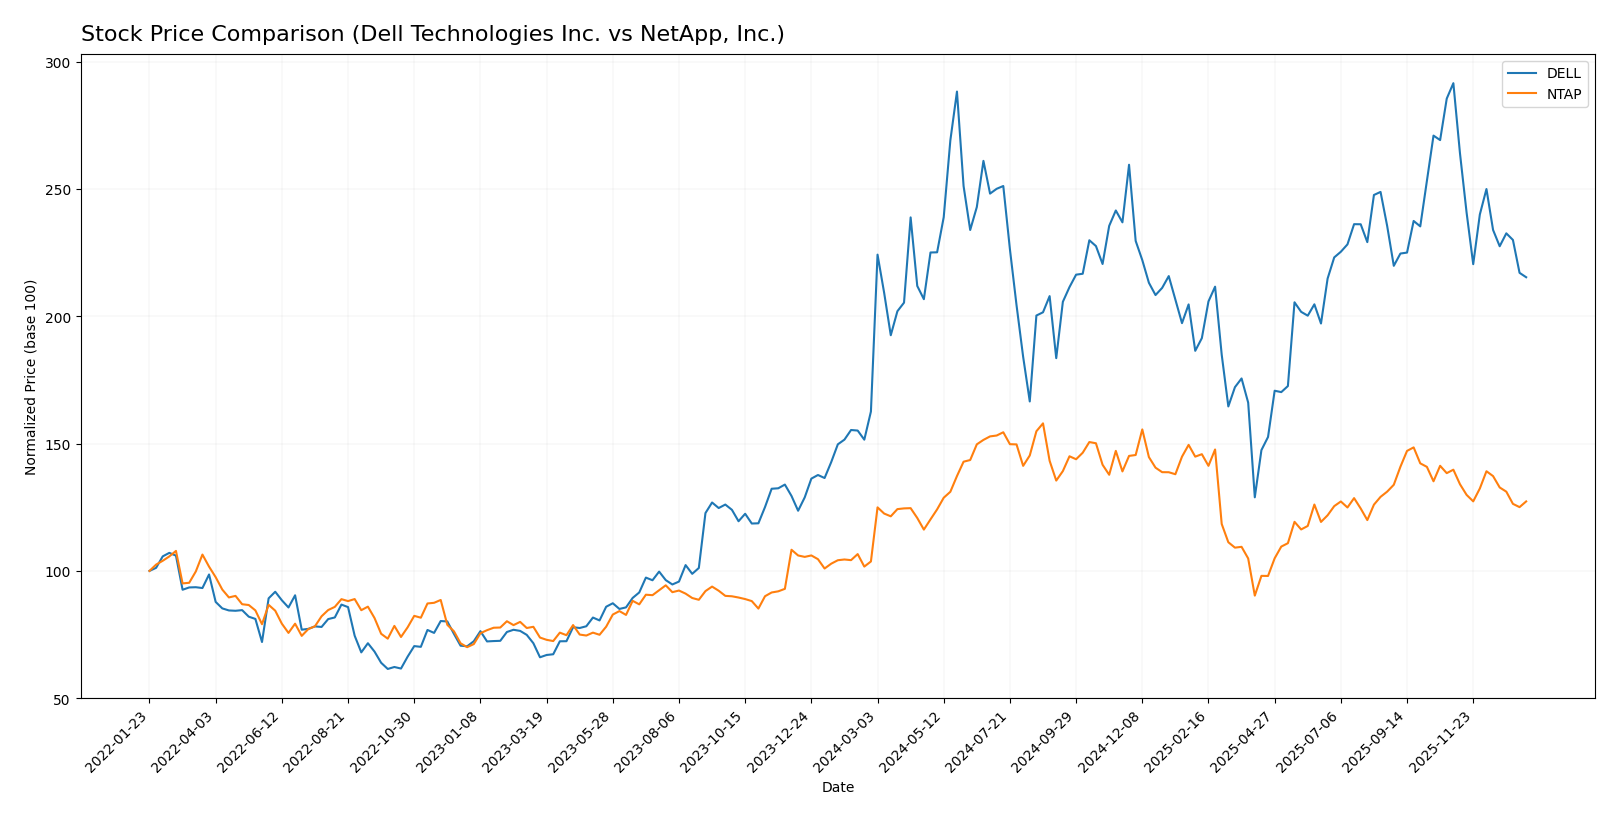
The stock price movements of Dell Technologies Inc. and NetApp, Inc. over the past year reveal notable bullish trends with decelerating momentum and recent downward corrections, reflecting evolving trading dynamics and volume shifts.
Trend Analysis
Dell Technologies Inc. exhibited a bullish trend with a 32.44% price increase over the past 12 months, though momentum decelerated. The stock showed high volatility (std deviation 16.95) and recent decline of -26.14% from November 2025 to January 2026.
NetApp, Inc. also showed a bullish trend with a 22.75% increase over 12 months and decelerating acceleration. Volatility was moderate (std deviation 12.21) and recent correction was milder at -8.91% in the same recent period.
Comparatively, Dell outperformed NetApp in annual market performance with a higher overall price gain despite experiencing a sharper recent decline.
Target Prices
The current analyst consensus reflects optimistic expectations for both Dell Technologies Inc. and NetApp, Inc.
| Company | Target High | Target Low | Consensus |
|---|---|---|---|
| Dell Technologies Inc. | 200 | 113 | 163.83 |
| NetApp, Inc. | 137 | 115 | 125.17 |
Analysts expect Dell’s stock to rise significantly from its current price of $119.7, with a consensus target around $164, indicating strong upside potential. NetApp’s target consensus of $125.17 also suggests moderate appreciation above its current price of $107.28.
Analyst Opinions Comparison
This section compares analysts’ ratings and grades for Dell Technologies Inc. and NetApp, Inc.:
Rating Comparison
Dell Technologies Inc. Rating
- Rating: C+ indicating a very favorable overall evaluation.
- Discounted Cash Flow Score: Moderate at 3, suggesting fair value.
- ROE Score: Very unfavorable at 1, reflecting low profitability.
- ROA Score: Favorable at 4, indicating good asset utilization.
- Debt To Equity Score: Very unfavorable at 1, indicating high financial risk.
- Overall Score: Moderate at 2, suggesting average financial standing.
NetApp, Inc. Rating
- Rating: B+ indicating a very favorable overall evaluation.
- Discounted Cash Flow Score: Favorable at 4, suggesting undervaluation.
- ROE Score: Very favorable at 5, showing strong profitability.
- ROA Score: Very favorable at 5, showing excellent asset use.
- Debt To Equity Score: Very unfavorable at 1, indicating high financial risk.
- Overall Score: Moderate at 3, suggesting somewhat better financial standing.
Which one is the best rated?
NetApp holds a higher rating (B+) than Dell (C+), with superior scores in discounted cash flow, ROE, ROA, and overall financial standing. Both share similarly unfavorable debt-to-equity scores.
Scores Comparison
Here is a comparison of the financial scores for Dell Technologies Inc. and NetApp, Inc.:
DELL Scores
- Altman Z-Score: 1.93, indicating moderate bankruptcy risk in the grey zone.
- Piotroski Score: 7, reflecting strong financial health and value potential.
NTAP Scores
- Altman Z-Score: 2.86, indicating moderate bankruptcy risk in the grey zone.
- Piotroski Score: 7, reflecting strong financial health and value potential.
Which company has the best scores?
Both Dell and NetApp have Piotroski Scores of 7, indicating strong financial health. NetApp’s higher Altman Z-Score (2.86) suggests slightly lower bankruptcy risk than Dell’s 1.93, both remaining in the grey zone.
Grades Comparison
Here is a detailed comparison of the recent grades assigned to Dell Technologies Inc. and NetApp, Inc.:
Dell Technologies Inc. Grades
This table summarizes recent grades and recommendations from major grading firms for Dell Technologies Inc.:
| Grading Company | Action | New Grade | Date |
|---|---|---|---|
| Mizuho | Maintain | Outperform | 2025-11-26 |
| B of A Securities | Maintain | Buy | 2025-11-26 |
| Morgan Stanley | Maintain | Underweight | 2025-11-26 |
| UBS | Maintain | Buy | 2025-11-26 |
| Barclays | Maintain | Equal Weight | 2025-11-26 |
| B of A Securities | Maintain | Buy | 2025-11-20 |
| JP Morgan | Maintain | Overweight | 2025-11-17 |
| Morgan Stanley | Downgrade | Underweight | 2025-11-17 |
| Raymond James | Maintain | Outperform | 2025-10-21 |
| Argus Research | Maintain | Buy | 2025-10-09 |
Overall, Dell’s grades show a diverse range, with strong buy and outperform ratings balanced against a few underweight notes, indicating mixed analyst sentiment.
NetApp, Inc. Grades
This table details recent grades and recommendations from recognized grading firms for NetApp, Inc.:
| Grading Company | Action | New Grade | Date |
|---|---|---|---|
| Barclays | Maintain | Overweight | 2025-11-26 |
| Wells Fargo | Maintain | Equal Weight | 2025-11-26 |
| Northland Capital Markets | Upgrade | Outperform | 2025-11-26 |
| B of A Securities | Maintain | Neutral | 2025-11-26 |
| UBS | Maintain | Neutral | 2025-11-26 |
| Citigroup | Maintain | Neutral | 2025-11-12 |
| Citigroup | Maintain | Neutral | 2025-10-16 |
| Argus Research | Maintain | Buy | 2025-08-29 |
| UBS | Maintain | Neutral | 2025-08-28 |
| Barclays | Maintain | Overweight | 2025-08-28 |
NetApp’s grades predominantly cluster around neutral and overweight, with a recent upgrade to outperform, suggesting cautious optimism among analysts.
Which company has the best grades?
Dell Technologies receives generally more positive ratings, including multiple buy and outperform grades, while NetApp mostly holds neutral to overweight ratings with fewer strong buy signals. This difference could imply stronger analyst confidence in Dell’s near-term performance potential.
Strengths and Weaknesses
Below is a comparative overview of key strengths and weaknesses for Dell Technologies Inc. and NetApp, Inc. based on their recent financial and strategic metrics.
| Criterion | Dell Technologies Inc. | NetApp, Inc. |
|---|---|---|
| Diversification | Highly diversified with strong segments in Client Solutions ($48.9B in 2024) and Infrastructure Solutions ($33.9B) | More focused, primarily on Hybrid Cloud ($5.9B in 2025) and Public Cloud ($0.7B) segments |
| Profitability | Moderate net margin at 4.81%, ROIC favorable at 14.7%, but negative ROE (-310%) signals concerns | Strong profitability with 18.05% net margin, ROE at 114%, and ROIC at 16.5% |
| Innovation | Demonstrates durable competitive advantage with a growing ROIC trend (+217%) | Also shows durable moat with a growing ROIC trend (+25.6%) but less pronounced than Dell |
| Global presence | Extensive global operations across multiple segments | Global reach mainly in cloud storage and services, smaller scale than Dell |
| Market Share | Large market share in enterprise IT solutions and client hardware | Niche market leader in cloud data services, smaller but growing market share |
Key takeaways: Dell offers broad diversification and a robust competitive advantage with rapid ROIC growth, though profitability margins need attention. NetApp excels in profitability and shows a steady competitive moat, benefiting from focus on cloud storage solutions. Investors should weigh Dell’s scale and innovation against NetApp’s stronger margins and focused market niche.
Risk Analysis
Below is a comparative risk assessment for Dell Technologies Inc. and NetApp, Inc. based on the most recent financial data from 2025.
| Metric | Dell Technologies Inc. | NetApp, Inc. |
|---|---|---|
| Market Risk | Beta 1.11, moderate volatility | Beta 1.37, higher volatility |
| Debt Level | Debt-to-assets 30.8%, moderate leverage | Debt-to-assets 32.3%, similar leverage |
| Regulatory Risk | Moderate, US-based with global operations | Moderate, US-based with global cloud services |
| Operational Risk | Large scale, complex segments, risk in integration | Focused on cloud and data services, risk in tech innovation |
| Environmental Risk | Moderate, hardware manufacturing impacts | Moderate, cloud infrastructure energy use |
| Geopolitical Risk | Exposure to global supply chains and trade tensions | Exposure to global cloud markets and regulatory environments |
The most impactful risks for both companies stem from market volatility and leverage levels. NetApp’s higher beta indicates greater sensitivity to market swings, while Dell’s complex operational structure poses integration and execution risks. Both face moderate regulatory and environmental challenges given their global technology footprints. Investors should monitor debt management and global geopolitical developments closely.
Which Stock to Choose?
Dell Technologies Inc. shows favorable income evolution with 78.57% favorable income statement indicators, including 8.08% revenue growth in 2025 and improving profitability. Its financial ratios are slightly favorable despite some unfavorable metrics like negative ROE and weak liquidity. The company carries moderate debt with a strong debt-to-equity ratio and holds a very favorable rating of C+.
NetApp, Inc. presents a robust income profile with 85.71% favorable income metrics, highlighting a 14.42% revenue growth over the period and strong profitability ratios, including an 18.05% net margin. Its financial ratios are slightly favorable, marked by strong returns on equity and assets, though burdened by higher debt levels. The company enjoys a very favorable B+ rating.
For investors, NetApp may appear more attractive for those prioritizing growth and profitability given its stronger income and ratio profiles, while Dell could be interpreted as suitable for investors seeking value with its moderate debt and improving income. Both display very favorable moats with durable competitive advantages, indicating efficient capital use.
Disclaimer: Investment carries a risk of loss of initial capital. The past performance is not a reliable indicator of future results. Be sure to understand risks before making an investment decision.
Go Further
I encourage you to read the complete analyses of Dell Technologies Inc. and NetApp, Inc. to enhance your investment decisions: