In the fast-evolving technology landscape, Dell Technologies Inc. and IonQ, Inc. represent two intriguing investment opportunities. Dell is a well-established leader in computer hardware and IT infrastructure, while IonQ pioneers quantum computing innovation, offering a glimpse into the future of technology. Both operate in the technology sector but target distinctly different market segments. This article will guide you through their strengths to identify which company might be the best fit for your investment portfolio.
Table of contents
Companies Overview
I will begin the comparison between Dell Technologies Inc. and IonQ, Inc. by providing an overview of these two companies and their main differences.
Dell Technologies Inc. Overview
Dell Technologies Inc. designs, develops, manufactures, markets, sells, and supports IT solutions and products worldwide. It operates through three segments: Infrastructure Solutions Group, Client Solutions Group, and VMware. These segments provide traditional and next-generation storage, servers, desktops, notebooks, networking products, cloud software, and infrastructure services. Founded in 1984 and headquartered in Round Rock, Texas, Dell is a major player in the computer hardware industry.
IonQ, Inc. Overview
IonQ, Inc. develops general-purpose quantum computing systems and sells access to quantum computers with 20 qubits. The company offers cloud access through platforms like AWS, Microsoft Azure, and Google Cloud Marketplace, as well as its own service. Founded in 2015 and based in College Park, Maryland, IonQ focuses on pioneering quantum computing technology within the computer hardware sector.
Key similarities and differences
Both Dell and IonQ operate in the technology sector focusing on computer hardware, but their business models differ significantly. Dell offers a broad range of IT infrastructure and client solutions with established hardware and software services, while IonQ specializes in emerging quantum computing accessed mainly via cloud platforms. Dell’s workforce and market capitalization are substantially larger, reflecting its established market presence compared to IonQ’s newer, specialized technology focus.
Income Statement Comparison
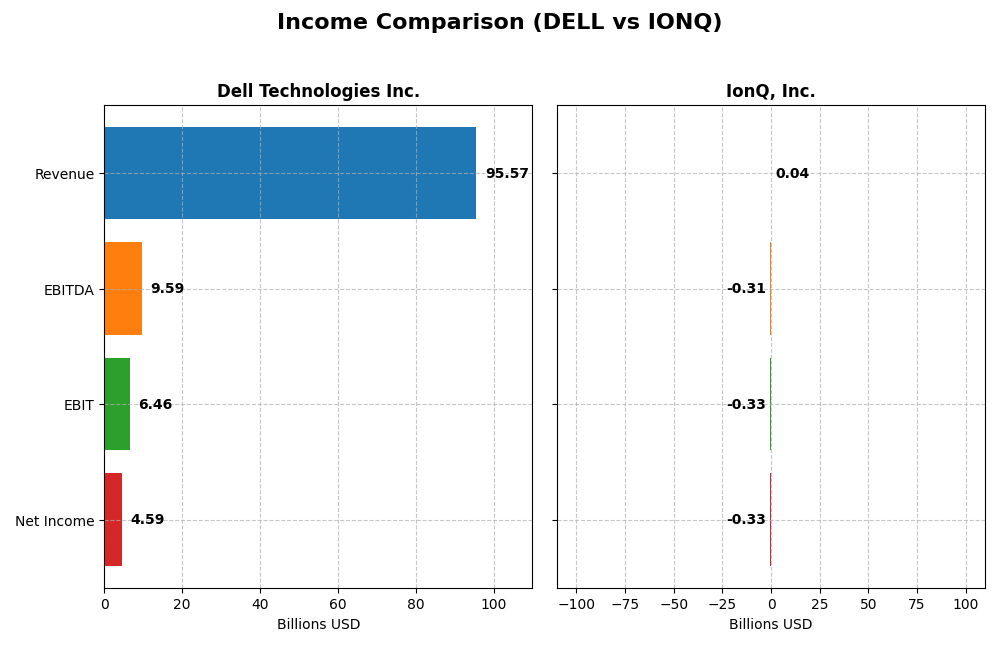
Below is a side-by-side comparison of key income statement metrics for Dell Technologies Inc. and IonQ, Inc. for their most recent fiscal years.
| Metric | Dell Technologies Inc. | IonQ, Inc. |
|---|---|---|
| Market Cap | 80.2B | 17.3B |
| Revenue | 95.6B | 43.1M |
| EBITDA | 9.59B | -313M |
| EBIT | 6.46B | -332M |
| Net Income | 4.59B | -332M |
| EPS | 6.51 | -1.56 |
| Fiscal Year | 2025 | 2024 |
Income Statement Interpretations
Dell Technologies Inc.
Dell’s revenue trended upward from $86.7B in 2021 to $95.6B in 2025, with net income increasing from $3.24B to $4.59B in the same period. Gross margins remained stable around 22%, while net margins showed a favorable growth to 4.8% in 2025. The latest fiscal year highlighted solid revenue growth of 8.1% and a 25.4% increase in net margin, reflecting improved profitability.
IonQ, Inc.
IonQ’s revenue rose sharply from $2.1M in 2021 to $43.1M in 2024, yet net income remained negative, worsening from -$106M to -$331M. Gross margin showed neutral status at 8.9%, but EBIT and net margins were severely negative, indicating ongoing operational losses. The most recent year showed favorable revenue growth of 95.4%, though net margin and EPS deteriorated further, pointing to continued financial challenges.
Which one has the stronger fundamentals?
Dell exhibits stronger fundamentals with consistent revenue and net income growth, favorable margin improvements, and positive earnings per share trends. In contrast, IonQ’s rapid revenue gains are overshadowed by persistent and deepening net losses, negative margins, and unfavorable overall income statement evaluations. Dell’s financials present a more stable and favorable income profile compared to IonQ’s unfavorable trajectory.
Financial Ratios Comparison
The table below presents a side-by-side comparison of key financial ratios for Dell Technologies Inc. and IonQ, Inc. based on their most recent fiscal year data.
| Ratios | Dell Technologies Inc. (2025) | IonQ, Inc. (2024) |
|---|---|---|
| ROE | -3.10% | -86.40% |
| ROIC | 14.71% | -48.55% |
| P/E | 15.71 | -26.83 |
| P/B | -48.66 | 23.18 |
| Current Ratio | 0.78 | 10.50 |
| Quick Ratio | 0.63 | 9.98 |
| D/E | -16.58 | 0.05 |
| Debt-to-Assets | 30.81% | 3.49% |
| Interest Coverage | 4.41 | 0 |
| Asset Turnover | 1.20 | 0.08 |
| Fixed Asset Turnover | 15.08 | 0.69 |
| Payout ratio | 27.77% | 0% |
| Dividend yield | 1.77% | 0% |
Interpretation of the Ratios
Dell Technologies Inc.
Dell shows mixed financial ratios: favorable returns on invested capital (14.71%) and strong asset turnover (1.2) contrast with unfavorable net margin (4.81%) and negative return on equity (-309.85%). Liquidity ratios are weak with a current ratio of 0.78. Dividend yield is moderate at 1.77%, indicating steady shareholder returns with a balanced payout approach and manageable distribution risks.
IonQ, Inc.
IonQ’s financial ratios are largely unfavorable, reflecting its status as a high-growth, early-stage company. It posts negative margins (-769.96%) and returns on capital, with a very high weighted average cost of capital (16.14%). The company does not pay dividends, focusing on reinvestment and R&D, which aligns with its quantum computing development phase. Liquidity is high but asset turnover is very low.
Which one has the best ratios?
Dell’s ratios are slightly favorable, marked by solid operational efficiency and moderate dividend yield, despite some profitability concerns. IonQ’s ratios are predominantly unfavorable, reflecting its nascent stage and substantial losses. Based solely on these metrics, Dell presents a more stable financial profile, while IonQ remains a riskier, early development play.
Strategic Positioning
This section compares the strategic positioning of Dell Technologies Inc. and IonQ, Inc., including market position, key segments, and exposure to technological disruption:
Dell Technologies Inc.
- Large market cap of 80B in computer hardware with moderate beta of 1.11; faces established competition.
- Diversified revenue streams: Client Solutions, Infrastructure Solutions, VMware, and other segments totaling over 90B.
- Operates in traditional IT infrastructure and cloud services, facing gradual technology shifts.
IonQ, Inc.
- Smaller market cap of 17B with volatile beta of 2.63; emerging quantum computing market.
- Focused on quantum computing systems with cloud-based access to 20 qubit computers.
- Positioned in disruptive quantum computing technology with potential for paradigm shifts.
Dell vs IonQ Positioning
Dell follows a diversified technology approach spanning hardware and cloud solutions, offering stability and broad market exposure. IonQ concentrates on advanced quantum computing, targeting a niche yet transformative sector with higher volatility and growth uncertainty.
Which has the best competitive advantage?
Dell demonstrates a very favorable moat with strong ROIC growth and value creation, indicating durable competitive advantage. IonQ shows a very unfavorable moat with declining ROIC, reflecting value destruction and weaker competitive positioning.
Stock Comparison
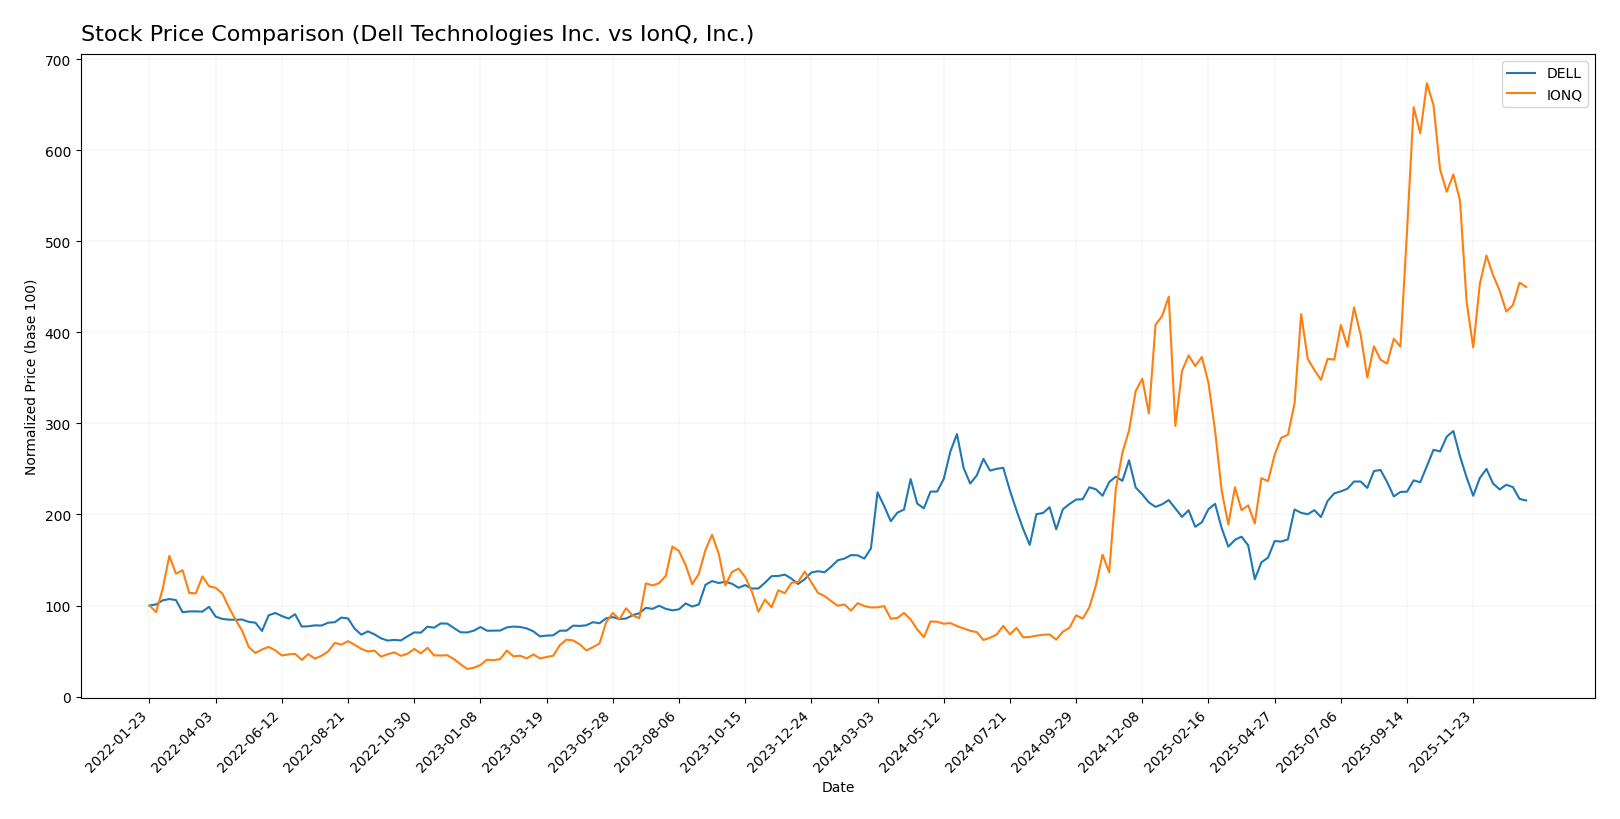
The stock price movements of Dell Technologies Inc. and IonQ, Inc. over the past year reveal significant gains followed by a recent decline, reflecting dynamic trading patterns in both companies’ shares.
Trend Analysis
Dell Technologies Inc. showed a bullish trend over the past 12 months with a 32.44% price increase, though the trend has decelerated. Recently, it experienced a 26.14% decline, indicating a bearish short-term movement. The stock exhibited high volatility with a standard deviation of 16.95.
IonQ, Inc. delivered a strong bullish trend with a 359.53% gain over the year, also decelerating. In the recent period, IonQ’s stock fell 21.55%, showing bearish momentum. Its price volatility was slightly higher, with an 18.7 standard deviation.
Comparing both stocks, IonQ outperformed Dell with the highest market gain over the past year, despite both showing recent bearish corrections.
Target Prices
The current analyst consensus shows promising upside potential for both Dell Technologies Inc. and IonQ, Inc.
| Company | Target High | Target Low | Consensus |
|---|---|---|---|
| Dell Technologies Inc. | 200 | 113 | 163.83 |
| IonQ, Inc. | 100 | 55 | 72.57 |
Analysts expect Dell’s stock to appreciate significantly from its current price of $119.7, while IonQ’s consensus target suggests a strong potential increase from its current $48.94 share price.
Analyst Opinions Comparison
This section compares analysts’ ratings and grades for Dell Technologies Inc. and IonQ, Inc.:
Rating Comparison
Dell Technologies Inc. Rating
- Rating: C+, classified as Very Favorable by analysts.
- Discounted Cash Flow Score: 3, indicating a Moderate status.
- ROE Score: 1, rated Very Unfavorable for profitability.
- ROA Score: 4, suggesting Favorable asset utilization.
- Debt To Equity Score: 1, indicating Very Unfavorable risk.
- Overall Score: 2, Moderate overall financial standing.
IonQ, Inc. Rating
- Rating: C-, also considered Very Favorable.
- Discounted Cash Flow Score: 1, classified as Very Unfavorable.
- ROE Score: 1, also Very Unfavorable.
- ROA Score: 1, marked Very Unfavorable.
- Debt To Equity Score: 4, showing a Favorable financial risk profile.
- Overall Score: 1, Very Unfavorable overall financial standing.
Which one is the best rated?
Dell holds a higher overall rating (C+) and scores better on discounted cash flow and return on assets, while IonQ’s strengths lie in its favorable debt-to-equity score. Overall, Dell is better rated based on the provided scores.
Scores Comparison
The following table compares the Altman Z-Score and Piotroski Score of Dell Technologies Inc. and IonQ, Inc.:
Dell Scores
- Altman Z-Score: 1.93, in the grey zone indicating moderate bankruptcy risk.
- Piotroski Score: 7, considered strong financial health.
IonQ Scores
- Altman Z-Score: 3.67, in the safe zone indicating low bankruptcy risk.
- Piotroski Score: 2, considered very weak financial health.
Which company has the best scores?
IonQ has a higher Altman Z-Score indicating lower bankruptcy risk, but Dell’s Piotroski Score is significantly stronger, showing better overall financial health. The scores reflect different strengths for each company.
Grades Comparison
Here is a comparison of the recent grades assigned to Dell Technologies Inc. and IonQ, Inc.:
Dell Technologies Inc. Grades
The following table summarizes recent grades from reputable grading companies for Dell Technologies Inc.:
| Grading Company | Action | New Grade | Date |
|---|---|---|---|
| Mizuho | Maintain | Outperform | 2025-11-26 |
| B of A Securities | Maintain | Buy | 2025-11-26 |
| Morgan Stanley | Maintain | Underweight | 2025-11-26 |
| UBS | Maintain | Buy | 2025-11-26 |
| Barclays | Maintain | Equal Weight | 2025-11-26 |
| B of A Securities | Maintain | Buy | 2025-11-20 |
| JP Morgan | Maintain | Overweight | 2025-11-17 |
| Morgan Stanley | Downgrade | Underweight | 2025-11-17 |
| Raymond James | Maintain | Outperform | 2025-10-21 |
| Argus Research | Maintain | Buy | 2025-10-09 |
Overall, Dell’s grades show a predominance of Buy and Outperform ratings, though Morgan Stanley’s recent downgrade to Underweight introduces some caution.
IonQ, Inc. Grades
Below are recent grades from recognized grading companies for IonQ, Inc.:
| Grading Company | Action | New Grade | Date |
|---|---|---|---|
| Benchmark | Maintain | Buy | 2024-08-12 |
| Goldman Sachs | Maintain | Neutral | 2024-08-09 |
| Craig-Hallum | Maintain | Buy | 2024-08-08 |
| Needham | Maintain | Buy | 2024-05-16 |
| Needham | Maintain | Buy | 2024-05-09 |
| Goldman Sachs | Maintain | Neutral | 2024-02-29 |
| Needham | Maintain | Buy | 2024-02-29 |
| Morgan Stanley | Maintain | Equal Weight | 2023-10-30 |
| Needham | Maintain | Buy | 2023-09-20 |
| Needham | Maintain | Buy | 2023-09-19 |
IonQ’s grades predominantly show Buy ratings with some Neutral and Equal Weight ratings, indicating a generally positive but more cautious outlook.
Which company has the best grades?
Dell Technologies Inc. has received a higher number of Buy and Outperform grades from a broader range of grading companies, whereas IonQ, Inc. has mostly Buy and Neutral ratings. This difference suggests Dell is viewed more favorably by analysts, potentially reflecting stronger confidence among investors.
Strengths and Weaknesses
The table below compares key strengths and weaknesses of Dell Technologies Inc. and IonQ, Inc. based on their most recent financial and strategic data.
| Criterion | Dell Technologies Inc. | IonQ, Inc. |
|---|---|---|
| Diversification | Highly diversified across client solutions and infrastructure segments with $91.9B in other segments (2025). | Limited diversification; focused primarily on quantum computing technology. |
| Profitability | Creating value with favorable ROIC at 14.7%, but mixed margins and negative ROE indicate some profitability challenges. | Negative profitability metrics with declining ROIC (-48.55%) and net margin (-770%), value destruction ongoing. |
| Innovation | Consistent investment in infrastructure and client solutions, moderate innovation pace. | Strong innovation potential in quantum computing, but yet to translate into financial stability. |
| Global presence | Established global footprint with broad market reach. | Emerging global presence; still building market access. |
| Market Share | Large market share in IT hardware and solutions sectors. | Niche player in quantum computing with minimal market share currently. |
Dell’s strengths lie in its diversified revenue streams and solid capital efficiency, though profitability ratios show room for improvement. IonQ shows promise in innovation but suffers from poor financial health and value destruction risks. Investors should weigh Dell’s stability against IonQ’s high-risk, high-reward profile.
Risk Analysis
Below is a comparative risk assessment table for Dell Technologies Inc. (DELL) and IonQ, Inc. (IONQ) based on the latest available data for 2025 and 2024 respectively:
| Metric | Dell Technologies Inc. (DELL) | IonQ, Inc. (IONQ) |
|---|---|---|
| Market Risk | Moderate (Beta 1.11) | High (Beta 2.63) |
| Debt Level | Moderate (Debt to Assets 30.8%) | Low (Debt to Assets 3.5%) |
| Regulatory Risk | Moderate (Tech industry, global operations) | High (Quantum tech is emerging, regulatory uncertainties) |
| Operational Risk | Moderate (Large, complex operations with 108K employees) | High (Small size, 407 employees, scaling challenges) |
| Environmental Risk | Moderate (Tech manufacturing impacts) | Low (Cloud-based quantum computing) |
| Geopolitical Risk | Moderate (Global supply chains) | Moderate (US-based with international cloud dependencies) |
The most impactful risks are IonQ’s high market volatility and operational scaling challenges, reflecting its emerging quantum computing market and small size. Dell faces moderate market and debt risks but benefits from a diversified, large-scale operation. Investors should weigh IonQ’s growth potential against its financial instability and Dell’s steadier but slower growth profile.
Which Stock to Choose?
Dell Technologies Inc. has shown a favorable income evolution with revenue growth of 8.08% in the last year and positive net margin growth of 25.41%. Its financial ratios are slightly favorable overall, supported by a strong ROIC of 14.7% exceeding its WACC. However, Dell’s return on equity is negative at -310%, and its current and quick ratios are unfavorable, indicating liquidity challenges. The company holds a very favorable rating (C+) and demonstrates a durable competitive advantage with increasing profitability.
IonQ, Inc. exhibits a contrasting profile with unfavorable income statement trends, including a negative net margin of -770% and declining profitability metrics over the recent period. Its financial ratios are mostly unfavorable, reflecting weak operational efficiency and high expenses relative to revenue. Despite a high current ratio at 10.5, other indicators such as ROIC and EBITDA margins are deeply negative. IonQ holds a very favorable rating (C-) but suffers from declining profitability and is considered a value destroyer with a very unfavorable moat status.
For investors, Dell’s stable income growth, positive ROIC exceeding WACC, and slightly favorable financial ratios might appear more attractive for those prioritizing quality and value investing. Conversely, IonQ’s profile could be more aligned with risk-tolerant investors seeking high growth potential despite substantial financial headwinds and negative profitability indicators. The decision could depend largely on the investor’s risk appetite and investment strategy focus.
Disclaimer: Investment carries a risk of loss of initial capital. The past performance is not a reliable indicator of future results. Be sure to understand risks before making an investment decision.
Go Further
I encourage you to read the complete analyses of Dell Technologies Inc. and IonQ, Inc. to enhance your investment decisions: