In the competitive landscape of computer hardware, Dell Technologies Inc. and HP Inc. stand out as two of the most influential players. Both companies offer a broad range of IT solutions, from personal computing devices to enterprise infrastructure, with strong innovation strategies focused on modernizing technology for businesses and consumers alike. This analysis will help investors determine which company presents the most compelling opportunity for their portfolio in 2026.
Table of contents
Companies Overview
I will begin the comparison between Dell Technologies Inc. and HP Inc. by providing an overview of these two companies and their main differences.
Dell Overview
Dell Technologies Inc. designs, develops, manufactures, markets, sells, and supports IT solutions, products, and services globally. Operating through Infrastructure Solutions Group, Client Solutions Group, and VMware segments, Dell offers storage, servers, desktops, notebooks, cloud software, and security solutions. Founded in 1984 and headquartered in Round Rock, Texas, Dell is a major player in computer hardware with a market cap of approximately 80.2B USD.
HP Overview
HP Inc. provides personal computing devices, imaging, printing products, and related technologies worldwide. Its segments include Personal Systems, Printing, and Corporate Investments, serving individual consumers, businesses, and government sectors. Founded in 1939 and based in Palo Alto, California, HP has a market cap near 19.7B USD and is known for its diverse hardware portfolio, including printers and commercial mobility devices.
Key similarities and differences
Both Dell and HP operate in the computer hardware industry with a focus on personal computing products. Dell’s business model integrates IT infrastructure, cloud, and hybrid solutions, while HP emphasizes printing technology alongside personal systems. Dell’s larger scale and diversified segments contrast with HP’s concentration on consumer and commercial devices, reflecting distinct approaches within the technology sector.
Income Statement Comparison
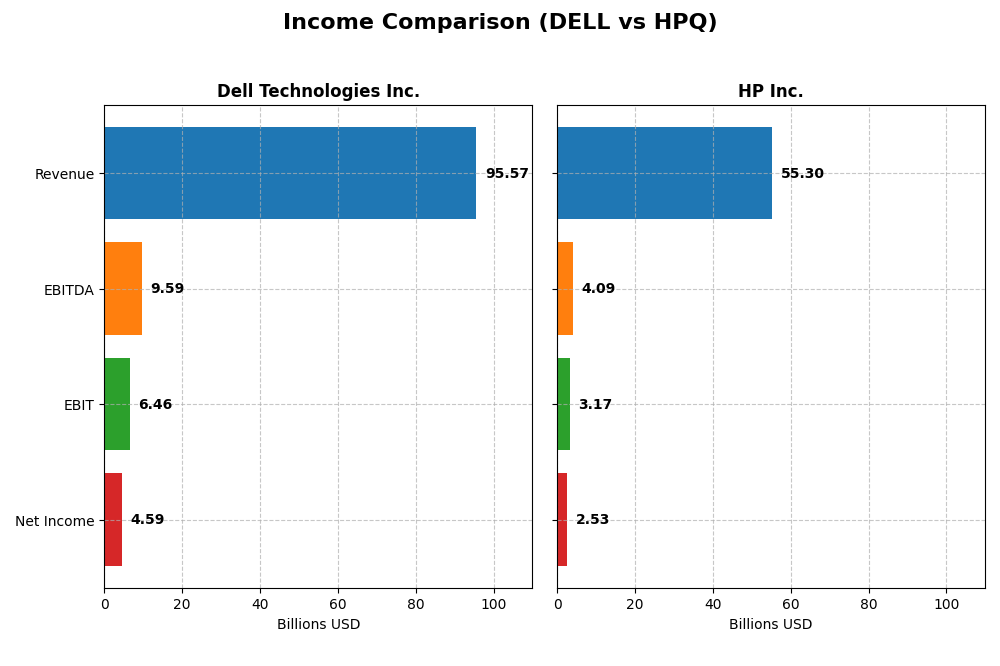
The table below presents a side-by-side comparison of key income statement metrics for Dell Technologies Inc. and HP Inc. based on their most recent fiscal year results.
| Metric | Dell Technologies Inc. | HP Inc. |
|---|---|---|
| Market Cap | 80.2B | 19.7B |
| Revenue | 95.6B | 55.3B |
| EBITDA | 9.6B | 4.1B |
| EBIT | 6.5B | 3.2B |
| Net Income | 4.6B | 2.5B |
| EPS | 6.51 | 2.67 |
| Fiscal Year | 2025 | 2025 |
Income Statement Interpretations
Dell Technologies Inc.
Dell has shown an overall favorable trend from 2021 to 2025, with revenue growing by 10.27% and net income increasing by 41.29%. Gross margin is stable at 22.24%, while EBIT and net margins remain neutral. In 2025, revenue grew by 8.08%, EBIT by 15.64%, and net margin improved by 25.41%, indicating strengthened profitability and operational efficiency.
HP Inc.
HP experienced a decline in revenue and net income over the 2021-2025 period, with revenues falling by 12.87% and net income dropping 61.34%. Margins remained mostly neutral, with a gross margin near 19.98% and EBIT margin at 5.74%. The 2025 fiscal year showed a modest 3.24% revenue increase but decreases in gross profit (-6.52%) and net margin (-11.73%), reflecting challenges in margin preservation.
Which one has the stronger fundamentals?
Dell demonstrates stronger fundamentals with favorable revenue and net income growth, improving margins, and operational gains. HP’s financials show unfavorable trends with declining revenues, shrinking net income, and margin contractions. Dell’s performance suggests more robust income statement health, whereas HP faces ongoing profitability pressures and weaker growth metrics.
Financial Ratios Comparison
The following table presents a side-by-side comparison of key financial ratios for Dell Technologies Inc. and HP Inc., based on their most recent fiscal year data.
| Ratios | Dell Technologies Inc. (2025) | HP Inc. (2025) |
|---|---|---|
| ROE | -3.10% | -7.31% |
| ROIC | 14.71% | 24.97% |
| P/E | 15.71 | 10.35 |
| P/B | -48.66 | -75.65 |
| Current Ratio | 0.78 | 0.77 |
| Quick Ratio | 0.63 | 0.48 |
| D/E (Debt-to-Equity) | -16.58 | -31.45 |
| Debt-to-Assets | 30.81% | 26.05% |
| Interest Coverage | 4.41 | 7.16 |
| Asset Turnover | 1.20 | 1.32 |
| Fixed Asset Turnover | 15.08 | 13.23 |
| Payout Ratio | 27.77% | 43.02% |
| Dividend Yield | 1.77% | 4.16% |
Interpretation of the Ratios
Dell Technologies Inc.
Dell displays a slightly favorable ratio profile with strengths in ROIC (14.71%), asset turnover (1.2), and fixed asset turnover (15.08). However, concerns include a negative ROE (-309.85%), a low current ratio (0.78), and quick ratio (0.63), indicating liquidity risks. Its dividend yield stands at a neutral 1.77%, suggesting moderate shareholder returns without excessive payout pressure.
HP Inc.
HP exhibits a favorable ratio profile with robust ROIC (24.97%), WACC (7.6%), PE (10.35), and dividend yield (4.16%). Liquidity ratios are weak, with a current ratio of 0.77 and quick ratio of 0.48, posing some short-term risk. Negative ROE (-730.92%) is a concern, but the company’s solid returns and dividend payments indicate stable shareholder returns.
Which one has the best ratios?
HP shows a stronger overall ratio profile, with more favorable metrics across profitability, valuation, and dividend yield. Dell’s ratios are mixed, with some strengths offset by liquidity and profitability weaknesses. Both have unfavorable ROE and liquidity ratios, but HP’s higher proportion of favorable ratios and dividend yield suggest comparatively better financial health.
Strategic Positioning
This section compares the strategic positioning of Dell Technologies Inc. and HP Inc., including their market position, key segments, and exposure to technological disruption:
Dell Technologies Inc.
- Large market cap near 80B, facing competitive pressure in IT hardware and services.
- Diverse segments: Client Solutions, Infrastructure Solutions, and VMware cloud services.
- Invested in hybrid/multi-cloud, modern IT, and digital workspace technologies.
HP Inc.
- Smaller market cap around 20B, competing in personal computing and printing hardware.
- Focused on Personal Systems, Printing, and Corporate Investments segments.
- Primarily exposed to traditional computing and printing technologies with corporate investments.
Dell Technologies Inc. vs HP Inc. Positioning
Dell adopts a diversified technology approach across IT infrastructure and cloud services, offering broad business drivers. HP concentrates on personal computing and printing, limiting diversification but focusing on core hardware markets. Dell’s larger scale supports infrastructure innovation, while HP’s narrower focus may constrain growth avenues.
Which has the best competitive advantage?
Dell shows a very favorable moat with growing ROIC and durable competitive advantage, whereas HP’s moat is slightly favorable but with declining profitability, indicating Dell currently holds a stronger competitive advantage.
Stock Comparison
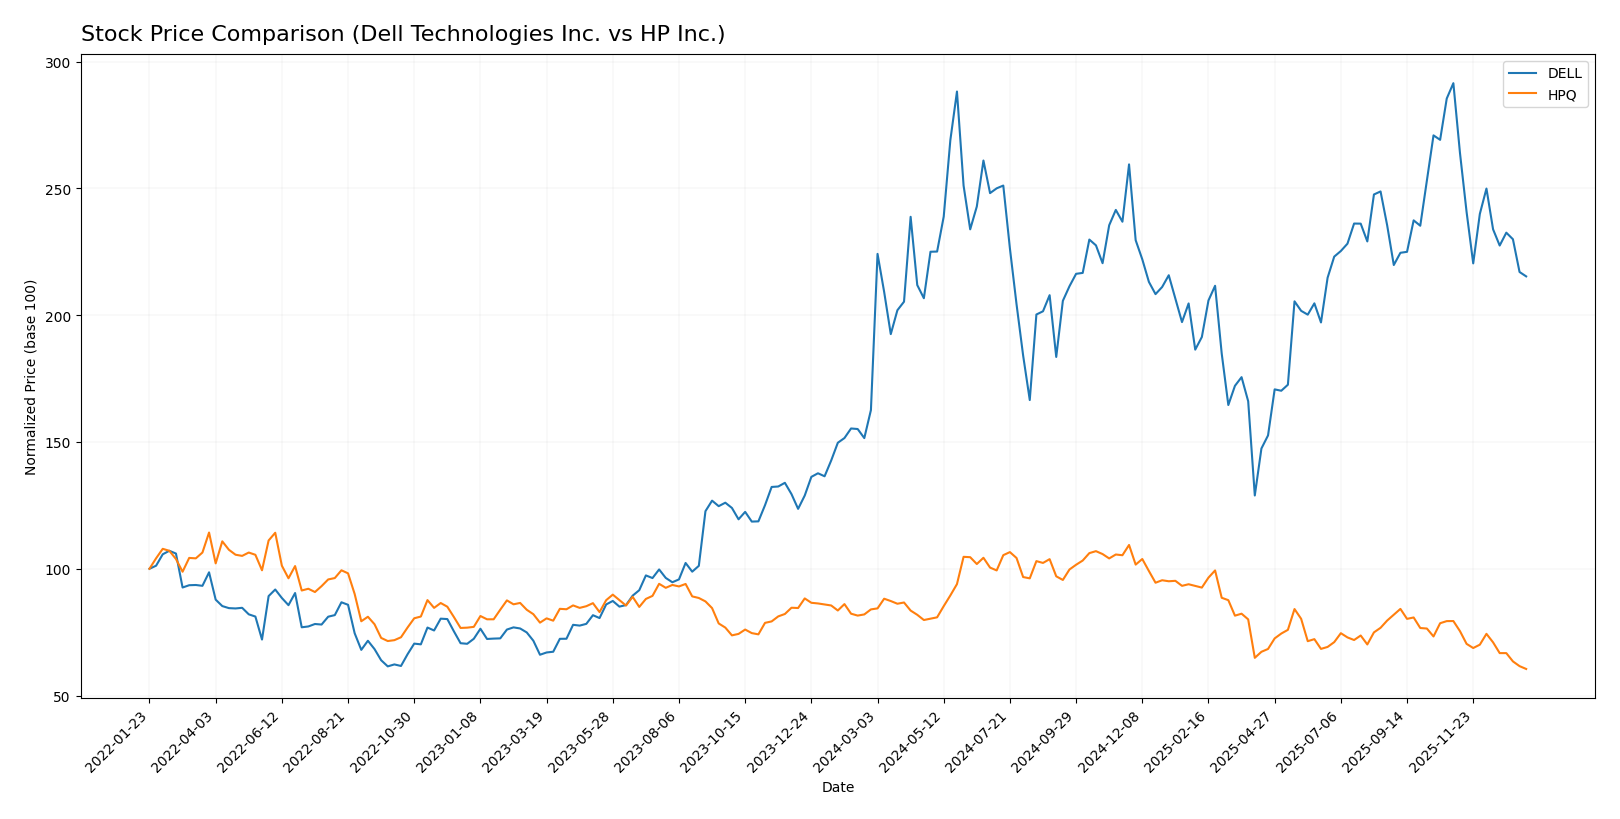
The past year reveals contrasting trading dynamics for Dell Technologies Inc. and HP Inc., with Dell showing a pronounced bullish trend despite recent deceleration, while HP exhibits a sustained bearish trend amid decreasing momentum.
Trend Analysis
Dell Technologies Inc. posted a strong bullish trend over the past 12 months with a 32.44% price increase, although the upward momentum has decelerated. The stock experienced notable volatility with a standard deviation of 16.95 and price extremes between 71.63 and 162.01.
HP Inc. faced a bearish trend over the same period, declining 27.98% with decelerating downside momentum. The stock showed lower volatility at 4.65 standard deviation, reaching highs of 38.13 and lows near 21.08.
Comparing the two, Dell delivered the highest market performance with a significant positive price change, contrasting with HP’s marked decline during the 12-month period.
Target Prices
Analysts present a clear target price consensus for Dell Technologies Inc. and HP Inc., indicating expected price ranges and averages.
| Company | Target High | Target Low | Consensus |
|---|---|---|---|
| Dell Technologies Inc. | 200 | 113 | 163.83 |
| HP Inc. | 30 | 20 | 24.8 |
The consensus target prices for Dell and HP suggest upside potential from current prices of $119.7 and $21.08 respectively, reflecting moderately bullish analyst expectations.
Analyst Opinions Comparison
This section compares analysts’ ratings and financial scores for Dell Technologies Inc. and HP Inc.:
Rating Comparison
Dell Technologies Inc. Rating
- Rating: C+, considered very favorable by analysts.
- Discounted Cash Flow Score: 3, indicating a moderate valuation outlook.
- ROE Score: 1, reflecting very unfavorable efficiency in equity use.
- ROA Score: 4, a favorable indicator of asset utilization.
- Debt To Equity Score: 1, indicating very unfavorable financial risk.
- Overall Score: 2, a moderate overall financial performance rating.
HP Inc. Rating
- Rating: B-, also considered very favorable by analysts.
- Discounted Cash Flow Score: 4, indicating a favorable valuation outlook.
- ROE Score: 1, reflecting very unfavorable efficiency in equity use.
- ROA Score: 4, a favorable indicator of asset utilization.
- Debt To Equity Score: 1, indicating very unfavorable financial risk.
- Overall Score: 2, a moderate overall financial performance rating.
Which one is the best rated?
Based strictly on the provided data, HP Inc. holds a better rating (B-) than Dell (C+), driven by a higher discounted cash flow score. Both companies share similar overall and risk-related scores.
Scores Comparison
Here is a comparison of the Altman Z-Score and Piotroski Score for Dell and HP:
Dell Scores
- Altman Z-Score: 1.93, in the grey zone indicating moderate bankruptcy risk.
- Piotroski Score: 7, rated as strong financial health.
HP Scores
- Altman Z-Score: 1.60, in the distress zone indicating higher bankruptcy risk.
- Piotroski Score: 6, rated as average financial health.
Which company has the best scores?
Dell has higher scores on both Altman Z-Score and Piotroski Score compared to HP. Dell is in the grey zone with strong financial health, while HP is in the distress zone with average financial health, based on the provided data.
Grades Comparison
The following presents a detailed comparison of the recent grades assigned to Dell Technologies Inc. and HP Inc.:
Dell Technologies Inc. Grades
This table summarizes recent analyst grades for Dell Technologies Inc. from reputable firms.
| Grading Company | Action | New Grade | Date |
|---|---|---|---|
| Mizuho | Maintain | Outperform | 2025-11-26 |
| B of A Securities | Maintain | Buy | 2025-11-26 |
| Morgan Stanley | Maintain | Underweight | 2025-11-26 |
| UBS | Maintain | Buy | 2025-11-26 |
| Barclays | Maintain | Equal Weight | 2025-11-26 |
| B of A Securities | Maintain | Buy | 2025-11-20 |
| JP Morgan | Maintain | Overweight | 2025-11-17 |
| Morgan Stanley | Downgrade | Underweight | 2025-11-17 |
| Raymond James | Maintain | Outperform | 2025-10-21 |
| Argus Research | Maintain | Buy | 2025-10-09 |
Overall, Dell’s grades show a mixed but generally positive trend, with several buy and outperform ratings balanced by some underweight and equal weight assessments.
HP Inc. Grades
The following table lists the recent analyst grades for HP Inc. from established grading firms.
| Grading Company | Action | New Grade | Date |
|---|---|---|---|
| Goldman Sachs | Maintain | Neutral | 2025-11-26 |
| Evercore ISI Group | Maintain | In Line | 2025-11-26 |
| Citigroup | Maintain | Neutral | 2025-11-26 |
| Morgan Stanley | Maintain | Underweight | 2025-11-26 |
| JP Morgan | Maintain | Neutral | 2025-11-26 |
| Barclays | Maintain | Equal Weight | 2025-11-26 |
| TD Cowen | Maintain | Hold | 2025-11-26 |
| UBS | Maintain | Neutral | 2025-11-26 |
| Morgan Stanley | Maintain | Underweight | 2025-11-21 |
| B of A Securities | Maintain | Neutral | 2025-11-21 |
HP’s grades predominantly reflect neutral to hold ratings, with no upgrades or downgrades, indicating a cautious consensus.
Which company has the best grades?
Dell Technologies Inc. has received more favorable grades, including multiple buy and outperform ratings, compared to HP Inc.’s mostly neutral and hold assessments. This suggests Dell is viewed with stronger growth or value potential by analysts, which may influence investor confidence and portfolio decisions.
Strengths and Weaknesses
The table below summarizes the main strengths and weaknesses of Dell Technologies Inc. and HP Inc., based on recent financial performance, market position, and innovation capacity.
| Criterion | Dell Technologies Inc. | HP Inc. |
|---|---|---|
| Diversification | Strong diversification with significant revenue from Client Solutions and Infrastructure Solutions Group | More concentrated in Personal Systems and Printing segments |
| Profitability | Moderate net margin (4.81%), favorable ROIC (14.71%) but negative ROE (-310%) | Slightly lower net margin (4.57%), higher ROIC (24.97%) but very negative ROE (-731%) |
| Innovation | Growing ROIC trend indicates improving operational efficiency and innovation | Declining ROIC trend suggests challenges in sustaining profitability |
| Global presence | Well-established global presence across multiple IT infrastructure markets | Strong global footprint but focused on fewer product lines |
| Market Share | Competitive in enterprise solutions and client devices | Leading position in personal systems and printing markets |
Key takeaways: Dell demonstrates a durable competitive advantage with growing profitability and a diversified business model, while HP maintains higher ROIC but faces profitability challenges with a declining trend. Dell’s broader portfolio offers better risk management, whereas HP’s focus may expose it to market fluctuations.
Risk Analysis
Below is a comparative overview of key risks facing Dell Technologies Inc. and HP Inc. as of 2025.
| Metric | Dell Technologies Inc. | HP Inc. |
|---|---|---|
| Market Risk | Beta 1.11, moderate volatility in tech hardware sector | Beta 1.22, slightly higher volatility and competitive pressure |
| Debt level | Debt-to-assets 30.8%, interest coverage 4.57, moderate leverage | Debt-to-assets 26.1%, interest coverage 6.27, lower leverage |
| Regulatory Risk | Moderate, subject to global IT and data security regulations | Moderate, similar exposure to IT and environmental regulations |
| Operational Risk | Large workforce (108K), complex multi-segment operations pose execution risks | Smaller workforce (58K), but diverse product lines increase operational complexity |
| Environmental Risk | Medium, increasing pressure to reduce carbon footprint across production | Medium, with notable printing segment environmental impact |
| Geopolitical Risk | Exposure to US-China tensions affecting supply chains | Similar exposure, with global manufacturing dependencies |
Dell and HP both face notable market volatility and operational complexity risks. Dell’s higher leverage and lower liquidity ratios warrant cautious monitoring. HP’s Altman Z-score in distress zone highlights bankruptcy risk concerns, while Dell remains in grey zone. Investors should weigh these financial and external risks carefully before investing.
Which Stock to Choose?
Dell Technologies Inc. shows favorable income growth with a 10.27% revenue increase over 2021–2025 and a 41.29% net income rise. Its profitability is mixed, with a 4.81% net margin rated neutral but a strong ROIC of 14.71%. Dell carries moderate debt levels, reflected by a net debt to EBITDA of 2.18 and a current ratio below 1. Its overall rating is very favorable (C+), supported by a very favorable moat indicating durable competitive advantage.
HP Inc. presents an unfavorable income trend, with negative growth in revenue (-12.87%) and net income (-61.34%) over the same period. Profitability metrics show a 4.57% net margin rated neutral but a higher ROIC of 24.97%. Its debt profile is relatively better with net debt to EBITDA at 1.76 and a current ratio under 1. The company holds a very favorable rating (B-) but a slightly favorable moat due to declining ROIC, signaling weakening profitability.
For investors prioritizing stable income growth and a durable competitive moat, Dell may appear more favorable given its strong income statement and very favorable moat status. Conversely, those focusing on companies with higher ROIC despite recent profitability declines might find HP’s profile more aligned, though its income and financial stability trends suggest caution. The choice could thus depend on one’s risk tolerance and investment strategy emphasis.
Disclaimer: Investment carries a risk of loss of initial capital. The past performance is not a reliable indicator of future results. Be sure to understand risks before making an investment decision.
Go Further
I encourage you to read the complete analyses of Dell Technologies Inc. and HP Inc. to enhance your investment decisions: