Home > Comparison > Industrials > DE vs PCAR
The strategic rivalry between Deere & Company and PACCAR Inc defines the current trajectory of the industrial machinery sector. Deere operates as a capital-intensive agricultural machinery powerhouse with diverse segments spanning production equipment to financial services. PACCAR focuses on commercial truck manufacturing with integrated parts and leasing operations, blending industrial scale with service margins. This analysis will clarify which firm’s operational model delivers a superior risk-adjusted return for diversified investors.
Table of contents
Companies Overview
Deere & Company and PACCAR Inc both command significant presence in the industrial machinery and commercial vehicle sectors.
Deere & Company: Global Agricultural Machinery Leader
Deere & Company dominates agricultural machinery with a diverse product range including tractors, combines, and turf equipment. Its revenue streams come from four segments: Production and Precision Agriculture, Small Agriculture and Turf, Construction and Forestry, and Financial Services. In 2026, Deere focused strategically on enhancing precision agriculture technologies and expanding its financial services arm to support equipment sales.
PACCAR Inc: Premium Commercial Truck Manufacturer
PACCAR Inc leads in commercial truck manufacturing, selling under Kenworth, Peterbilt, and DAF brands. Its core revenue derives from truck sales, aftermarket parts distribution, and financial services providing leasing and equipment financing. In 2026, PACCAR prioritized expanding its leasing operations and enhancing parts distribution networks globally to strengthen customer retention and service capabilities.
Strategic Collision: Similarities & Divergences
Both companies leverage strong financial services segments to support core equipment sales, yet Deere emphasizes precision agriculture and construction, while PACCAR focuses on heavy-duty trucking and parts. Their competition centers on capital goods financing and after-sales support in industrial markets. Deere’s diversified machinery portfolio contrasts with PACCAR’s focused truck ecosystem, offering distinct risk and growth profiles for investors.
Income Statement Comparison
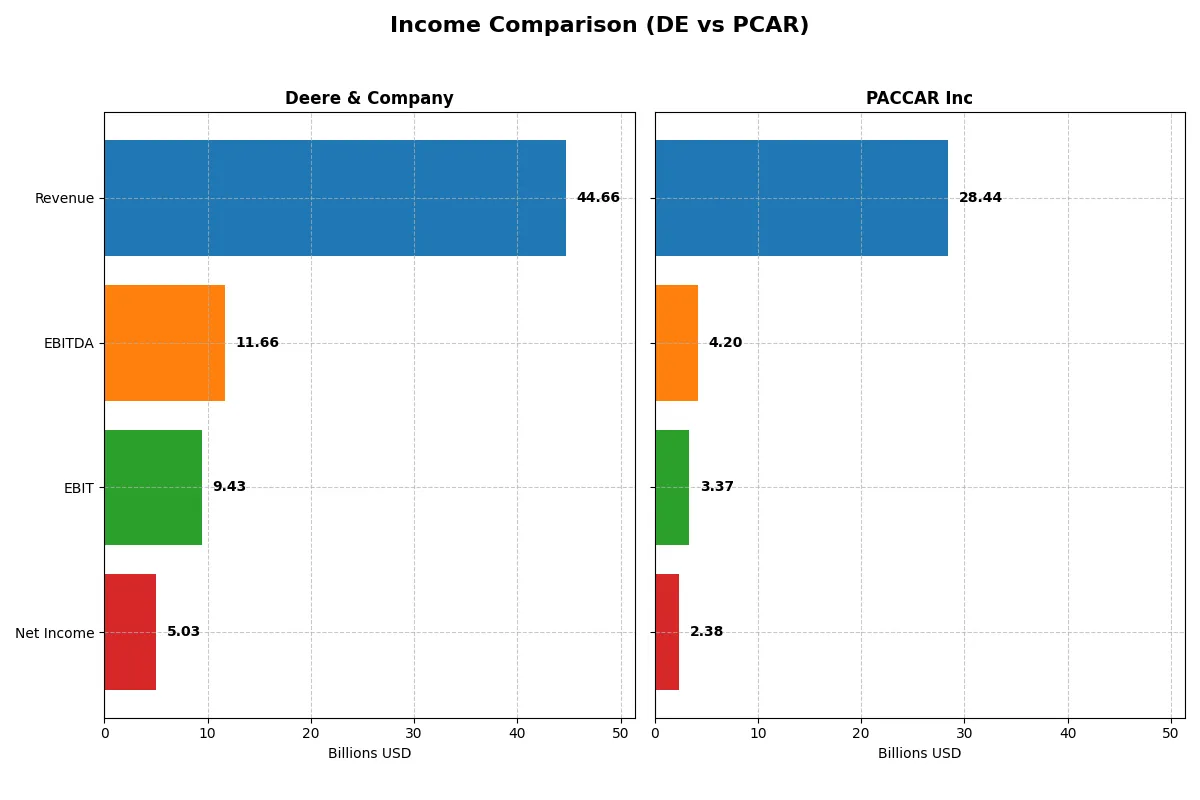
This data dissects the core profitability and scalability of both corporate engines to reveal who dominates the bottom line:
| Metric | Deere & Company (DE) | PACCAR Inc (PCAR) |
|---|---|---|
| Revenue | 44.7B | 28.4B |
| Cost of Revenue | 28.4B | 23.8B |
| Operating Expenses | 7.9B | 1.7B |
| Gross Profit | 16.3B | 4.6B |
| EBITDA | 11.7B | 4.2B |
| EBIT | 9.4B | 3.4B |
| Interest Expense | 3.2B | 0.3B |
| Net Income | 5.0B | 2.4B |
| EPS | 18.56 | 4.52 |
| Fiscal Year | 2025 | 2025 |
Income Statement Analysis: The Bottom-Line Duel
This income statement comparison reveals which company operates with superior efficiency and sustainable profit generation.
Deere & Company Analysis
Deere’s revenue peaked at 60.2B in 2023 before declining to 44.7B in 2025, reflecting a subdued top-line momentum. Net income followed a similar downward trend, dropping from 10.2B in 2023 to 5.0B in 2025. Margins remain solid with a 36.5% gross margin and 11.3% net margin in 2025, but recent declines in revenue and net income signal weakening operational efficiency.
PACCAR Inc Analysis
PACCAR’s revenue also fell in 2025 to 28.4B from 35.1B in 2023, with net income contracting to 2.4B from 4.6B over the same period. Despite a lower gross margin at 16.2%, PACCAR sustains a favorable EBIT margin of 11.9% and net margin of 8.4%. Over five years, PACCAR shows strong growth in revenue (+21%) and net income (+27%), suggesting resilient profitability despite short-term headwinds.
Margin Strength vs. Growth Resilience
Deere commands higher margins but suffers from recent revenue and earnings declines, indicating eroding momentum. PACCAR operates with leaner margins but delivers consistent long-term growth and margin improvement. For investors, Deere offers margin power, while PACCAR presents a growth-resilient profile better suited to navigating cyclical pressures.
Financial Ratios Comparison
These vital ratios act as a diagnostic tool to expose the underlying fiscal health, valuation premiums, and capital efficiency of the companies compared below:
| Ratios | Deere & Company (DE) | PACCAR Inc (PCAR) |
|---|---|---|
| ROE | 19.37% | 12.33% |
| ROIC | 7.13% | 6.39% |
| P/E | 24.89 | 24.25 |
| P/B | 4.82 | 2.99 |
| Current Ratio | 2.31 | 1.70 |
| Quick Ratio | 2.08 | 1.42 |
| D/E | 2.46 | 0.00 |
| Debt-to-Assets | 60.32% | 0.00% |
| Interest Coverage | 2.65 | 8.55 |
| Asset Turnover | 0.42 | 0.64 |
| Fixed Asset Turnover | 2.77 | 6.31 |
| Payout Ratio | 34.22% | 95.42% |
| Dividend Yield | 1.37% | 3.94% |
| Fiscal Year | 2025 | 2025 |
Efficiency & Valuation Duel: The Vital Signs
Financial ratios act as a company’s DNA, unmasking hidden risks and operational strengths essential for investment insight.
Deere & Company
Deere shows strong profitability with a 19.37% ROE and an 11.25% net margin, reflecting operational efficiency. Its P/E of 24.89 is fairly valued, though the 4.82 P/B ratio signals stretched equity valuation. Deere returns value through a modest 1.37% dividend yield, balancing shareholder payouts with growth reinvestment.
PACCAR Inc
PACCAR posts moderate profitability, with a 12.33% ROE and 8.35% net margin, indicating average operational performance. Its P/E of 24.25 aligns with market norms, while a lower 2.99 P/B ratio suggests fair valuation. PACCAR offers a healthy 3.94% dividend yield, emphasizing steady cash returns over aggressive reinvestment.
Dividend Yield vs. Valuation Discipline
PACCAR outperforms in shareholder returns with a higher dividend yield and conservative leverage, posing less financial risk. Deere’s stronger profitability is tempered by a stretched book value and higher debt. Investors favoring income and balance sheet strength may lean toward PACCAR, while those prioritizing operational efficiency might consider Deere.
Which one offers the Superior Shareholder Reward?
I see Deere & Company (DE) delivers a modest dividend yield near 1.4% with a conservative payout ratio around 34%. Their buyback activity is moderate, supporting long-term capital return. PACCAR Inc (PCAR) offers a higher dividend yield near 3.9% but with a payout ratio close to 95%, risking sustainability. PCAR’s buybacks are less intense, focusing more on dividends. Deere’s balanced approach between dividends and buybacks, backed by stronger free cash flow coverage, suggests a more sustainable and attractive total return profile in 2026. I favor DE for superior shareholder reward, blending income with prudent capital allocation.
Comparative Score Analysis: The Strategic Profile
The radar chart reveals the fundamental DNA and trade-offs of Deere & Company and PACCAR Inc, highlighting their distinct financial strengths and vulnerabilities:

Deere shows a very favorable ROE score of 5, outperforming PACCAR’s 4, indicating stronger equity efficiency. PACCAR edges Deere in ROA with a 4 versus 3, signaling better asset utilization. Both firms share a weak debt-to-equity score of 1, raising red flags on leverage. PACCAR offers a slightly more balanced valuation profile with moderate P/B (2) versus Deere’s very unfavorable rating (1). Overall, PACCAR maintains a more balanced financial profile, while Deere relies heavily on equity returns.
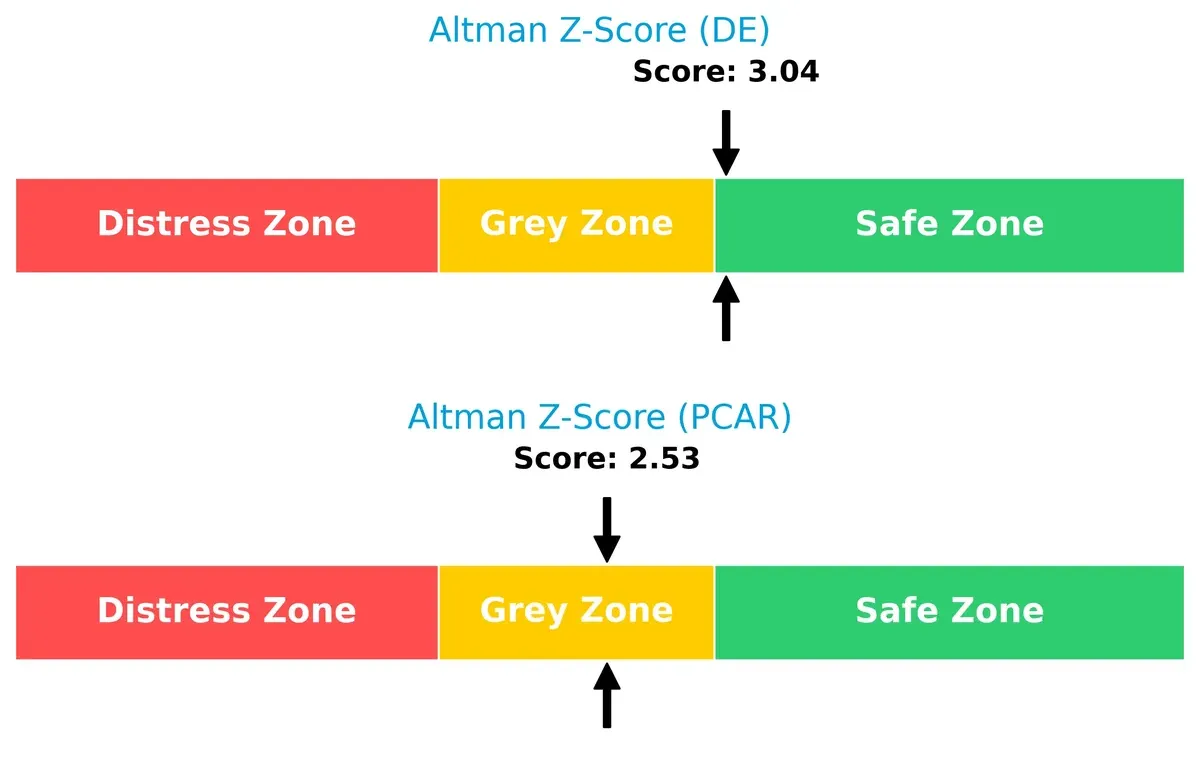
Bankruptcy Risk: Solvency Showdown
Deere’s Altman Z-Score of 3.04 places it safely above PACCAR’s 2.53 in the grey zone, indicating superior long-term solvency and lower bankruptcy risk in this cycle:
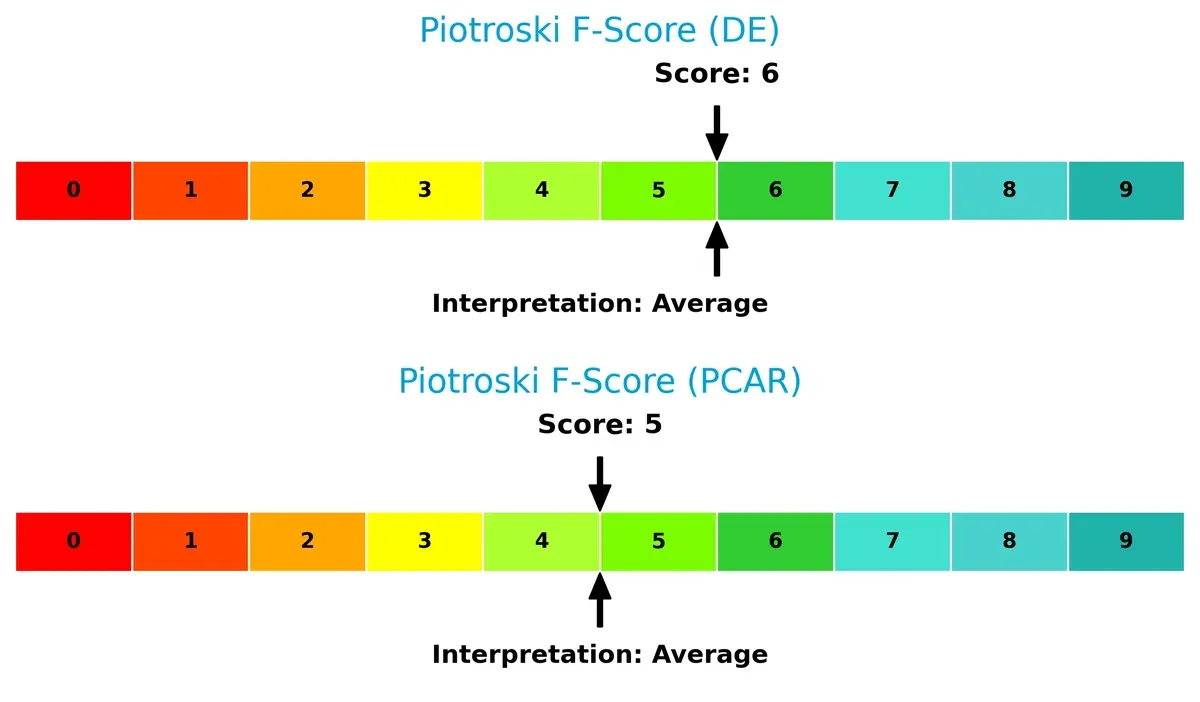
Financial Health: Quality of Operations
Both companies score in the average range for Piotroski F-Score, with Deere at 6 and PACCAR at 5, reflecting moderately healthy operations but no clear edge; neither shows critical red flags:
How are the two companies positioned?
This section dissects the operational DNA of Deere & Company and PACCAR by comparing their revenue distribution and internal strengths and weaknesses. The goal is to confront their economic moats to identify which business model offers the most resilient, sustainable competitive advantage today.
Revenue Segmentation: The Strategic Mix
The following visual comparison dissects how Deere & Company and PACCAR Inc diversify their income streams and reveals where their primary sector bets lie:
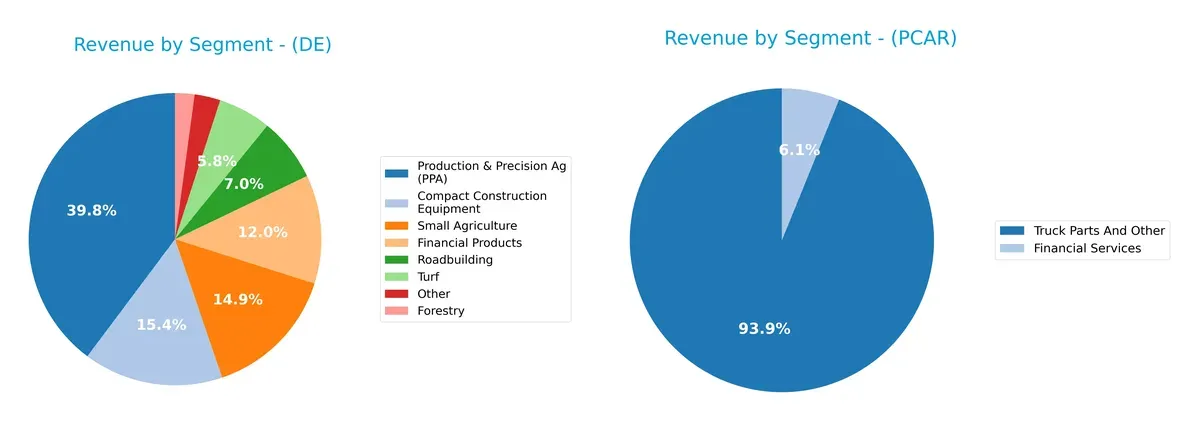
Deere & Company shows a broad revenue spread with $20.6B anchored in Production & Precision Ag, $7.7B in Small Agriculture, and $7.9B in Compact Construction Equipment. PACCAR Inc relies heavily on Truck Parts and Other, which dwarfs its $2.1B Financial Services unit with $32.1B revenue. Deere’s diversification reduces concentration risk, while PACCAR pivots on infrastructure dominance, exposing it to trucking industry cycles.
Strengths and Weaknesses Comparison
This table compares the Strengths and Weaknesses of Deere & Company and PACCAR Inc:
Deere & Company Strengths
- Diverse product segments in agriculture, construction, forestry, and financial services
- Strong net margin of 11.25% and ROE of 19.37%
- High current and quick ratios indicate solid liquidity
- Significant global presence across Americas, Europe, Asia, and Africa
PACCAR Inc Strengths
- Strong financial health with zero debt and favorable interest coverage ratio
- Robust fixed asset turnover at 6.31 signals efficient asset use
- Favorable dividend yield at 3.94%
- Global presence focused on US, Europe, and other countries with consistent revenue growth
Deere & Company Weaknesses
- High debt-to-equity ratio of 2.46 and 60.32% debt-to-assets pose financial risk
- Unfavorable price-to-book ratio at 4.82 suggests potential overvaluation
- Low asset turnover at 0.42 indicates less efficient asset use
- Neutral ROIC only slightly above WACC at 7.13% limits capital returns
PACCAR Inc Weaknesses
- Moderate profitability with net margin of 8.35% and ROE of 12.33% rated neutral
- WACC of 8.62% is higher than ROIC of 6.39%, indicating capital costs exceed returns
- Less diversified revenue mainly from truck parts and financial services
Both companies show slightly favorable overall financial profiles but differ in capital structure and diversification. Deere’s broad product lines contrast with PACCAR’s focused market, affecting risk and growth strategies.
The Moat Duel: Analyzing Competitive Defensibility
A structural moat alone shields long-term profits from relentless competition and market pressures. Let’s dissect the competitive moats of Deere & Company and PACCAR Inc:
Deere & Company: Precision Agriculture’s Durable Moat
Deere leverages intangible assets and switching costs embedded in its precision agriculture tech. High EBIT margin (21%) and margin stability confirm its pricing power. Yet, recent revenue declines signal pressure; new digital services in 2026 could deepen this moat if executed well.
PACCAR Inc: Brand Strength in Commercial Trucking
PACCAR’s moat rests on brand loyalty and dealer network exclusivity, contrasting Deere’s tech focus. Its EBIT margin (12%) trails Deere but shows efficient capital use. Despite short-term setbacks, PACCAR’s expansion in international markets offers a chance to widen its moat in 2026.
Economies of Scale vs. Brand Ecosystem: The Moat Showdown
Deere’s tech-driven switching costs create a deeper moat than PACCAR’s brand reliance. However, both face declining ROIC trends, signaling vulnerability. Deere remains better positioned to defend market share through innovation and integrated solutions.
Which stock offers better returns?
The past year shows Deere & Company’s stock climbing sharply by 41.14%, while PACCAR Inc’s price rose more modestly by 7.2%, highlighting distinct trading dynamics and growth trajectories.
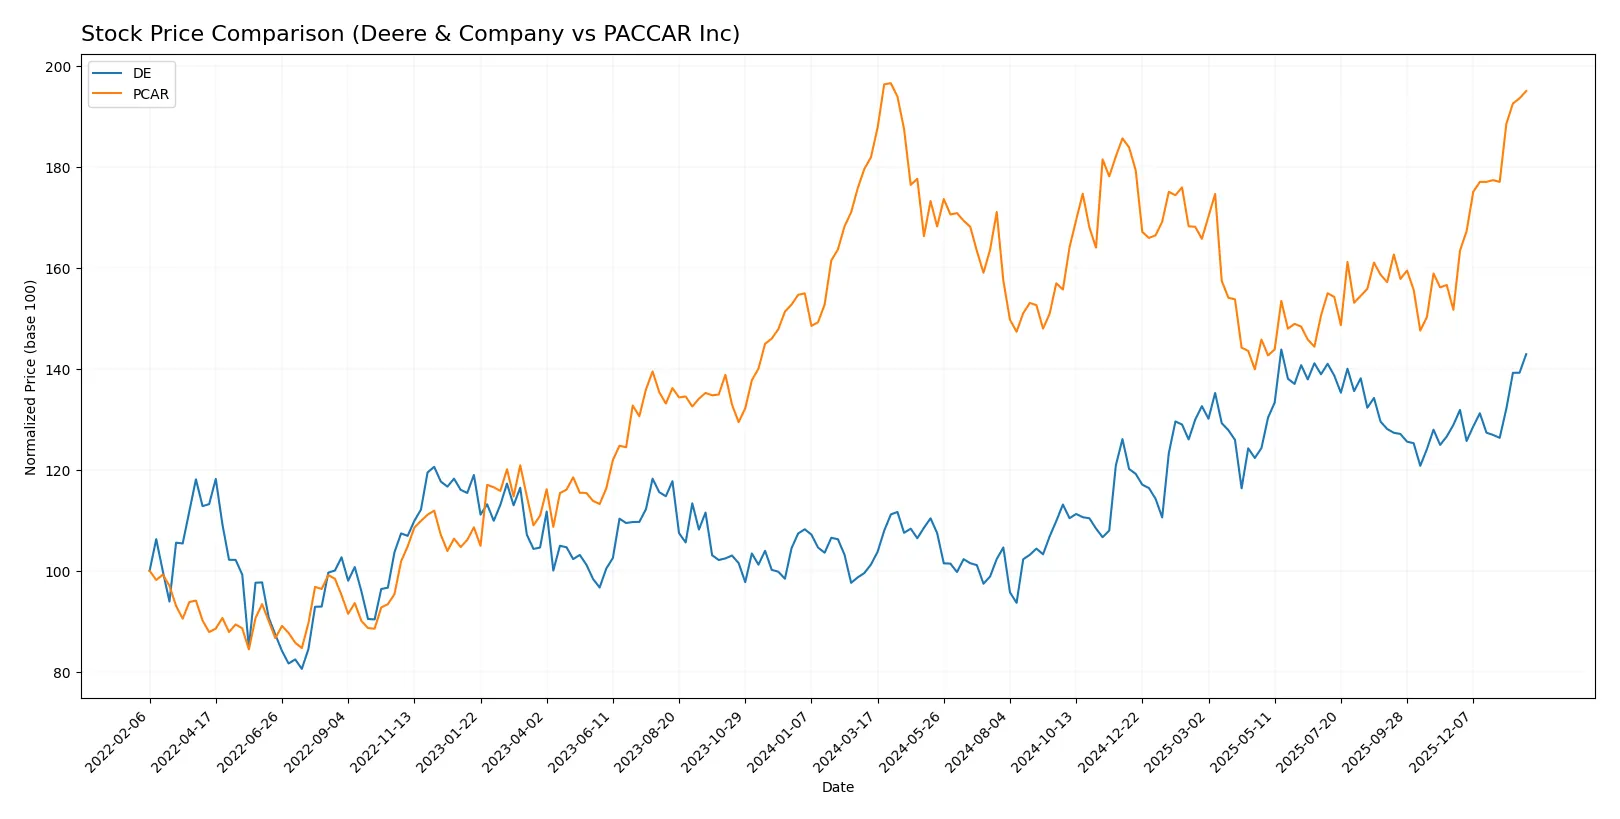
Trend Comparison
Deere & Company’s stock exhibits a strong bullish trend with a 41.14% gain over 12 months, marked by accelerating momentum and a wide price range between 346.03 and 531.48.
PACCAR Inc’s stock also trends bullish with a 7.2% gain over the same period, showing steadier acceleration and a narrower price range from 88.17 to 123.89.
Deere & Company outperforms PACCAR Inc with a significantly higher overall return and stronger acceleration, delivering superior market performance in the last year.
Target Prices
Analysts present a clear consensus on target prices for Deere & Company and PACCAR Inc, reflecting measured optimism.
| Company | Target Low | Target High | Consensus |
|---|---|---|---|
| Deere & Company | 458 | 612 | 529.5 |
| PACCAR Inc | 86 | 138 | 106 |
The consensus target for Deere & Company sits just above its current price of 528, signaling modest upside potential. PACCAR’s target consensus at 106 suggests a notable downside from today’s 123, indicating cautious analyst expectations.

Don’t Let Luck Decide Your Entry Point
Optimize your entry points with our advanced ProRealTime indicators. You’ll get efficient buy signals with precise price targets for maximum performance. Start outperforming now!
How do institutions grade them?
Deere & Company Grades
The following table summarizes recent grades from reputable institutions for Deere & Company:
| Grading Company | Action | New Grade | Date |
|---|---|---|---|
| Jefferies | Maintain | Hold | 2025-12-09 |
| DA Davidson | Maintain | Buy | 2025-12-01 |
| RBC Capital | Maintain | Outperform | 2025-11-28 |
| Evercore ISI Group | Maintain | In Line | 2025-11-28 |
| Oppenheimer | Maintain | Outperform | 2025-11-28 |
| Truist Securities | Maintain | Buy | 2025-11-28 |
| UBS | Upgrade | Buy | 2025-10-17 |
| JP Morgan | Maintain | Neutral | 2025-10-14 |
| Truist Securities | Maintain | Buy | 2025-10-08 |
| Oppenheimer | Maintain | Outperform | 2025-09-18 |
PACCAR Inc Grades
Here is a summary of recent grades from established grading companies for PACCAR Inc:
| Grading Company | Action | New Grade | Date |
|---|---|---|---|
| Citigroup | Maintain | Neutral | 2026-01-29 |
| Truist Securities | Maintain | Hold | 2026-01-28 |
| Wells Fargo | Maintain | Equal Weight | 2026-01-23 |
| JP Morgan | Maintain | Overweight | 2026-01-14 |
| Citigroup | Maintain | Neutral | 2026-01-13 |
| Morgan Stanley | Maintain | Equal Weight | 2026-01-13 |
| JP Morgan | Upgrade | Overweight | 2025-12-19 |
| Citigroup | Maintain | Neutral | 2025-12-11 |
| Wolfe Research | Upgrade | Peer Perform | 2025-10-22 |
| JP Morgan | Maintain | Neutral | 2025-10-22 |
Which company has the best grades?
Deere & Company generally receives stronger grades such as Outperform and Buy, compared to PACCAR’s more neutral and equal weight ratings. This difference suggests investors might perceive Deere as having better growth or risk-adjusted prospects currently.
Risks specific to each company
The following categories identify the critical pressure points and systemic threats facing both firms in the 2026 market environment:
1. Market & Competition
Deere & Company
- Faces intense competition in agricultural and construction machinery with innovation pressures and global demand fluctuations.
PACCAR Inc
- Competes in heavy-duty truck manufacturing with cyclical demand and exposure to freight industry dynamics.
2. Capital Structure & Debt
Deere & Company
- High debt-to-equity ratio (2.46) and debt-to-assets (60.32%) raise financial risk and interest burden concerns.
PACCAR Inc
- No reported debt; strong balance sheet with zero debt-to-assets and excellent interest coverage (9.73).
3. Stock Volatility
Deere & Company
- Beta at 1.01 indicates market-level volatility, with recent price range wide (404.42-537.26).
PACCAR Inc
- Slightly higher beta (1.024), implying marginally higher volatility but stable trading volumes.
4. Regulatory & Legal
Deere & Company
- Subject to environmental and safety regulations in multiple jurisdictions impacting manufacturing processes.
PACCAR Inc
- Faces regulatory scrutiny in emissions and safety standards globally, influencing product design and costs.
5. Supply Chain & Operations
Deere & Company
- Complex global supply chain vulnerable to raw material price spikes and logistics disruptions.
PACCAR Inc
- Supply chain exposed to semiconductor shortages and raw material inflation, affecting production schedules.
6. ESG & Climate Transition
Deere & Company
- Increasing pressure to develop sustainable machinery and reduce carbon footprint amid climate regulations.
PACCAR Inc
- Must innovate cleaner truck technologies to comply with tightening emissions standards and ESG demands.
7. Geopolitical Exposure
Deere & Company
- Operations sensitive to trade policies and tariffs affecting global agricultural markets.
PACCAR Inc
- Geopolitical tensions impact international sales and supply chain, especially in Europe and North America.
Which company shows a better risk-adjusted profile?
Deere’s largest risk is its heavy debt load, which threatens financial flexibility amid market uncertainties. PACCAR’s main challenge lies in cyclicality and supply chain disruptions but benefits from a pristine balance sheet. PACCAR’s zero debt and higher interest coverage provide a stronger risk-adjusted profile. Recent data highlight Deere’s unfavorable debt metrics versus PACCAR’s clean leverage position, underscoring my concern over Deere’s financial risk.
Final Verdict: Which stock to choose?
Deere & Company’s superpower lies in its unmatched operational efficiency and strong brand presence in the agricultural machinery sector. However, its high leverage and declining profitability pose a point of vigilance. It suits portfolios seeking aggressive growth with tolerance for cyclical risks.
PACCAR Inc’s strategic moat centers on its solid balance sheet with zero net debt and robust free cash flow generation. It offers better financial stability compared to Deere, fitting well within Growth at a Reasonable Price (GARP) portfolios focused on durable capital allocation.
If you prioritize aggressive growth and can weather higher leverage, Deere outshines as a market leader with strong operational execution. However, if you seek better financial stability and a safer margin of safety, PACCAR offers superior capital discipline and resilience in volatile markets. Both present distinct analytical scenarios for different investor profiles.
Disclaimer: Investment carries a risk of loss of initial capital. The past performance is not a reliable indicator of future results. Be sure to understand risks before making an investment decision.
Go Further
I encourage you to read the complete analyses of Deere & Company and PACCAR Inc to enhance your investment decisions: