Deere & Company and Hyster-Yale Materials Handling, Inc. are two prominent players in the agricultural machinery industry, each with distinct strengths in equipment manufacturing and innovation. Deere is a global leader with diversified segments, while Hyster-Yale specializes in lift trucks and material handling solutions, including hydrogen fuel-cell technology. This comparison explores their market positions and innovation strategies to help you identify the most compelling investment opportunity.
Table of contents
Companies Overview
I will begin the comparison between Deere & Company and Hyster-Yale Materials Handling, Inc. by providing an overview of these two companies and their main differences.
Deere & Company Overview
Deere & Company is a leading manufacturer and distributor in the agricultural machinery sector, operating globally through segments like Production and Precision Agriculture, Small Agriculture and Turf, Construction and Forestry, and Financial Services. Founded in 1837 and headquartered in Moline, Illinois, Deere focuses on equipment ranging from mid-size tractors to roadbuilding machinery, serving diverse agricultural and construction markets with a strong financial services arm.
Hyster-Yale Materials Handling, Inc. Overview
Hyster-Yale Materials Handling designs, engineers, and manufactures lift trucks, attachments, and aftermarket parts worldwide, selling primarily under the Hyster and Yale brands. Incorporated in 1991 and based in Cleveland, Ohio, the company serves industries including manufacturing, trucking, retail, and government agencies. It also produces hydrogen fuel-cell stacks and engines and operates through a network of independent dealerships.
Key similarities and differences
Both companies operate in the industrial sector with a focus on agricultural machinery but differ in product specialization: Deere offers a broad range of agricultural, turf, construction, and forestry equipment, while Hyster-Yale concentrates on lift trucks and material handling equipment. Deere has a significantly larger market capitalization (135B vs. 579M) and workforce (35,200 vs. 8,500), reflecting its broader market reach and diversified segments compared to Hyster-Yale’s more niche focus.
Income Statement Comparison
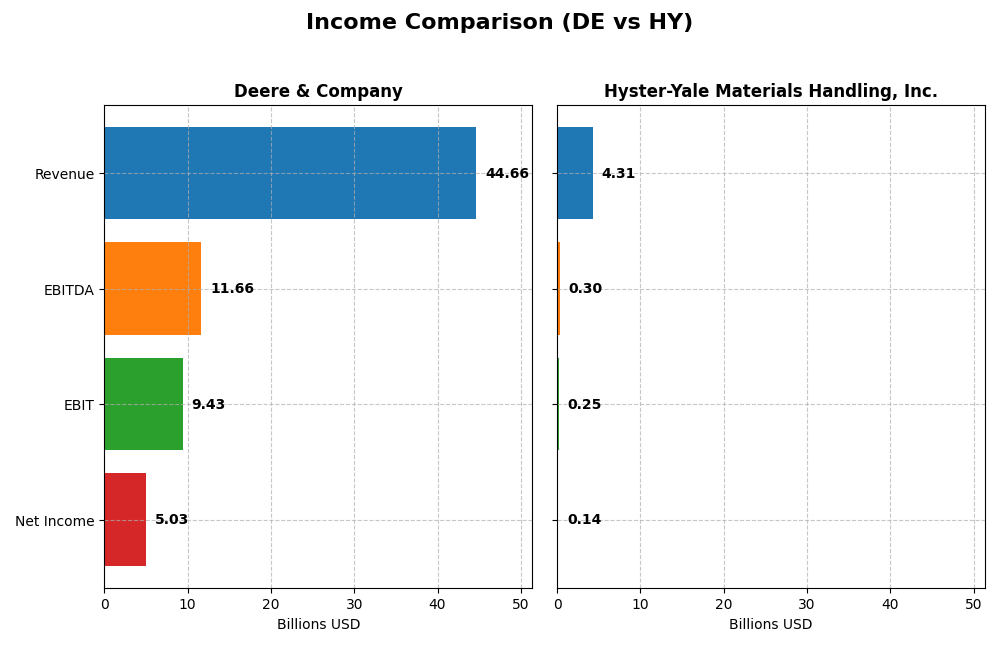
The following table presents the most recent fiscal year income statement metrics for Deere & Company and Hyster-Yale Materials Handling, Inc., enabling a direct financial comparison between these two industrial sector companies.
| Metric | Deere & Company (DE) | Hyster-Yale Materials Handling, Inc. (HY) |
|---|---|---|
| Market Cap | 135.4B | 579M |
| Revenue | 44.7B | 4.31B |
| EBITDA | 11.7B | 300M |
| EBIT | 9.43B | 253M |
| Net Income | 5.03B | 142M |
| EPS | 18.56 | 8.16 |
| Fiscal Year | 2025 | 2024 |
Income Statement Interpretations
Deere & Company
Deere & Company’s revenue showed moderate overall growth of 3.79% from 2021 to 2025 but declined by 11.59% in the latest year. Net income decreased by 15.7% over the period and fell sharply by nearly 28% in the past year. Margins remain strong with a gross margin of 36.48% and net margin of 11.25%, though recent year growth in margins turned unfavorable, reflecting earnings pressure.
Hyster-Yale Materials Handling, Inc.
Hyster-Yale delivered solid revenue growth of 53.2% over 2020-2024 and a 4.61% increase in the latest year. Net income surged 283.56% across the period and rose 11.05% most recently. Gross margin at 20.79% is favorable, while EBIT and net margins are stable or improving. The company exhibits positive momentum with improving profitability and earnings per share.
Which one has the stronger fundamentals?
Hyster-Yale shows stronger fundamentals with consistent revenue and net income growth, favorable margin trends, and positive earnings momentum. Deere & Company, despite higher margins, faces declining net income and margin contraction recently. Overall, Hyster-Yale’s income statement reflects a more favorable growth and profitability profile over the periods analyzed.
Financial Ratios Comparison
Below is a comparison of key financial ratios for Deere & Company and Hyster-Yale Materials Handling, Inc. based on their most recent fiscal year data.
| Ratios | Deere & Company (2025) | Hyster-Yale Materials Handling, Inc. (2024) |
|---|---|---|
| ROE | 19.4% | 29.9% |
| ROIC | 7.1% | 13.6% |
| P/E | 24.9 | 6.2 |
| P/B | 4.82 | 1.87 |
| Current Ratio | 2.31 | 1.35 |
| Quick Ratio | 2.08 | 0.64 |
| D/E (Debt to Equity) | 2.46 | 1.14 |
| Debt-to-Assets | 60.3% | 26.7% |
| Interest Coverage | 2.65 | 7.24 |
| Asset Turnover | 0.42 | 2.12 |
| Fixed Asset Turnover | 2.77 | 14.05 |
| Payout ratio | 34.2% | 16.9% |
| Dividend yield | 1.37% | 2.70% |
Interpretation of the Ratios
Deere & Company
Deere & Company shows a mixed financial profile with favorable net margin (11.25%) and ROE (19.37%), but concerns arise with high debt ratios (debt to equity 2.46, debt to assets 60.32%) and asset turnover of 0.42, which is weak. The dividend yield of 1.37% is moderate, supported by a balanced payout ratio and no excessive buybacks, indicating stable shareholder returns without significant distribution risks.
Hyster-Yale Materials Handling, Inc.
Hyster-Yale displays strong profitability metrics such as ROE of 29.95% and ROIC of 13.59%, with a low debt to assets ratio of 26.7%, reflecting prudent leverage. The dividend yield at 2.7% is favorable, supported by solid coverage and a reasonable payout. However, the quick ratio of 0.64 signals liquidity risk, and the debt to equity ratio at 1.14 is somewhat elevated, requiring attention.
Which one has the best ratios?
Comparing the two, Hyster-Yale has a more favorable overall ratio profile with higher profitability, lower leverage, and stronger dividend yield, despite some liquidity concerns. Deere & Company presents a more cautious picture with debt and efficiency challenges but maintains stable dividends. Thus, Hyster-Yale’s ratios appear generally stronger and more balanced for investors focused on returns and financial health.
Strategic Positioning
This section compares the strategic positioning of Deere & Company and Hyster-Yale Materials Handling, Inc. across Market position, Key segments, and Exposure to technological disruption:
Deere & Company
- Leading global manufacturer in agricultural and construction equipment, facing broad industrial competition.
- Diverse segments: Production & Precision Ag, Small Ag & Turf, Construction & Forestry, Financial Services.
- No explicit mention of disruption exposure; traditional heavy equipment with some advanced tech in precision ag.
Hyster-Yale Materials Handling, Inc.
- Focused manufacturer of lift trucks and attachments, competing in niche materials handling markets.
- Concentrated on lift trucks, attachments, aftermarket parts, hydrogen fuel-cell technology.
- Developing hydrogen fuel-cell stacks and engines, indicating exposure to clean energy disruption.
Deere & Company vs Hyster-Yale Materials Handling, Inc. Positioning
Deere shows a diversified business model spanning multiple heavy equipment sectors and financial services, offering broader market reach but complexity. Hyster-Yale focuses on lift trucks and clean energy innovation, providing specialization but narrower market exposure.
Which has the best competitive advantage?
Hyster-Yale demonstrates a very favorable MOAT with growing ROIC and durable profitability, indicating a strong competitive advantage. Deere shows a slightly unfavorable MOAT with declining ROIC, suggesting challenges sustaining value creation.
Stock Comparison
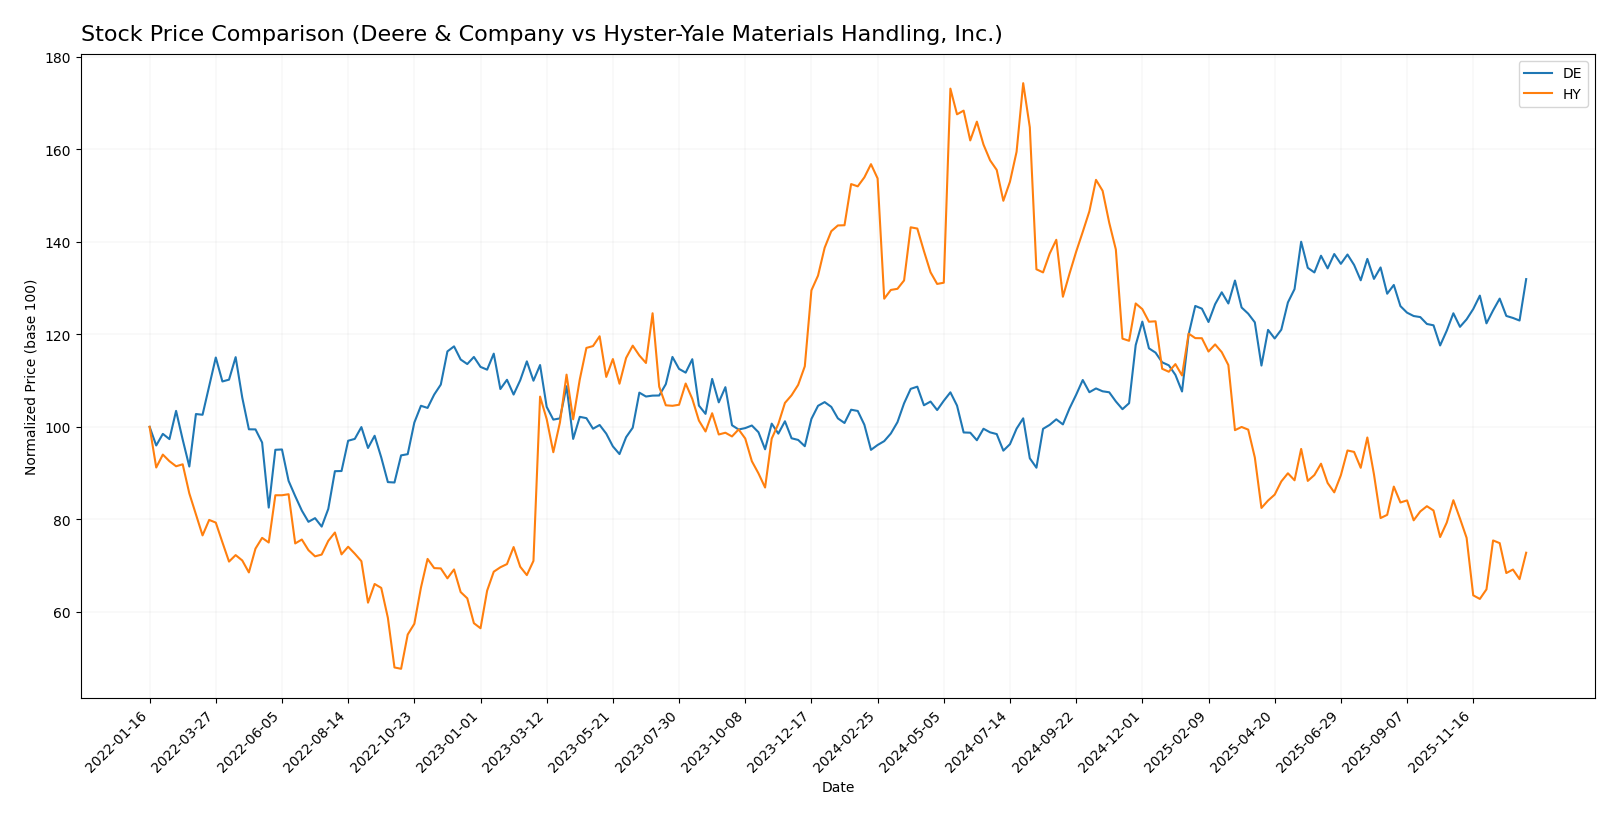
The stock price chart highlights Deere & Company’s strong 38.85% gain over the past 12 months with a decelerating bullish trend, contrasted by Hyster-Yale Materials Handling’s 53.58% decline and accelerating bearish trend.
Trend Analysis
Deere & Company’s stock shows a clear bullish trend over the past year with a 38.85% increase, despite deceleration and high volatility indicated by a 49.76 std deviation. Recent months reveal a moderate 5.93% gain.
Hyster-Yale Materials Handling experienced a pronounced bearish trend with a 53.58% decline over the year and accelerating downward momentum. Recent data shows continued negative performance with a 13.49% drop.
Comparing both, Deere & Company delivered the highest market performance with a strong positive gain, while Hyster-Yale’s stock faced significant losses and a worsening trend.
Target Prices
The current analyst consensus points to moderate upside potential for Deere & Company and steady expectations for Hyster-Yale Materials Handling.
| Company | Target High | Target Low | Consensus |
|---|---|---|---|
| Deere & Company | 612 | 458 | 529.5 |
| Hyster-Yale Materials Handling, Inc. | 40 | 40 | 40 |
Analysts expect Deere & Company’s price to rise moderately above its current 500.8 USD, while Hyster-Yale’s consensus target of 40 USD suggests limited near-term price movement from its current 32.63 USD.
Analyst Opinions Comparison
This section compares analysts’ ratings and grades for Deere & Company and Hyster-Yale Materials Handling, Inc.:
Rating Comparison
DE Rating
- Rating: B- with a Very Favorable status.
- Discounted Cash Flow Score: 2, indicating a Moderate valuation outlook.
- ROE Score: 5, considered Very Favorable for profitability efficiency.
- ROA Score: 3, rated Moderate for asset utilization effectiveness.
- Debt To Equity Score: 1, Very Unfavorable due to higher financial risk.
- Overall Score: 2, Moderate overall financial standing.
HY Rating
- Rating: C with a Very Favorable status.
- Discounted Cash Flow Score: 1, reflecting a Very Unfavorable valuation view.
- ROE Score: 1, marked Very Unfavorable for shareholder profit generation.
- ROA Score: 2, showing a Moderate but lower asset efficiency.
- Debt To Equity Score: 2, Moderate indicating comparatively lower financial risk.
- Overall Score: 2, also Moderate overall financial standing.
Which one is the best rated?
Deere & Company has higher ratings in ROE and discounted cash flow, but a weaker debt-to-equity score. Hyster-Yale has a lower overall rating and weaker profitability scores, though its financial risk is moderate. Based strictly on the data, Deere & Company appears better rated.
Scores Comparison
Here is a comparison of the financial health scores for Deere & Company and Hyster-Yale Materials Handling, Inc.:
Deere & Company Scores
- Altman Z-Score of 2.94 places Deere in the grey zone, indicating moderate bankruptcy risk.
- Piotroski Score of 6 indicates average financial strength for Deere.
Hyster-Yale Scores
- Altman Z-Score of 2.70 places Hyster-Yale in the grey zone, with moderate risk.
- Piotroski Score of 5 reflects average financial strength for Hyster-Yale.
Which company has the best scores?
Based on the provided data, Deere & Company has slightly higher Altman Z-Score and Piotroski Score than Hyster-Yale, indicating marginally better financial stability and strength. Both remain in the grey zone and average category respectively.
Grades Comparison
Here is a comparison of the recent grades assigned to Deere & Company and Hyster-Yale Materials Handling, Inc.:
Deere & Company Grades
The table below shows recent analyst grades from reputable firms for Deere & Company:
| Grading Company | Action | New Grade | Date |
|---|---|---|---|
| Jefferies | Maintain | Hold | 2025-12-09 |
| DA Davidson | Maintain | Buy | 2025-12-01 |
| Truist Securities | Maintain | Buy | 2025-11-28 |
| RBC Capital | Maintain | Outperform | 2025-11-28 |
| Oppenheimer | Maintain | Outperform | 2025-11-28 |
| Evercore ISI Group | Maintain | In Line | 2025-11-28 |
| UBS | Upgrade | Buy | 2025-10-17 |
| JP Morgan | Maintain | Neutral | 2025-10-14 |
| Truist Securities | Maintain | Buy | 2025-10-08 |
| Oppenheimer | Maintain | Outperform | 2025-09-18 |
Deere & Company shows a generally positive trend with multiple buy and outperform ratings, along with some hold and neutral grades indicating cautious optimism.
Hyster-Yale Materials Handling, Inc. Grades
The table below presents recent analyst grades for Hyster-Yale Materials Handling, Inc.:
| Grading Company | Action | New Grade | Date |
|---|---|---|---|
| Roth MKM | Maintain | Buy | 2024-11-06 |
| Roth MKM | Maintain | Buy | 2024-08-08 |
| Roth MKM | Maintain | Buy | 2024-06-07 |
| Northland Capital Markets | Upgrade | Outperform | 2024-06-05 |
| Northland Capital Markets | Downgrade | Market Perform | 2024-05-10 |
| Roth MKM | Maintain | Buy | 2024-05-09 |
| EF Hutton | Maintain | Buy | 2023-05-04 |
| EF Hutton | Maintain | Buy | 2023-05-03 |
| EF Hutton | Maintain | Buy | 2023-03-01 |
| EF Hutton | Maintain | Buy | 2022-03-02 |
Hyster-Yale has consistently received buy ratings with occasional upgrades and downgrades, indicating stable analyst confidence with minor fluctuations.
Which company has the best grades?
Hyster-Yale Materials Handling, Inc. holds a stronger buy consensus, reflecting steadier analyst support, while Deere & Company shows a mixed rating with more hold and neutral opinions. This difference may affect investor sentiment regarding growth prospects and risk tolerance.
Strengths and Weaknesses
Below is a comparison of key strengths and weaknesses for Deere & Company and Hyster-Yale Materials Handling, Inc. based on recent financial and operational data.
| Criterion | Deere & Company (DE) | Hyster-Yale Materials Handling, Inc. (HY) |
|---|---|---|
| Diversification | Highly diversified across agriculture, construction, forestry, and financial products, with FY 2024 revenue spread over multiple segments including $20.6B in Production & Precision Ag and $7.9B in Compact Construction Equipment. | More concentrated, primarily focused on lift truck business ($3.36B in 2024) with smaller contributions from subsidiaries like Bolzoni and JAPIC. |
| Profitability | Moderate profitability with net margin 11.25%, ROE 19.37%, but ROIC slightly above WACC at 7.13% with a declining trend, indicating value is being slightly eroded. | Lower net margin at 3.3% but strong ROE of 29.95% and a high ROIC of 13.59% with a sharply growing trend, confirming strong value creation. |
| Innovation | Established leader in precision agriculture and construction equipment, investing heavily in advanced technologies and precision solutions. | Innovation more focused on materials handling and lift trucks, with strategic acquisitions enhancing product offerings and technology. |
| Global presence | Global footprint with a wide presence in multiple continents and diversified customer base in agriculture and construction sectors. | Primarily focused on North America and Europe with niche presence in specialized lift truck markets. |
| Market Share | Leading market share in agriculture machinery and construction equipment sectors worldwide. | Strong position in the materials handling industry but smaller market share compared to DE’s broad sectors. |
Key takeaways: Deere & Company offers broad diversification and global scale but shows signs of declining capital efficiency. Hyster-Yale presents a focused business model with robust profitability and strong growth in return on invested capital, indicating a durable competitive advantage. Investors should weigh DE’s scale against HY’s higher value creation potential.
Risk Analysis
The table below summarizes key risk factors for Deere & Company and Hyster-Yale Materials Handling, Inc. based on their most recent financial and operational data.
| Metric | Deere & Company (DE) | Hyster-Yale Materials Handling (HY) |
|---|---|---|
| Market Risk | Beta 1.01, moderate market sensitivity | Beta 1.44, higher market volatility risk |
| Debt level | High debt-to-assets 60.3%, D/E 2.46 (unfavorable) | Moderate debt-to-assets 26.7%, D/E 1.14 (favorable) |
| Regulatory Risk | Moderate, exposure to agricultural and construction regulations | Moderate, industrial equipment regulations apply |
| Operational Risk | Large scale operations with diverse segments, some complexity | Smaller scale, concentrated lift truck manufacturing |
| Environmental Risk | Exposure to emissions and sustainability regulations in machinery | Increasing focus on hydrogen fuel-cell tech reduces emissions risk |
| Geopolitical Risk | Global supply chain exposure, trade policy sensitivity | Global sales but smaller footprint, moderate geopolitical risk |
Deere faces significant leverage risks with a high debt load that may impact financial flexibility, despite solid profitability. Hyster-Yale’s higher beta suggests more market volatility, but its lower debt and focus on innovative fuel-cell technology reduce some financial and environmental risks. Operational complexity and global exposure remain key concerns for both.
Which Stock to Choose?
Deere & Company (DE) shows a mixed financial picture with a slightly favorable ratio profile but an unfavorable income statement trend, marked by declining revenues and profitability. Its debt levels and price-to-book ratio remain concerns despite a very favorable overall rating.
Hyster-Yale Materials Handling, Inc. (HY) presents a favorable income and ratio evaluation, with strong growth in net income and improving profitability. The company’s lower debt-to-assets and favorable return metrics contrast with moderate scores and a bearish stock trend over the past year.
For investors prioritizing stability and strong economic moats, HY’s growing ROIC and favorable income trends may appear more attractive, while those focused on established market presence and higher ratings might see DE as a quality stock despite recent challenges.
Disclaimer: Investment carries a risk of loss of initial capital. The past performance is not a reliable indicator of future results. Be sure to understand risks before making an investment decision.
Go Further
I encourage you to read the complete analyses of Deere & Company and Hyster-Yale Materials Handling, Inc. to enhance your investment decisions: