Home > Comparison > Consumer Cyclical > NKE vs DECK
The strategic rivalry between NIKE, Inc. and Deckers Outdoor Corporation shapes the competitive landscape in the apparel – footwear & accessories sector. NIKE operates as a global athletic footwear and apparel powerhouse with a vast workforce and diversified product lines. Deckers focuses on premium lifestyle and performance footwear, emphasizing niche brands and direct-to-consumer sales. This analysis probes which company offers superior risk-adjusted returns amid evolving consumer preferences and market dynamics.
Table of contents
Companies Overview
Nike and Deckers Outdoor dominate the global footwear and apparel market with distinct brand strategies and customer bases.
NIKE, Inc.: Global Athletic Powerhouse
Nike leads as a consumer cyclical giant specializing in athletic footwear, apparel, and accessories worldwide. Its core revenue stems from innovative product design and extensive licensing under iconic trademarks like Jumpman and Converse. In 2026, Nike emphasizes digital retail expansion and direct-to-consumer growth, reinforcing its competitive edge in sports performance and lifestyle markets.
Deckers Outdoor Corporation: Premium Lifestyle and Performance
Deckers positions itself as a premium footwear and apparel designer focused on casual and high-performance segments. Its revenue relies heavily on flagship brands like UGG and Hoka, catering to both lifestyle and athletic consumers. The company’s 2026 strategy zeroes in on global retail footprint expansion and e-commerce, leveraging brand strength to capture niche markets in outdoor and comfort footwear.
Strategic Collision: Similarities & Divergences
Both companies prioritize brand-driven growth but diverge in scope and market approach. Nike’s broad athletic ecosystem contrasts with Deckers’ targeted premium and niche brands. They primarily clash in footwear innovation and consumer engagement channels. Nike’s vast scale offers stability, while Deckers’ focused portfolio presents agility, defining their unique investment dynamics in competitive footwear retail.
Income Statement Comparison
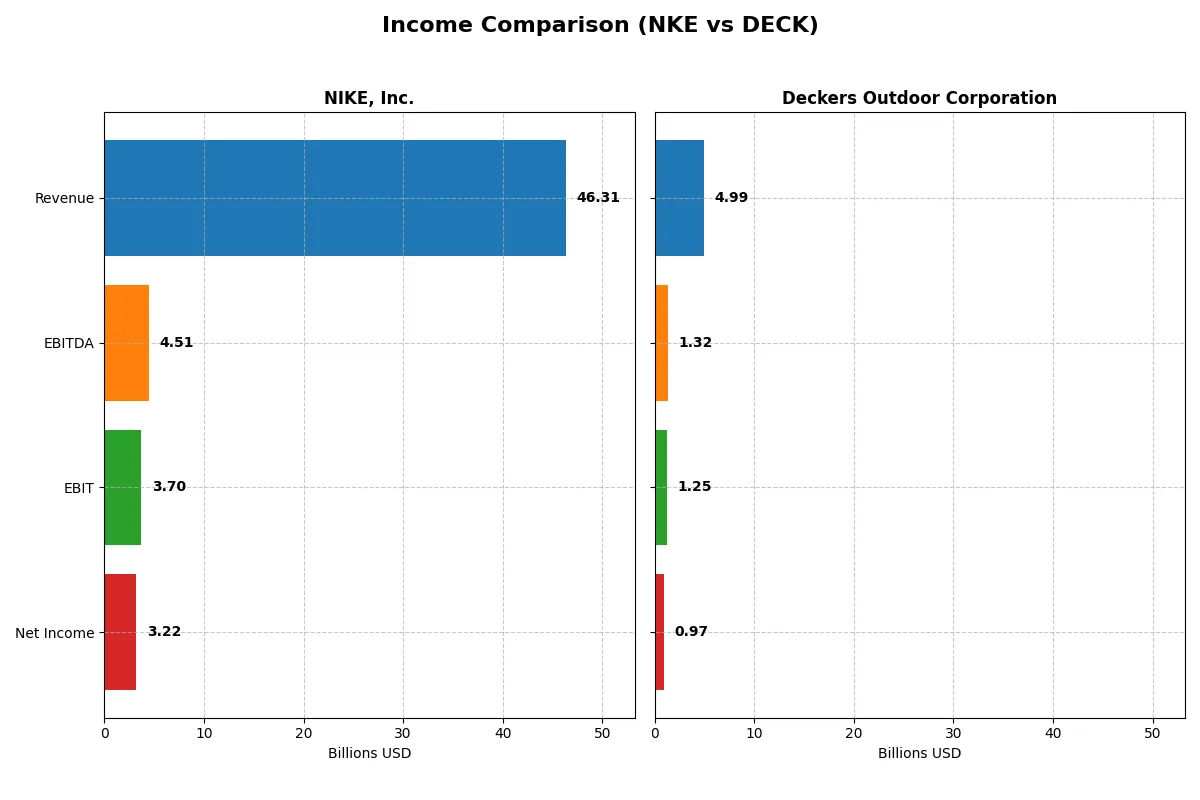
This data dissects the core profitability and scalability of both corporate engines to reveal who dominates the bottom line:
| Metric | NIKE, Inc. (NKE) | Deckers Outdoor Corporation (DECK) |
|---|---|---|
| Revenue | 46.3B | 4.99B |
| Cost of Revenue | 26.5B | 2.10B |
| Operating Expenses | 16.1B | 1.71B |
| Gross Profit | 19.8B | 2.89B |
| EBITDA | 4.51B | 1.32B |
| EBIT | 3.70B | 1.25B |
| Interest Expense | 289M | 3.52M |
| Net Income | 3.22B | 966M |
| EPS | 2.17 | 6.36 |
| Fiscal Year | 2025 | 2025 |
Income Statement Analysis: The Bottom-Line Duel
This income statement comparison exposes each company’s operational efficiency and profitability dynamics over recent years.
NIKE, Inc. Analysis
NIKE shows a slight revenue decline in 2025 to $46.3B from $51.4B in 2024, with net income falling sharply to $3.22B. Gross margin remains solid at 42.7%, but net margin contracted to 6.95%, reflecting margin pressures and cost challenges. The sharp drop in EBIT and EPS signals weakening momentum in profitability and operational efficiency.
Deckers Outdoor Corporation Analysis
Deckers posts strong revenue growth, rising 16% to $5B in 2025, with net income climbing 27% to $966M. Its gross margin of 57.9% and net margin near 19.4% demonstrate superior profitability and cost control. The company exhibits robust momentum, with consistent gains in EBIT and EPS, highlighting effective capital allocation and operational leverage.
Margin Strength vs. Growth Momentum
Deckers outperforms NIKE in margin expansion and earnings growth, delivering a cleaner upward trajectory in profitability metrics. NIKE’s declining margins and net income contrast with Deckers’ efficient cost management and strong revenue gains. For investors, Deckers’ profile offers attractive growth and margin improvement, while NIKE faces near-term profitability headwinds.
Financial Ratios Comparison
These vital ratios act as a diagnostic tool to expose the underlying fiscal health, valuation premiums, and capital efficiency of the companies compared below:
| Ratios | NIKE, Inc. (NKE) | Deckers Outdoor Corp. (DECK) |
|---|---|---|
| ROE | 24.4% | 38.4% |
| ROIC | 11.6% | 31.4% |
| P/E | 27.9 | 17.6 |
| P/B | 6.8 | 6.8 |
| Current Ratio | 2.21 | 3.72 |
| Quick Ratio | 1.50 | 3.07 |
| D/E (Debt/Equity) | 0.83 | 0.11 |
| Debt-to-Assets | 30.1% | 7.6% |
| Interest Coverage | 12.8 | 335.3 |
| Asset Turnover | 1.27 | 1.37 |
| Fixed Asset Turnover | 6.14 | 8.86 |
| Payout Ratio | 71.5% | 0% |
| Dividend Yield | 2.56% | 0% |
| Fiscal Year | 2025 | 2025 |
Efficiency & Valuation Duel: The Vital Signs
Financial ratios serve as a company’s DNA, exposing hidden risks while highlighting operational strengths and valuation nuances.
NIKE, Inc.
NIKE posts a solid ROE of 24.36% and a modest net margin of 6.95%, signaling efficient core profitability. Its P/E ratio at 27.95 suggests the stock trades at a premium, stretching valuation. NIKE rewards shareholders with a 2.56% dividend yield, balancing returns with reinvestment in capital and working capital management.
Deckers Outdoor Corporation
Deckers delivers a robust ROE of 38.44% and an impressive 19.38% net margin, underscoring strong profitability. The P/E of 17.59 shows a more reasonable valuation compared to NIKE. However, Deckers pays no dividends, focusing instead on growth and R&D investments, supported by a very conservative debt profile and excellent interest coverage.
Premium Valuation vs. Operational Prowess
Deckers offers higher profitability and a more attractive P/E ratio, though NIKE provides steady dividends and strong operational efficiency. Investors seeking growth and operational leverage may favor Deckers, while income-focused profiles might prefer NIKE’s balanced return approach.
Which one offers the Superior Shareholder Reward?
I observe that NIKE, Inc. (NKE) pays a consistent dividend with yields around 1.5% to 2.5% and payout ratios fluctuating between 28% and 71%. Its dividend payout remains well-covered by free cash flow, signaling sustainable income for shareholders. NIKE also supports returns with moderate buybacks, balancing capital allocation between dividends and share repurchases. In contrast, Deckers Outdoor Corporation (DECK) does not pay dividends but aggressively reinvests free cash flow into growth and acquisitions, evidenced by near-zero payout ratios and robust free cash flow margins. DECK’s buyback activity is less prominent but its low leverage and strong cash position provide flexibility for future distributions. For 2026, I find NIKE’s balanced distribution model more sustainable and attractive for investors seeking a blend of income and capital appreciation. DECK’s reinvestment strategy suits growth investors but carries higher risk without immediate shareholder yield. Therefore, I view NIKE as offering the superior total shareholder reward in the current market environment.
Comparative Score Analysis: The Strategic Profile
The radar chart reveals the fundamental DNA and trade-offs of NIKE, Inc. and Deckers Outdoor Corporation, highlighting their core financial strengths and vulnerabilities:
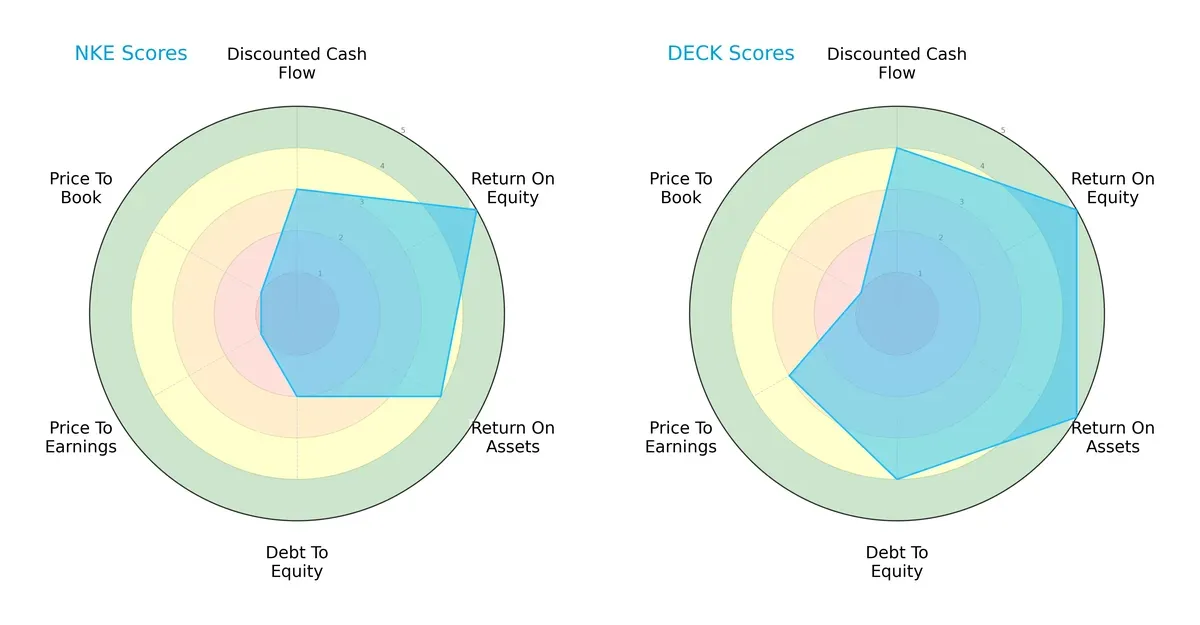
Deckers shows a more balanced financial profile with strong DCF (4) and ROA (5) scores, coupled with a healthier debt-to-equity position (4). NIKE relies heavily on operational efficiency, matching Deckers in ROE (5) but lagging in valuation metrics (PE and PB scores at 1). Deckers also trades at a more reasonable price-to-earnings level (3 vs. 1), indicating better value discipline.
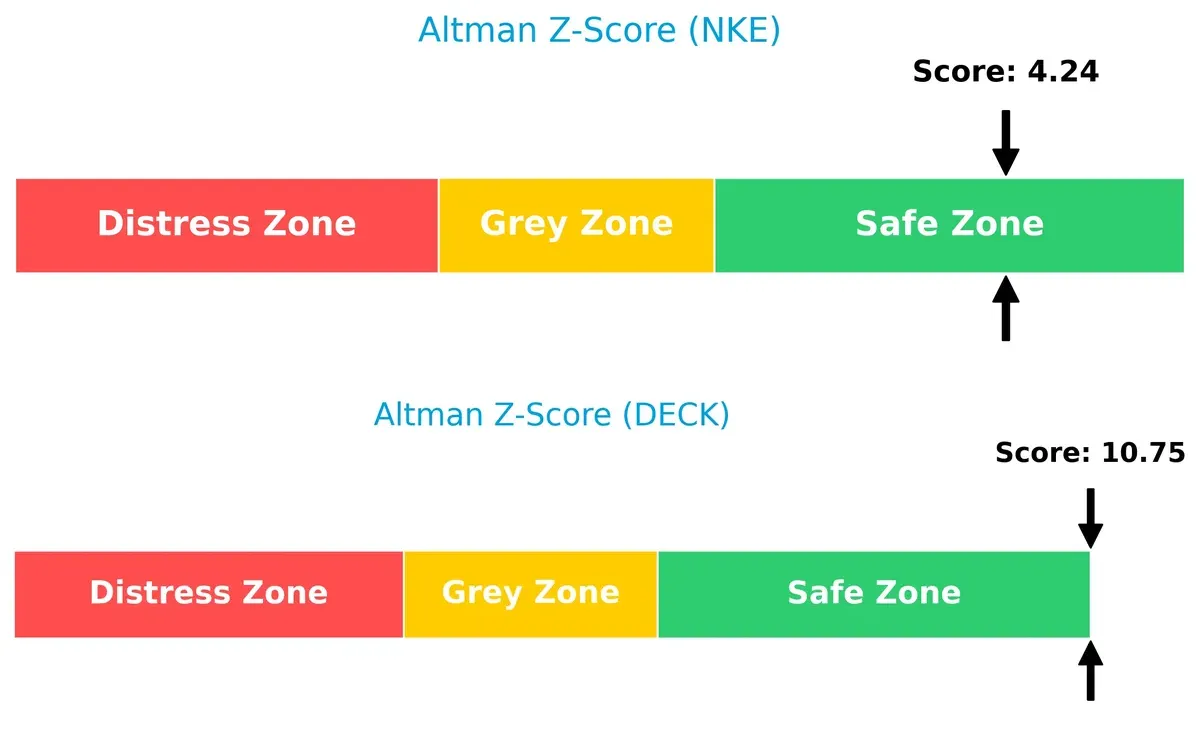
Bankruptcy Risk: Solvency Showdown
The Altman Z-Score gap favors Deckers (10.75) over NIKE (4.24), underscoring Deckers’ superior financial stability and lower bankruptcy risk in this cycle:
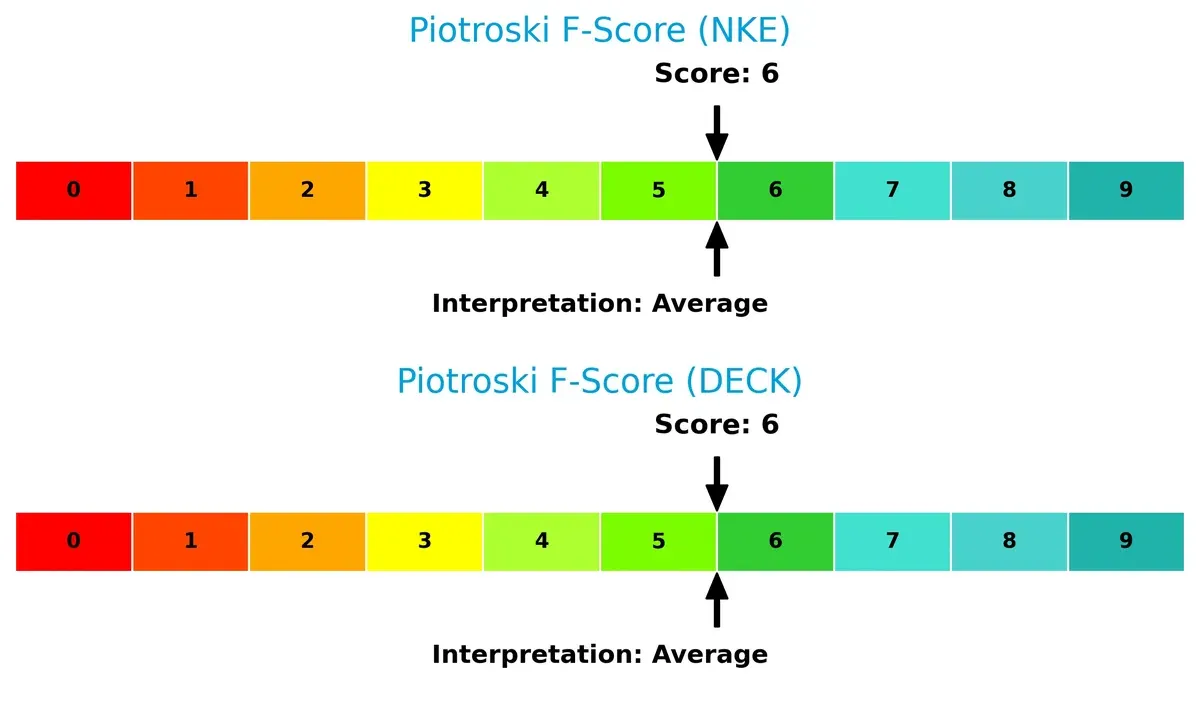
Financial Health: Quality of Operations
Both companies share an average Piotroski F-Score of 6, suggesting moderate operational strength without glaring red flags in their fundamentals:
How are the two companies positioned?
This section dissects the operational DNA of NIKE and Deckers by comparing their revenue distribution and internal dynamics. The goal is to confront their economic moats to reveal which model sustains a more resilient competitive advantage today.
Revenue Segmentation: The Strategic Mix
This visual comparison dissects how NIKE, Inc. and Deckers Outdoor Corporation diversify their income streams and reveals their primary sector bets:
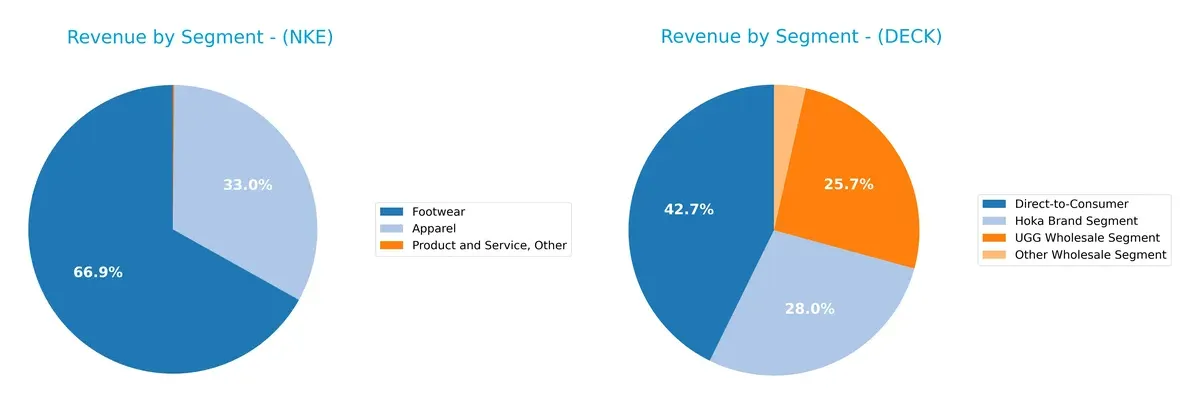
NIKE anchors its revenue heavily in Footwear at $31B, with Apparel contributing $15B and a minor $74M from other products. This concentration underscores NIKE’s dominance in athletic shoes and brand ecosystem lock-in. Deckers displays a more balanced mix, with $2.1B Direct-to-Consumer, $1.4B Hoka, and $1.3B UGG Wholesale, indicating strategic diversification across multiple brands and channels, reducing concentration risk relative to NIKE.
Strengths and Weaknesses Comparison
This table compares the Strengths and Weaknesses of NIKE and Deckers Outdoor Corporation:
NIKE Strengths
- Strong global presence with significant North America and EMEA revenues
- Favorable ROE of 24.36% and ROIC of 11.57% exceeding WACC
- Solid liquidity with current ratio at 2.21 and quick ratio at 1.5
- Consistent asset turnover and fixed asset turnover rates
- Dividend yield of 2.56% supports shareholder returns
Deckers Strengths
- High profitability with net margin of 19.38% and ROE of 38.44%
- Superior ROIC of 31.4% well above WACC
- Low debt levels with debt-to-assets at 7.62% and favorable interest coverage
- Strong asset turnover metrics and fixed asset turnover of 8.86
- Diverse brand portfolio including Hoka and UGG with growing direct-to-consumer sales
NIKE Weaknesses
- Elevated price-to-earnings ratio at 27.95 and price-to-book at 6.81 may signal overvaluation risk
- Neutral to unfavorable net margin at 6.95% compared to Deckers
- Moderate debt levels with debt-to-equity at 0.83
- Limited product segment diversification heavily reliant on footwear and apparel
- Neutral global ratios with some mixed financial metric status
Deckers Weaknesses
- Unfavorable current ratio of 3.72 indicates potential working capital inefficiency
- Zero dividend yield may deter income-focused investors
- Price-to-book ratio at 6.76 is unfavorable
- Smaller product segment diversification compared to NIKE
- Some unfavorable ratios increase overall risk profile
Both companies demonstrate favorable overall financial health with distinct strategic focuses. NIKE’s broad global presence and steady liquidity contrast with Deckers’ superior profitability and low leverage. Each faces valuation and diversification challenges that shape their competitive positioning.
The Moat Duel: Analyzing Competitive Defensibility
A structural moat shields long-term profits from competitive erosion. Only durable competitive advantages ensure sustained value creation:
NIKE, Inc.: Brand Power and Scale Moat
NIKE capitalizes on powerful brand loyalty and scale, reflected in steady gross margins near 43%. However, declining ROIC signals growing margin pressures in 2026.
Deckers Outdoor Corporation: Premium Niche and Innovation Moat
Deckers thrives on premium branding and product innovation, driving a robust 58% gross margin and a rising ROIC trend. Its focused portfolio fuels durable profitability gains.
Scale and Innovation: NIKE’s Brand vs. Deckers’ Niche Precision
Deckers’ moat is deeper, with a 22% ROIC premium over WACC and rising returns. NIKE’s scale matters but faces margin compression. Deckers is better positioned to defend and expand market share.
Which stock offers better returns?
The past year shows contrasting price movements between NIKE, Inc. and Deckers Outdoor Corporation, with notable volatility and shifting buyer dominance impacting their trading dynamics.
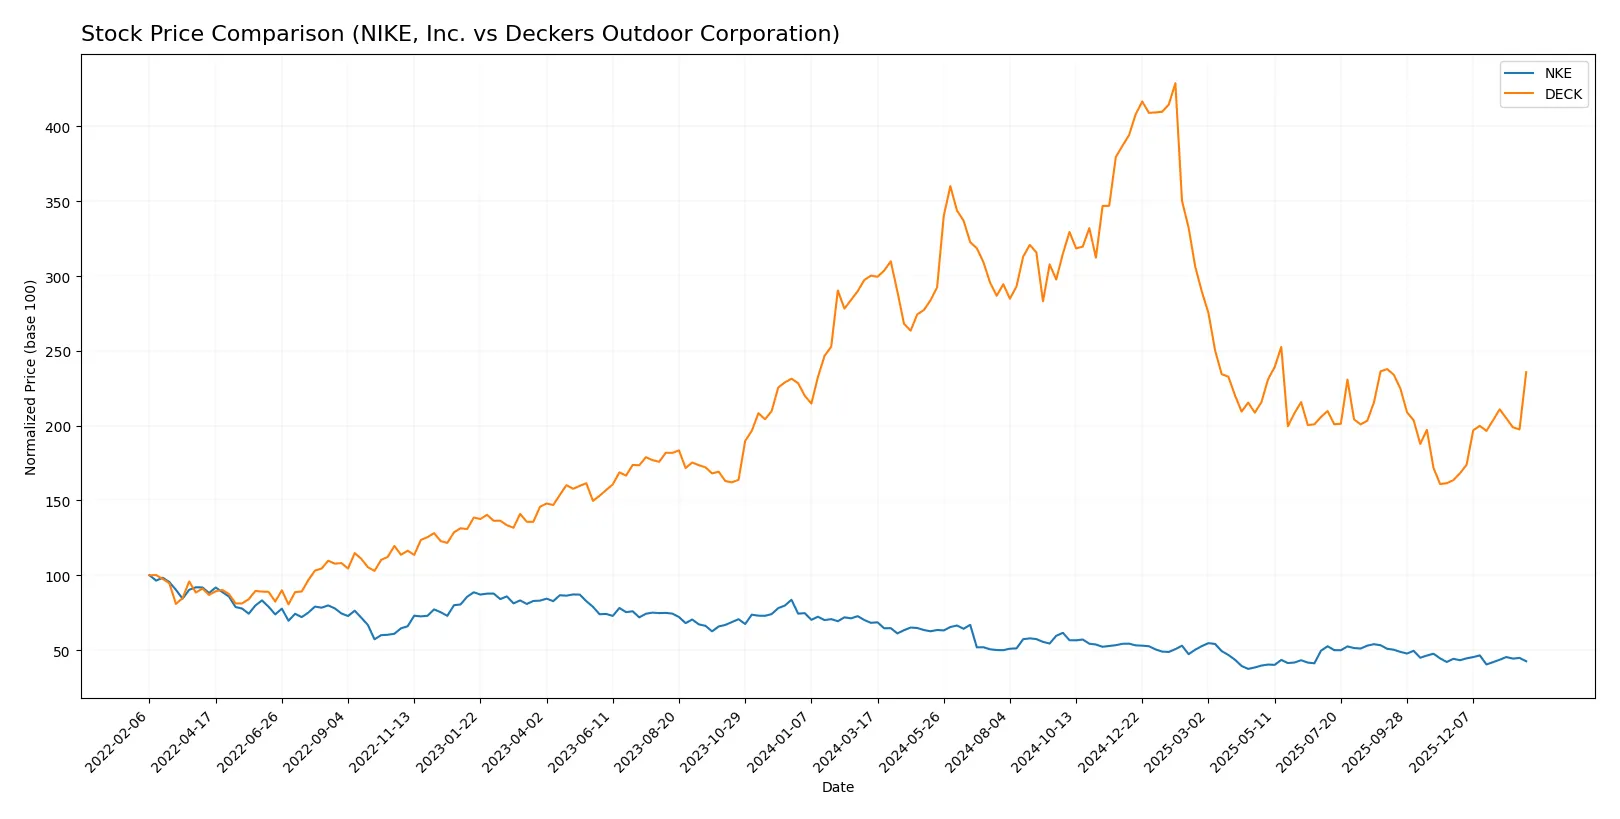
Trend Comparison
NIKE, Inc. shows a bearish trend over the past 12 months with a -37.67% price decline and accelerating downward momentum, hitting a low of 54.39 from a high near 100. Deckers Outdoor Corporation also displays a bearish trend overall, dropping -21.5% with higher volatility and acceleration, ranging between 81.5 and 217.16. In the recent three-month period, DECK reversed to a strong bullish trend, gaining 44.1%, while NKE continued slightly bearish with a -3.68% decline. Deckers has delivered higher recent market performance compared to NIKE’s sustained downward trend.
Target Prices
Analysts present a mixed but generally bullish outlook on NIKE, Inc. and Deckers Outdoor Corporation.
| Company | Target Low | Target High | Consensus |
|---|---|---|---|
| NIKE, Inc. | 62 | 110 | 75.35 |
| Deckers Outdoor Corporation | 90 | 161 | 119 |
NIKE’s consensus target at $75.35 suggests modest upside from the current $61.81 price. Deckers’ $119 target aligns closely with its $119.34 market price, indicating market expectations are well priced in.

Don’t Let Luck Decide Your Entry Point
Optimize your entry points with our advanced ProRealTime indicators. You’ll get efficient buy signals with precise price targets for maximum performance. Start outperforming now!
How do institutions grade them?
NIKE, Inc. Grades
This table summarizes recent grade actions from major grading firms for NIKE, Inc.
| Grading Company | Action | New Grade | Date |
|---|---|---|---|
| BTIG | Maintain | Buy | 2026-01-27 |
| Keybanc | Maintain | Overweight | 2026-01-22 |
| Needham | Downgrade | Hold | 2026-01-08 |
| RBC Capital | Maintain | Outperform | 2026-01-06 |
| B of A Securities | Maintain | Buy | 2025-12-19 |
| Needham | Maintain | Buy | 2025-12-19 |
| Piper Sandler | Maintain | Overweight | 2025-12-19 |
| Citigroup | Maintain | Neutral | 2025-12-19 |
| Wells Fargo | Maintain | Overweight | 2025-12-19 |
| Barclays | Maintain | Equal Weight | 2025-12-19 |
Deckers Outdoor Corporation Grades
The following table presents recent ratings from established grading agencies for Deckers Outdoor Corporation.
| Grading Company | Action | New Grade | Date |
|---|---|---|---|
| Needham | Maintain | Buy | 2026-01-30 |
| Goldman Sachs | Maintain | Sell | 2026-01-30 |
| Wells Fargo | Maintain | Equal Weight | 2026-01-30 |
| Telsey Advisory Group | Maintain | Market Perform | 2026-01-30 |
| Stifel | Maintain | Buy | 2026-01-30 |
| UBS | Maintain | Buy | 2026-01-30 |
| Piper Sandler | Maintain | Underweight | 2026-01-30 |
| Jefferies | Maintain | Hold | 2026-01-30 |
| Jefferies | Maintain | Hold | 2026-01-27 |
| Telsey Advisory Group | Maintain | Market Perform | 2026-01-26 |
Which company has the best grades?
NIKE, Inc. generally holds stronger grades with multiple “Buy,” “Overweight,” and “Outperform” ratings, while Deckers shows a more mixed profile including “Buy,” “Sell,” and “Underweight” grades. This divergence may influence investors toward perceived stability and consensus support in NIKE’s ratings.
Risks specific to each company
The following categories identify the critical pressure points and systemic threats facing both firms in the 2026 market environment:
1. Market & Competition
NIKE, Inc.
- Faces intense competition from global athletic brands with a broad product portfolio, requiring constant innovation and marketing investment.
Deckers Outdoor Corporation
- Competes in niche premium footwear segments but risks losing market share to larger, diversified competitors expanding into lifestyle and performance categories.
2. Capital Structure & Debt
NIKE, Inc.
- Maintains moderate leverage with a debt-to-equity ratio of 0.83, balancing growth financing and financial risk prudently.
Deckers Outdoor Corporation
- Exhibits low leverage with a debt-to-equity ratio of 0.11, signaling conservative capital structure and strong balance sheet resilience.
3. Stock Volatility
NIKE, Inc.
- Displays higher beta at 1.28, indicating greater sensitivity to market swings and elevated volatility risk.
Deckers Outdoor Corporation
- Shows lower beta at 1.15, reflecting more stable price movements and reduced market risk exposure.
4. Regulatory & Legal
NIKE, Inc.
- Exposed to global trade regulations and labor compliance issues, with potential risks from evolving tariffs and labor laws.
Deckers Outdoor Corporation
- Faces regulatory scrutiny in global markets, especially related to environmental standards and import regulations impacting supply chains.
5. Supply Chain & Operations
NIKE, Inc.
- Operates complex global supply chains vulnerable to disruptions from geopolitical tensions and rising input costs.
Deckers Outdoor Corporation
- Supply chain is more concentrated but benefits from focused supplier relationships, though still susceptible to operational bottlenecks.
6. ESG & Climate Transition
NIKE, Inc.
- Under pressure to meet aggressive sustainability targets; failure could impact brand reputation and investor appeal.
Deckers Outdoor Corporation
- Faces similar ESG challenges but has opportunities to leverage its premium branding to lead in sustainable product innovation.
7. Geopolitical Exposure
NIKE, Inc.
- Significant exposure to Asia-Pacific markets, subject to geopolitical tensions that could disrupt sales and manufacturing.
Deckers Outdoor Corporation
- More diversified geographically but still at risk from trade disputes and regulatory changes in key markets.
Which company shows a better risk-adjusted profile?
Deckers Outdoor Corporation presents a stronger risk-adjusted profile. Its low leverage and safer Altman Z-Score of 10.75 demonstrate financial stability. NIKE’s higher market beta and valuation multiples raise concerns despite solid operational metrics. Deckers’ recent 19.5% stock surge contrasts with NIKE’s 1.3% decline, underscoring investor confidence amid uncertainties.
Final Verdict: Which stock to choose?
NIKE, Inc. showcases its superpower in brand resilience and operational efficiency, maintaining solid returns despite recent profit pressure. Its declining profitability signals a point of vigilance. NIKE fits portfolios seeking established market presence with moderate growth tolerance.
Deckers Outdoor Corporation commands a strategic moat through superior margin expansion and a durable competitive advantage, evidenced by a robust and growing ROIC. It offers better financial stability than NIKE but trades with higher valuation scrutiny. Deckers suits growth-focused portfolios valuing strong capital allocation.
If you prioritize steady brand strength and operational scale, NIKE is the compelling choice due to its entrenched market position. However, if you seek accelerating profitability with durable competitive advantages, Deckers offers better stability and growth potential, albeit with higher valuation risks.
Disclaimer: Investment carries a risk of loss of initial capital. The past performance is not a reliable indicator of future results. Be sure to understand risks before making an investment decision.
Go Further
I encourage you to read the complete analyses of NIKE, Inc. and Deckers Outdoor Corporation to enhance your investment decisions: