In the fast-evolving world of enterprise software, Workday, Inc. and Dayforce Inc. stand out as prominent players specializing in human capital management and financial solutions. Both companies operate cloud-based platforms that streamline workforce and financial operations, targeting overlapping markets with innovative technology. For investors seeking growth and stability in the tech sector, this comparison will reveal which company offers the most compelling opportunity to add to your portfolio.
Table of contents
Companies Overview
I will begin the comparison between Workday and Dayforce by providing an overview of these two companies and their main differences.
Workday Overview
Workday, Inc. delivers enterprise cloud applications internationally, focusing on financial management, human capital management (HCM), planning, and analytics. Its solutions support CFOs and HR teams in managing accounting, payroll, recruitment, and employee experiences. Headquartered in Pleasanton, California, Workday serves diverse sectors including healthcare, education, technology, and retail, positioning itself as a comprehensive cloud software provider in the application software industry.
Dayforce Overview
Dayforce Inc specializes in cloud-based human capital management (HCM) software, offering integrated solutions for HR, payroll, benefits, workforce, and talent management. Serving mainly the US, Canada, and international markets, Dayforce targets small to large businesses through direct and third-party sales. Based in Minneapolis, Minnesota, the company emphasizes payroll and workforce solutions, operating primarily in the software application sector with a strong focus on HCM functionalities.
Key similarities and differences
Both Workday and Dayforce operate within the software application industry with a focus on cloud-based human capital management solutions. Workday offers a broader suite including financial management and analytics, while Dayforce concentrates specifically on HCM and payroll services. Workday is larger in market capitalization and workforce size, reflecting a more diversified portfolio, whereas Dayforce maintains a specialized approach targeting payroll and workforce management markets.
Income Statement Comparison
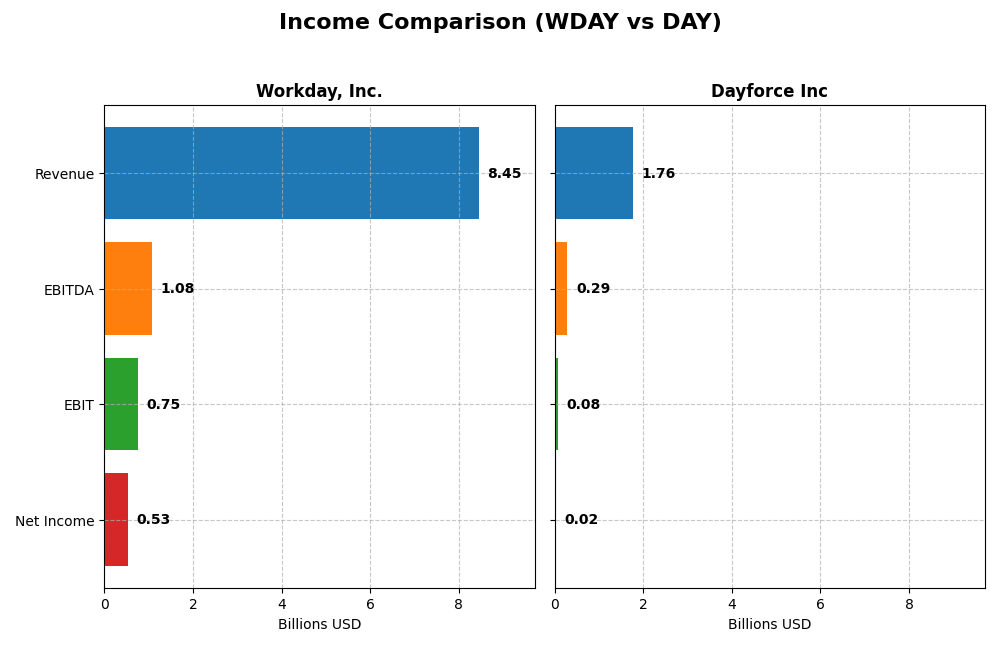
The table below compares the key income statement metrics of Workday, Inc. and Dayforce Inc for their most recent fiscal year, providing a snapshot of their financial performance.
| Metric | Workday, Inc. (WDAY) | Dayforce Inc (DAY) |
|---|---|---|
| Market Cap | 49.9B | 11.1B |
| Revenue | 8.45B | 1.76B |
| EBITDA | 1.08B | 288M |
| EBIT | 752M | 78.2M |
| Net Income | 526M | 18.1M |
| EPS | 1.98 | 0.11 |
| Fiscal Year | 2025 | 2024 |
Income Statement Interpretations
Workday, Inc.
Workday’s revenue climbed steadily from $4.32B in 2021 to $8.45B in 2025, nearly doubling over five years. Net income recovered from losses in early years to $526M in 2025. Margins remain strong, with a 75.5% gross margin and a 6.23% net margin in 2025. Despite a 16.35% revenue growth last year, net margin and EPS declined significantly, signaling margin pressure.
Dayforce Inc
Dayforce’s revenue rose consistently from $842M in 2020 to $1.76B in 2024, showing solid growth. Net income turned positive in recent years, reaching $18.1M in 2024 after losses earlier. The company maintains a favorable gross margin of 46.14%, though net margin is slim at 1.03%. Last year, revenue grew 16.27%, but EBIT and net margin contracted sharply, indicating operational challenges.
Which one has the stronger fundamentals?
Workday exhibits higher revenue scale and stronger gross and net margins compared to Dayforce. It shows impressive long-term growth in net income and EPS, albeit with recent margin softness. Dayforce’s fundamentals reflect steady growth but with thinner profitability and more recent volatility in earnings. Overall, Workday’s income statement suggests more robust profitability and scale advantages.
Financial Ratios Comparison
The table below presents the most recent financial ratios for Workday, Inc. and Dayforce Inc, reflecting their fiscal year 2025 and 2024 data respectively.
| Ratios | Workday, Inc. (2025) | Dayforce Inc (2024) |
|---|---|---|
| ROE | 5.82% | 0.71% |
| ROIC | 2.73% | 1.31% |
| P/E | 132.15 | 633.29 |
| P/B | 7.69 | 4.50 |
| Current Ratio | 1.85 | 1.13 |
| Quick Ratio | 1.85 | 1.13 |
| D/E | 0.37 | 0.48 |
| Debt-to-Assets | 18.70% | 13.52% |
| Interest Coverage | 3.64 | 2.56 |
| Asset Turnover | 0.47 | 0.19 |
| Fixed Asset Turnover | 5.36 | 7.46 |
| Payout ratio | 0 | 0 |
| Dividend yield | 0 | 0 |
Interpretation of the Ratios
Workday, Inc.
Workday shows a mix of strengths and weaknesses in its financial ratios. Strong liquidity is evident with a current ratio of 1.85 and favorable leverage metrics, while profitability ratios like ROE (5.82%) and ROIC (2.73%) are unfavorable. Market valuation ratios such as P/E (132.15) and P/B (7.69) are also high, indicating potential overvaluation. The company does not pay dividends, likely due to reinvestment in growth and R&D priorities.
Dayforce Inc
Dayforce exhibits predominantly weak financial ratios, with low profitability metrics: net margin at 1.03%, ROE at 0.71%, and ROIC at 1.31%, all unfavorable. Liquidity is moderate with a current ratio of 1.13, while debt metrics appear reasonable. The market values Dayforce with a high P/E of 633.29, signaling investor expectations. Like Workday, Dayforce pays no dividends, possibly reflecting a focus on growth and capital reinvestment.
Which one has the best ratios?
Workday holds a more balanced ratio profile, with 42.86% favorable ratios versus Dayforce’s 28.57%, which has a higher proportion of unfavorable metrics at 57.14%. Workday’s stronger liquidity and more controlled leverage contrast with Dayforce’s weaker profitability and interest coverage, positioning Workday as having comparatively better financial ratios overall.
Strategic Positioning
This section compares the strategic positioning of Workday, Inc. and Dayforce Inc, including their market position, key segments, and exposure to technological disruption:
Workday, Inc.
- Large market cap of $49.9B with NASDAQ listing, facing typical software industry competition.
- Focus on enterprise cloud applications, mainly subscription services and professional services.
- Incorporates machine learning and augmented analytics in applications, implying moderate technological disruption exposure.
Dayforce Inc
- Smaller market cap of $11.1B, listed on NYSE, competing in HCM software sector.
- Concentrated on cloud HCM platform and payroll solutions, targeting small to large businesses.
- Provides cloud-based HCM and payroll services, with ongoing innovation in cloud solutions.
Workday, Inc. vs Dayforce Inc Positioning
Workday’s diversified enterprise cloud applications contrast with Dayforce’s concentrated HCM and payroll focus. Workday benefits from broader industry coverage, while Dayforce targets niche payroll and workforce management segments, each with distinct business drivers and scale advantages.
Which has the best competitive advantage?
Both companies show slightly unfavorable MOAT evaluations due to ROIC below WACC but with growing profitability trends. Neither currently demonstrates a strong economic moat, indicating cautious assessment of their competitive advantages.
Stock Comparison
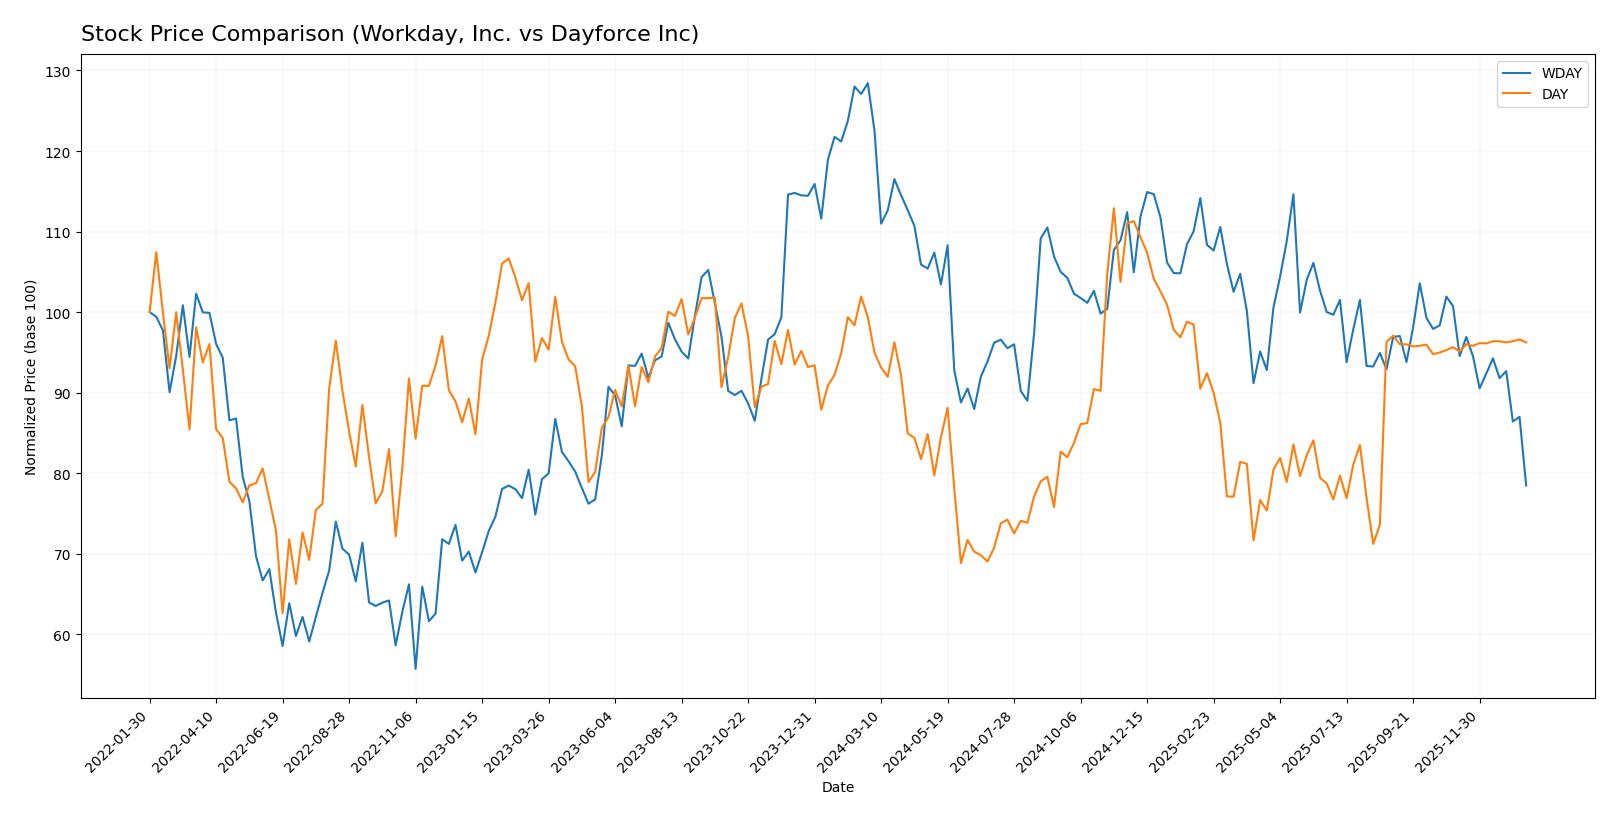
The stock price chart highlights significant bearish trends for both Workday, Inc. (WDAY) and Dayforce Inc (DAY) over the past 12 months, with varying degrees of deceleration and differing recent momentum.
Trend Analysis
Workday, Inc. (WDAY) experienced a bearish trend with a -38.91% price change over the past 12 months, showing deceleration and high volatility with a standard deviation of 20.22. The recent trend remains negative at -22.12%.
Dayforce Inc (DAY) also exhibited a bearish trend with a -3.16% price change over the same period, accompanied by deceleration and lower volatility (std dev 7.84). Its recent trend slightly improved, showing a 0.61% gain.
Comparing both stocks, WDAY suffered a much greater decline than DAY, which delivered the highest market performance despite a mild overall bearish trend.
Target Prices
The current analyst consensus indicates promising upside potential for both Workday, Inc. and Dayforce Inc.
| Company | Target High | Target Low | Consensus |
|---|---|---|---|
| Workday, Inc. | 320 | 235 | 274.47 |
| Dayforce Inc | 70 | 70 | 70 |
Analysts expect Workday’s stock to rise significantly from its current price of $186.86, suggesting substantial growth potential. Dayforce’s target price closely aligns with its current price of $69.16, indicating more stability with limited upside.
Analyst Opinions Comparison
This section compares analysts’ ratings and grades for Workday, Inc. and Dayforce Inc:
Rating Comparison
WDAY Rating
- Rating: B-, considered very favorable overall.
- Discounted Cash Flow Score: 4, indicating favorable.
- ROE Score: 3, a moderate rating for equity returns.
- ROA Score: 3, moderate effectiveness in asset use.
- Debt To Equity Score: 2, moderate financial risk.
- Overall Score: 2, moderate overall financial standing.
DAY Rating
- Rating: C-, also considered very favorable overall.
- Discounted Cash Flow Score: 2, indicating moderate.
- ROE Score: 1, rated very unfavorable for equity returns.
- ROA Score: 1, very unfavorable asset utilization.
- Debt To Equity Score: 2, moderate financial risk.
- Overall Score: 1, very unfavorable overall standing.
Which one is the best rated?
Based strictly on the provided data, Workday, Inc. holds a better overall rating and stronger scores in discounted cash flow, ROE, and ROA compared to Dayforce Inc, which shows weaker performance in these key areas.
Scores Comparison
Here is a comparison of the Altman Z-Score and Piotroski Score for both companies:
WDAY Scores
- Altman Z-Score: 4.41, indicating a safe financial zone.
- Piotroski Score: 6, reflecting average financial strength.
DAY Scores
- Altman Z-Score: 1.24, indicating financial distress.
- Piotroski Score: 5, reflecting average financial strength.
Which company has the best scores?
WDAY has a higher Altman Z-Score in the safe zone, while DAY is in the distress zone. Both have similar average Piotroski Scores. Based on these data, WDAY shows stronger financial stability.
Grades Comparison
Here is a detailed comparison of the grades assigned to Workday, Inc. and Dayforce Inc by reputable grading companies:
Workday, Inc. Grades
The following table summarizes recent grades from recognized financial institutions for Workday, Inc.:
| Grading Company | Action | New Grade | Date |
|---|---|---|---|
| Barclays | Maintain | Overweight | 2026-01-12 |
| RBC Capital | Maintain | Outperform | 2026-01-05 |
| TD Cowen | Maintain | Buy | 2025-11-26 |
| DA Davidson | Maintain | Neutral | 2025-11-26 |
| Wells Fargo | Maintain | Overweight | 2025-11-26 |
| Barclays | Maintain | Overweight | 2025-11-26 |
| Keybanc | Maintain | Overweight | 2025-11-26 |
| Citigroup | Maintain | Neutral | 2025-11-26 |
| JP Morgan | Maintain | Overweight | 2025-11-26 |
| UBS | Maintain | Neutral | 2025-11-26 |
The grades for Workday, Inc. consistently indicate a positive outlook, with multiple firms maintaining “Overweight” and “Buy” ratings.
Dayforce Inc Grades
The following table summarizes recent grades from recognized financial institutions for Dayforce Inc:
| Grading Company | Action | New Grade | Date |
|---|---|---|---|
| Needham | Maintain | Hold | 2025-10-30 |
| Stifel | Downgrade | Hold | 2025-09-19 |
| Citigroup | Downgrade | Neutral | 2025-09-17 |
| Wells Fargo | Upgrade | Equal Weight | 2025-08-22 |
| BMO Capital | Downgrade | Market Perform | 2025-08-22 |
| Keybanc | Downgrade | Sector Weight | 2025-08-22 |
| Needham | Downgrade | Hold | 2025-08-22 |
| Barclays | Maintain | Equal Weight | 2025-08-22 |
| Deutsche Bank | Maintain | Hold | 2025-08-22 |
| Jefferies | Maintain | Hold | 2025-08-21 |
Dayforce Inc’s grades show a trend toward more cautious ratings, with several downgrades and a concentration of “Hold” and “Equal Weight” recommendations.
Which company has the best grades?
Workday, Inc. has received stronger and more positive grades compared to Dayforce Inc, with multiple “Buy” and “Overweight” ratings versus Dayforce’s predominantly “Hold” and downgraded positions. This suggests a more favorable analyst sentiment for Workday, potentially impacting investor confidence and portfolio weighting decisions.
Strengths and Weaknesses
Below is a comparative overview of the key strengths and weaknesses of Workday, Inc. (WDAY) and Dayforce Inc (DAY) based on the most recent financial and operational data.
| Criterion | Workday, Inc. (WDAY) | Dayforce Inc (DAY) |
|---|---|---|
| Diversification | Moderate: Subscription services dominate with $7.72B in FY2025; professional services $728M | Moderate: Recurring revenue $1.52B in FY2024, with Cloud Dayforce as main segment |
| Profitability | Neutral to unfavorable: Net margin 6.23%, ROIC 2.73% below WACC 8.86% (value destroying) | Unfavorable: Net margin 1.03%, ROIC 1.31% below WACC 8.69% (value destroying) |
| Innovation | Growing ROIC trend (+162%), indicating improving capital efficiency | Strong ROIC growth (+2304%), signaling rapid improvement in profitability |
| Global presence | Strong global reach with steady subscription growth over years | Growing recurring revenues but smaller scale and presence compared to WDAY |
| Market Share | Established player with significant subscription base and steady revenue growth | Smaller but fast-growing player, focused on cloud HR platforms |
Key takeaways: Both companies are currently shedding value as ROIC remains below WACC, despite strong upward ROIC trends signaling improving profitability and operational efficiency. Workday is larger with a more established global footprint, while Dayforce shows rapid growth but from a smaller base. Investors should weigh growth potential against current profitability challenges.
Risk Analysis
Below is a comparative table outlining key risk factors for Workday, Inc. (WDAY) and Dayforce Inc. (DAY) as of the most recent fiscal years:
| Metric | Workday, Inc. (WDAY) | Dayforce Inc. (DAY) |
|---|---|---|
| Market Risk | Beta 1.14 (moderate volatility) | Beta 1.18 (slightly higher volatility) |
| Debt level | Debt/Equity 0.37 (favorable) | Debt/Equity 0.48 (favorable but higher leverage) |
| Regulatory Risk | Moderate (US-based tech sector) | Moderate (US/Canada tech sector) |
| Operational Risk | Medium (cloud services complexity) | Medium (HCM platform integration challenges) |
| Environmental Risk | Low (software company) | Low (software company) |
| Geopolitical Risk | Moderate (global client exposure) | Moderate (international presence) |
Workday’s moderate market risk and solid debt profile mitigate financial distress, supported by a strong Altman Z-score (4.41, safe zone). Dayforce shows higher financial risk with a lower Z-score (1.24, distress zone), indicating potential bankruptcy risk. Both firms face operational and geopolitical risks typical for global SaaS providers, but Dayforce’s weaker profitability and interest coverage amplify its vulnerability. Investors should weigh Workday’s relatively stable financial health against Dayforce’s higher leverage and distress signals when considering portfolio inclusion.
Which Stock to Choose?
Workday, Inc. (WDAY) shows a favorable income evolution with strong revenue and net income growth over 2021-2025. Its financial ratios are mixed, with favorable liquidity and debt metrics but unfavorable profitability and valuation ratios. The company carries moderate debt and holds a very favorable overall rating of B-.
Dayforce Inc (DAY) has a favorable income evolution marked by solid revenue and net income growth across 2020-2024, though recent profitability declined. Its financial ratios are predominantly unfavorable, especially profitability and valuation, despite decent debt metrics. The company has higher debt risk indicators and a very favorable rating of C-.
Considering the ratings and comprehensive financial evaluations, WDAY might appear more suitable for investors prioritizing growth and quality due to its stronger income growth and balanced financial ratios. Conversely, DAY could be of interest to risk-tolerant investors seeking potential turnaround opportunities despite weaker profitability metrics.
Disclaimer: Investment carries a risk of loss of initial capital. The past performance is not a reliable indicator of future results. Be sure to understand risks before making an investment decision.
Go Further
I encourage you to read the complete analyses of Workday, Inc. and Dayforce Inc to enhance your investment decisions: