In the dynamic software industry, Unity Software Inc. and Dayforce Inc. stand out with distinct yet overlapping market focuses. Unity excels in real-time 3D content platforms for diverse devices, while Dayforce leads in cloud-based human capital management solutions. Both innovate within the technology sector but target different user needs. This article will explore their strengths and risks to help you decide which company presents the most compelling investment opportunity in 2026.
Table of contents
Companies Overview
I will begin the comparison between Unity Software Inc. and Dayforce Inc by providing an overview of these two companies and their main differences.
Unity Software Inc. Overview
Unity Software Inc. develops and operates a real-time 3D content platform aimed at creators across mobile, PC, console, and AR/VR devices. Founded in 2004 and based in San Francisco, Unity serves developers, artists, and engineers globally with tools to create, run, and monetize interactive 2D and 3D content. The company’s market cap stands at $17.5B, reflecting its significant role in the software application industry.
Dayforce Inc Overview
Dayforce Inc. provides cloud-based human capital management (HCM) software, including HR, payroll, benefits, workforce, and talent management solutions. Headquartered in Minneapolis and incorporated in 2013, Dayforce serves clients primarily in the US and Canada with a market capitalization of $11.1B. The company also offers payroll bureau services and targets both large enterprises and small businesses via direct and third-party sales.
Key similarities and differences
Both Unity and Dayforce operate in the software application sector and trade on the NYSE, but their business models differ substantially. Unity focuses on interactive 3D content creation platforms for diverse digital devices, while Dayforce specializes in cloud HCM software for workforce management. Unity’s customer base is content creators and developers, whereas Dayforce targets HR departments and payroll services, reflecting distinct market niches within the broader tech industry.
Income Statement Comparison
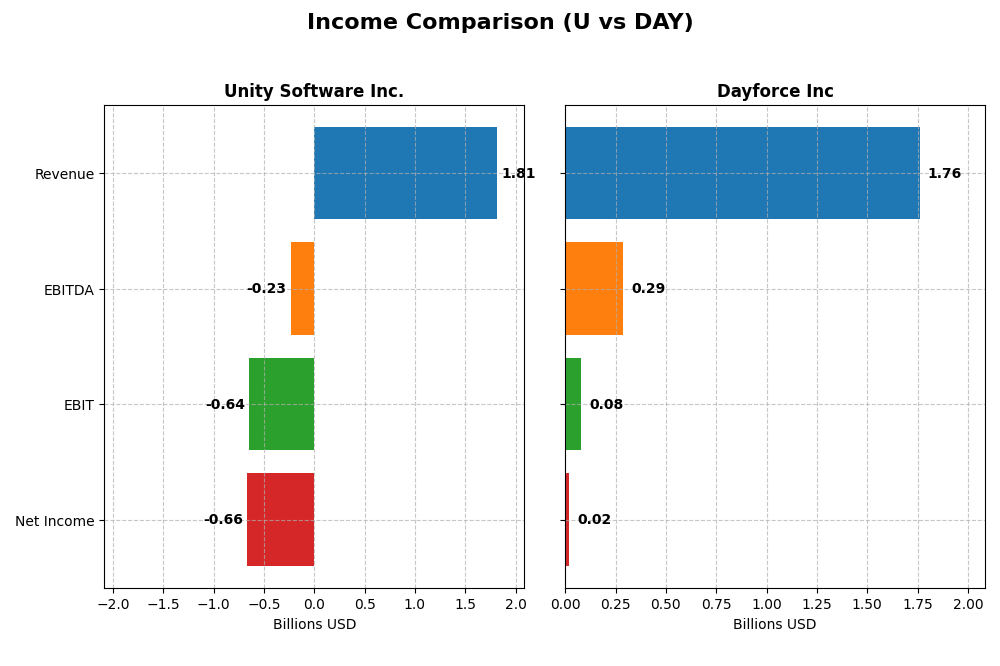
The table below compares the key income statement metrics for Unity Software Inc. and Dayforce Inc for the fiscal year 2024, providing a snapshot of their financial performance.
| Metric | Unity Software Inc. | Dayforce Inc |
|---|---|---|
| Market Cap | 17.5B | 11.1B |
| Revenue | 1.81B | 1.76B |
| EBITDA | -235M | 288M |
| EBIT | -644M | 78.2M |
| Net Income | -664M | 18.1M |
| EPS | -1.68 | 0.11 |
| Fiscal Year | 2024 | 2024 |
Income Statement Interpretations
Unity Software Inc.
Unity Software Inc. showed revenue growth of 135% from 2020 to 2024 but experienced a 17.1% decline in revenue in 2024 alone. Gross margins remained strong at 73.5%, yet EBIT and net margins stayed negative, reflecting ongoing losses. The 2024 year saw an improvement in EBIT by 16.8% and a slight EPS growth of 22.2%, signaling some operational progress despite overall unfavorable net income trends.
Dayforce Inc
Dayforce Inc. achieved consistent revenue growth, increasing by 109% over five years and 16.3% in 2024. Gross margin was moderate at 46.1%, with EBIT and net margins positive but showing some contraction in 2024. While EBIT fell by 40.8% and net margin dropped 71.6% last year, the company’s long-term net income and EPS growth were robust, with over 500% increases since 2020, indicating strengthening profitability fundamentals.
Which one has the stronger fundamentals?
Dayforce presents stronger fundamentals overall, backed by positive net income, improving margins, and significant net income growth over the period. Unity, despite higher gross margins, continues to report substantial losses with a negative global income statement assessment. Dayforce’s favorable revenue and profitability trends contrast with Unity’s ongoing challenges in translating growth into net earnings.
Financial Ratios Comparison
The table below presents the most recent fiscal year (2024) financial ratios for Unity Software Inc. and Dayforce Inc, offering a side-by-side view of key performance and financial health metrics.
| Ratios | Unity Software Inc. (U) | Dayforce Inc (DAY) |
|---|---|---|
| ROE | -20.8% | 0.71% |
| ROIC | -12.8% | 1.31% |
| P/E | -13.4 | 633.3 |
| P/B | 2.79 | 4.50 |
| Current Ratio | 2.50 | 1.13 |
| Quick Ratio | 2.50 | 1.13 |
| D/E | 0.74 | 0.48 |
| Debt-to-Assets | 34.9% | 13.5% |
| Interest Coverage | -32.1 | 2.56 |
| Asset Turnover | 0.27 | 0.19 |
| Fixed Asset Turnover | 18.3 | 7.46 |
| Payout ratio | 0 | 0 |
| Dividend yield | 0% | 0% |
Interpretation of the Ratios
Unity Software Inc.
Unity Software shows mixed financial ratios with several unfavorable metrics, including negative net margin (-36.63%) and return on equity (-20.81%), indicating profitability challenges. Its current and quick ratios of 2.5 are favorable, reflecting good short-term liquidity. The company does not pay dividends, which aligns with its negative earnings and focus on reinvestment and growth.
Dayforce Inc
Dayforce exhibits mostly unfavorable ratios with a low net margin of 1.03% and a high price-to-earnings ratio of 633.29, signaling valuation concerns. However, it has a favorable debt-to-equity ratio (0.48) and quick ratio (1.13), suggesting moderate financial stability. Like Unity, Dayforce does not pay dividends, likely due to reinvestment priorities and growth strategies.
Which one has the best ratios?
Both companies face profitability and valuation challenges, but Unity’s stronger liquidity ratios and slightly better asset turnover contrast with Dayforce’s better leverage and tangible asset utilization. Overall, Unity’s ratios are slightly unfavorable, while Dayforce’s are categorized as unfavorable, reflecting a marginally more robust financial position for Unity.
Strategic Positioning
This section compares the strategic positioning of Unity Software Inc. and Dayforce Inc, covering Market position, Key segments, and exposure to technological disruption:
Unity Software Inc.
- Market position and competitive pressure
- Key segments and business drivers
- Exposure to technological disruption
Dayforce Inc
- Market cap of $17.5B; software platform for interactive real-time 3D content; operates globally from San Francisco
- Revenue mainly from Create Solutions and Operate Solutions focused on 2D/3D content creation and operation
- Positioned in evolving interactive 3D and AR/VR software markets with potential for innovation impact
Unity Software Inc. vs Dayforce Inc Positioning
Unity offers a diversified platform serving multiple industries with interactive 2D/3D content, while Dayforce concentrates on human capital management software. Unity’s broader content creation focus contrasts with Dayforce’s specialized cloud HR and payroll services, reflecting different market scopes and growth drivers.
Which has the best competitive advantage?
Both companies are currently shedding value, but Dayforce shows improving profitability with a growing ROIC trend, suggesting a slightly more favorable competitive advantage compared to Unity’s declining ROIC and very unfavorable moat status.
Stock Comparison
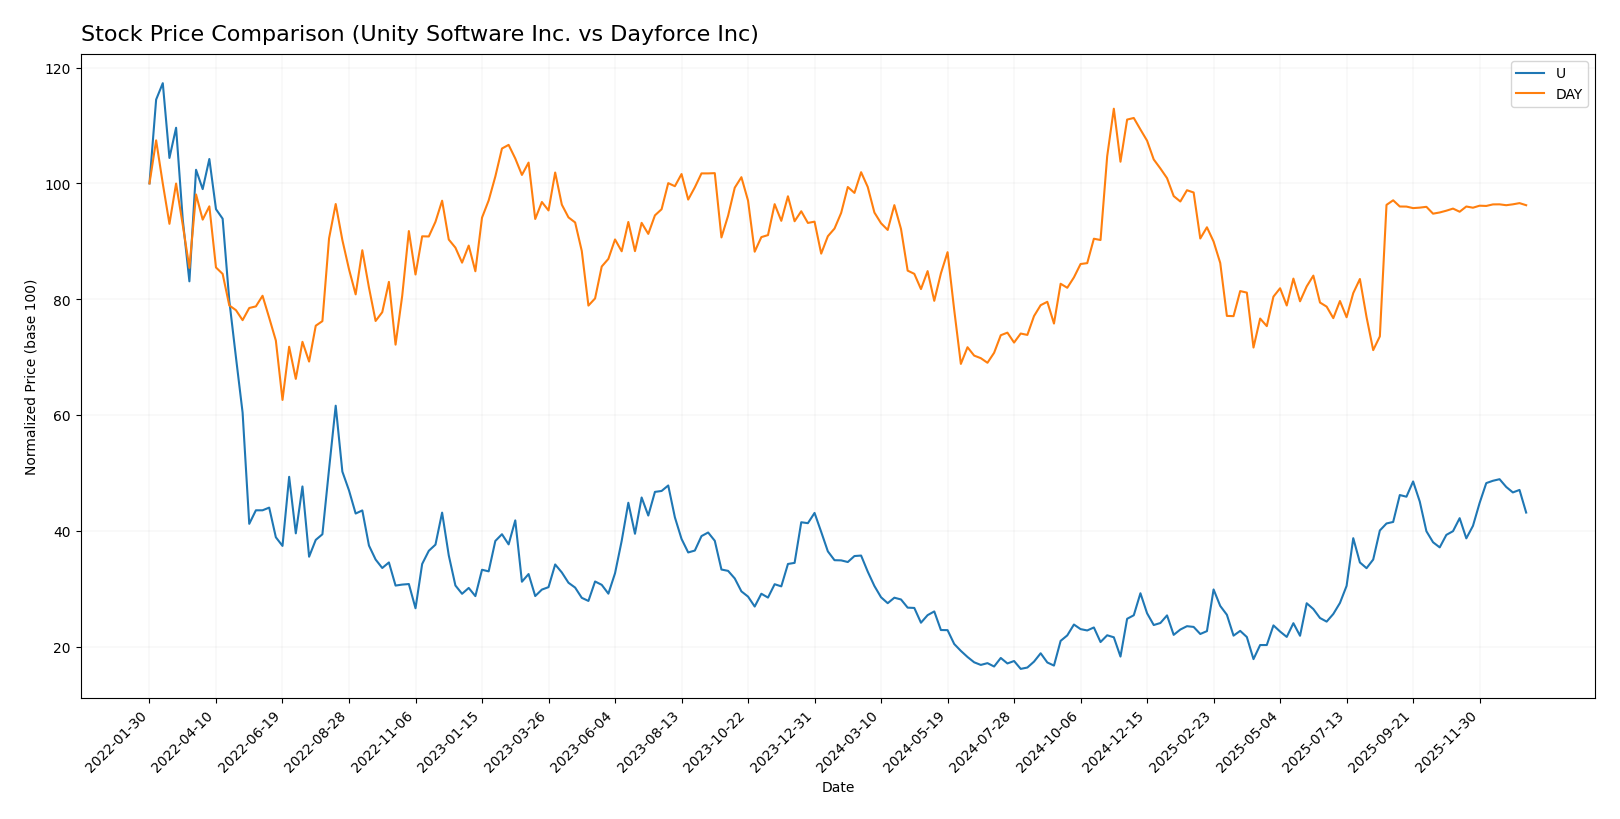
The stock price movements over the past 12 months reveal distinct dynamics, with Unity Software Inc. showing a strong upward acceleration while Dayforce Inc experienced a moderate decline and recent stabilization.
Trend Analysis
Unity Software Inc. exhibits a bullish trend with a 31.0% price increase over the past year, marked by acceleration and a high volatility level at 9.04 std deviation. The stock reached a peak of 46.42 and a low of 15.32.
Dayforce Inc shows a bearish trend, declining by 3.16% over the last 12 months with deceleration. Its volatility stands at 7.84 std deviation, and the stock traded between 49.46 and 81.14 during this period.
Comparing the two, Unity Software Inc. delivered the highest market performance with a clear bullish acceleration, whereas Dayforce Inc faced a mild bearish trend with recent near-neutral movement.
Target Prices
Analysts present a cautiously optimistic consensus for Unity Software Inc. and Dayforce Inc.
| Company | Target High | Target Low | Consensus |
|---|---|---|---|
| Unity Software Inc. | 60 | 39 | 50.98 |
| Dayforce Inc | 70 | 70 | 70 |
The target consensus for Unity Software at 50.98 suggests upside potential from its current price of 40.95. Dayforce’s consensus target of 70 closely aligns with its current price of 69.16, indicating stable market expectations.
Analyst Opinions Comparison
This section compares analysts’ ratings and grades for Unity Software Inc. (U) and Dayforce Inc (DAY):
Rating Comparison
U Rating
- Rating: D+, rated Very Favorable overall
- Discounted Cash Flow Score: 1, Very Unfavorable
- ROE Score: 1, Very Unfavorable
- ROA Score: 1, Very Unfavorable
- Debt To Equity Score: 1, Very Unfavorable
- Overall Score: 1, Very Unfavorable
DAY Rating
- Rating: C-, rated Very Favorable overall
- Discounted Cash Flow Score: 2, Moderate
- ROE Score: 1, Very Unfavorable
- ROA Score: 1, Very Unfavorable
- Debt To Equity Score: 2, Moderate
- Overall Score: 1, Very Unfavorable
Which one is the best rated?
Based strictly on the provided data, DAY holds a better rating (C-) than U (D+). DAY also has higher scores for discounted cash flow and debt-to-equity, indicating a moderately better financial outlook compared to U.
Scores Comparison
Here is the comparison of the Altman Z-Score and Piotroski Score for Unity Software Inc. and Dayforce Inc:
Unity Software Inc. Scores
- Altman Z-Score: 2.93, in the grey zone indicating moderate bankruptcy risk.
- Piotroski Score: 4, representing average financial strength.
Dayforce Inc Scores
- Altman Z-Score: 1.24, in the distress zone indicating high bankruptcy risk.
- Piotroski Score: 5, also indicating average financial strength.
Which company has the best scores?
Unity Software has a higher Altman Z-Score, placing it in a safer financial zone than Dayforce, which is in distress. Dayforce shows a slightly better Piotroski Score, but both remain average overall.
Grades Comparison
Here is a comparison of the recent grades assigned to Unity Software Inc. and Dayforce Inc.:
Unity Software Inc. Grades
This table summarizes recent grades from verified financial institutions for Unity Software Inc.:
| Grading Company | Action | New Grade | Date |
|---|---|---|---|
| Morgan Stanley | Maintain | Overweight | 2026-01-13 |
| Goldman Sachs | Maintain | Neutral | 2026-01-13 |
| Wells Fargo | Maintain | Overweight | 2026-01-08 |
| Jefferies | Maintain | Buy | 2026-01-05 |
| Piper Sandler | Upgrade | Overweight | 2025-12-11 |
| BTIG | Upgrade | Buy | 2025-12-11 |
| Wells Fargo | Upgrade | Overweight | 2025-12-05 |
| Arete Research | Upgrade | Buy | 2025-12-01 |
| Citigroup | Maintain | Buy | 2025-11-11 |
| Wells Fargo | Maintain | Equal Weight | 2025-11-07 |
Unity Software Inc. shows a clear positive trend with several upgrades and strong buy-related ratings from major institutions.
Dayforce Inc Grades
This table summarizes recent grades from verified financial institutions for Dayforce Inc:
| Grading Company | Action | New Grade | Date |
|---|---|---|---|
| Needham | Maintain | Hold | 2025-10-30 |
| Stifel | Downgrade | Hold | 2025-09-19 |
| Citigroup | Downgrade | Neutral | 2025-09-17 |
| Wells Fargo | Upgrade | Equal Weight | 2025-08-22 |
| BMO Capital | Downgrade | Market Perform | 2025-08-22 |
| Keybanc | Downgrade | Sector Weight | 2025-08-22 |
| Needham | Downgrade | Hold | 2025-08-22 |
| Barclays | Maintain | Equal Weight | 2025-08-22 |
| Deutsche Bank | Maintain | Hold | 2025-08-22 |
| Jefferies | Maintain | Hold | 2025-08-21 |
Dayforce Inc’s grades indicate a more cautious or neutral stance, with multiple downgrades and a consensus around hold or equal weight.
Which company has the best grades?
Unity Software Inc. has received significantly better grades overall, with multiple buy and overweight ratings and recent upgrades. This generally indicates stronger confidence from analysts, potentially translating into more positive investor sentiment compared to Dayforce Inc., which has mostly hold or neutral grades and some downgrades.
Strengths and Weaknesses
Below is a comparative overview of key strengths and weaknesses for Unity Software Inc. (U) and Dayforce Inc (DAY) based on the latest financial and operational data.
| Criterion | Unity Software Inc. (U) | Dayforce Inc (DAY) |
|---|---|---|
| Diversification | Moderate: Revenue split between Create (614M) and Operate Solutions (1.2B), with some strategic partnerships | High: Diverse cloud services with strong recurring revenue (1.5B) and professional services (243M) |
| Profitability | Weak: Negative net margin (-36.6%) and ROIC (-12.8%), shedding value with declining profitability | Weak but improving: Slightly positive net margin (1.0%) and ROIC (1.3%), increasing profitability trend |
| Innovation | Moderate: Strong fixed asset turnover (18.35) indicating efficient use of assets in innovative segments | Moderate: Fixed asset turnover lower (7.46) but invests in cloud-based HR/payroll solutions |
| Global presence | Established global software presence via game development and operation platforms | Primarily North America-focused cloud HR/payroll service provider |
| Market Share | Significant in gaming software tools but challenged by value destruction indicated by ROIC | Growing in cloud HR/payroll market with increasing recurring revenue and improving financials |
Key takeaways: Unity Software struggles with profitability and value creation despite solid market presence and asset efficiency. Dayforce shows signs of recovery with growing profitability and recurring revenues, though still facing challenges in margins and valuation. Investors should weigh growth potential against current financial weakness.
Risk Analysis
Below is a comparative risk table for Unity Software Inc. (U) and Dayforce Inc. (DAY) based on the most recent 2024 financial data and market conditions.
| Metric | Unity Software Inc. (U) | Dayforce Inc. (DAY) |
|---|---|---|
| Market Risk | High beta (2.05), volatile price swings | Moderate beta (1.18), more stable price |
| Debt level | Moderate debt-to-equity (0.74), neutral risk | Low debt-to-equity (0.48), favorable risk |
| Regulatory Risk | Moderate, tech sector subject to data/privacy rules | Moderate, HCM sector faces compliance regulations |
| Operational Risk | Negative margins and returns, operational inefficiencies | Low positive margin but operational challenges remain |
| Environmental Risk | Low, software industry with limited direct impact | Low, primarily cloud-based services |
| Geopolitical Risk | Moderate, global operations across multiple countries | Moderate, international market exposure |
The most significant risks are Unity’s high market volatility and negative profitability metrics, increasing financial vulnerability. Dayforce, while facing some operational and valuation concerns, benefits from lower debt and a steadier market profile. Investors should watch Unity’s continuing losses and Dayforce’s high P/E ratio as key risk factors.
Which Stock to Choose?
Unity Software Inc. (U) shows a declining income with a 17.1% revenue drop in 2024 and unfavorable profitability ratios, including negative ROE at -20.81% and a slightly unfavorable global financial ratio stance. Its debt level is moderate with a 0.74 debt-to-equity ratio, but the company is rated D+ with a very unfavorable overall score, indicating significant financial challenges.
Dayforce Inc. (DAY) reports positive revenue growth of 16.27% in 2024 and a favorable global income statement evaluation. Despite low profitability with a 0.71% ROE and 1.03% net margin, its financial ratios are largely unfavorable but with some favorable debt metrics (debt-to-equity 0.48). The company holds a C- rating, also with a very unfavorable overall score, reflecting ongoing struggles but improving profitability trends.
For investors prioritizing growth, Unity’s recent bullish price trend and accelerating momentum might appear attractive despite its financial weaknesses. Conversely, those valuing improving profitability and moderate debt may find Dayforce’s slight income and ROIC improvements more aligned with a cautious profile. Both companies carry risks, and their ratings suggest investors should carefully consider their risk tolerance and investment horizon.
Disclaimer: Investment carries a risk of loss of initial capital. The past performance is not a reliable indicator of future results. Be sure to understand risks before making an investment decision.
Go Further
I encourage you to read the complete analyses of Unity Software Inc. and Dayforce Inc to enhance your investment decisions: