In today’s fast-evolving tech landscape, Uber Technologies, Inc. and Dayforce Inc. stand out by transforming how services and workforce management operate globally. Both companies compete in the software application industry but focus on distinct yet overlapping innovation strategies—Uber revolutionizes mobility and delivery, while Dayforce reshapes human capital management with cloud solutions. This article will help you decide which company presents the most compelling investment opportunity in 2026.
Table of contents
Companies Overview
I will begin the comparison between Uber Technologies, Inc. and Dayforce Inc by providing an overview of these two companies and their main differences.
Uber Technologies, Inc. Overview
Uber Technologies, Inc. operates proprietary technology applications globally, connecting consumers with independent providers for ride-sharing, delivery, and freight services. Its business segments include Mobility, Delivery, and Freight, offering a range of vehicle rides, meal and goods delivery, and logistics solutions. Founded in 2009 and headquartered in San Francisco, Uber is a leading player in the software application industry with a market cap of approximately 176B USD.
Dayforce Inc Overview
Dayforce Inc. is a human capital management software company providing cloud-based HR, payroll, benefits, workforce, and talent management solutions. It serves various markets through its Dayforce and Powerpay platforms and payroll bureau services. Incorporated in 2013 and based in Minneapolis, Dayforce focuses on the technology sector with a market capitalization near 11B USD, targeting both small businesses and larger enterprises internationally.
Key similarities and differences
Both Uber and Dayforce operate in the software application industry with a strong focus on technology-driven solutions. Uber’s business model centers on connecting consumers with service providers in mobility, delivery, and freight, while Dayforce specializes in cloud-based human capital management software. Uber’s market cap is significantly larger, reflecting its broader global footprint and diversified segments compared to Dayforce’s more specialized HCM offerings.
Income Statement Comparison
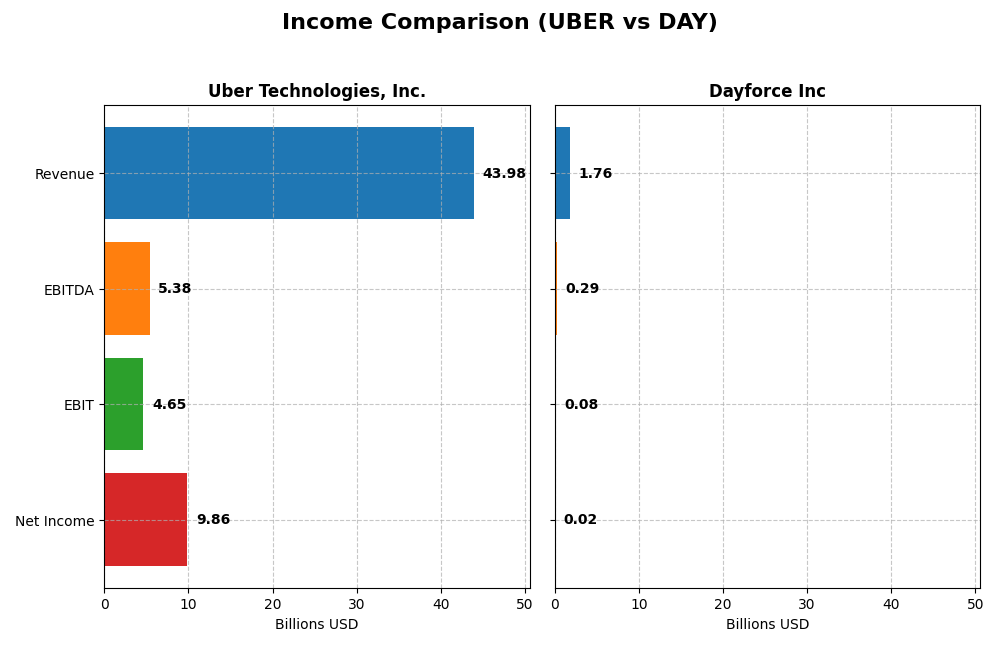
Below is a side-by-side income statement comparison for Uber Technologies, Inc. and Dayforce Inc for the fiscal year 2024, highlighting key financial metrics.
| Metric | Uber Technologies, Inc. | Dayforce Inc |
|---|---|---|
| Market Cap | 176.3B | 11.1B |
| Revenue | 43.98B | 1.76B |
| EBITDA | 5.39B | 288M |
| EBIT | 4.65B | 78.2M |
| Net Income | 9.81B | 18.1M |
| EPS | 4.71 | 0.11 |
| Fiscal Year | 2024 | 2024 |
Income Statement Interpretations
Uber Technologies, Inc.
Uber has shown strong growth in revenue and net income from 2020 to 2024, with revenue rising from 11.1B to 44B and net income improving from a loss to 9.8B. Margins have notably improved, with a gross margin of 39.4% and a net margin of 22.41% in 2024. The latest year saw significant acceleration in profitability and margin expansion, reflecting solid operational leverage.
Dayforce Inc
Dayforce’s revenue increased steadily from 842M in 2020 to 1.76B in 2024, with net income turning positive only recently at 18M. Gross margin remains strong at 46.14%, but EBIT and net margins are relatively low or neutral at 4.44% and 1.03%, respectively. The most recent year recorded slower EBIT and net margin growth, with some unfavorable operating expense trends despite solid revenue gains.
Which one has the stronger fundamentals?
Uber exhibits stronger fundamentals with consistently favorable margin improvements, rapid net income growth, and robust profitability metrics over the period. Dayforce, while growing revenue and improving net income, shows mixed margin results and recent declines in EBIT and net margin growth, indicating more operational challenges. Overall, Uber’s income statement performance is more favorable across key financial measures.
Financial Ratios Comparison
The table below presents a side-by-side comparison of key financial ratios for Uber Technologies, Inc. and Dayforce Inc, based on their most recent fiscal year data from 2024.
| Ratios | Uber Technologies, Inc. | Dayforce Inc |
|---|---|---|
| ROE | 45.7% | 0.7% |
| ROIC | 6.8% | 1.3% |
| P/E | 12.8 | 633.3 |
| P/B | 5.9 | 4.5 |
| Current Ratio | 1.07 | 1.13 |
| Quick Ratio | 1.07 | 1.13 |
| D/E (Debt-to-Equity) | 0.53 | 0.48 |
| Debt-to-Assets | 22.3% | 13.5% |
| Interest Coverage | 5.35 | 2.56 |
| Asset Turnover | 0.86 | 0.19 |
| Fixed Asset Turnover | 14.1 | 7.5 |
| Payout ratio | 0 | 0 |
| Dividend yield | 0 | 0 |
Interpretation of the Ratios
Uber Technologies, Inc.
Uber shows a generally favorable ratio profile with a strong net margin of 22.41% and an impressive return on equity at 45.72%. However, the high price-to-book ratio at 5.86 is an area of concern. Liquidity ratios are stable, and debt metrics are mostly favorable. Uber does not pay dividends, likely prioritizing reinvestment and growth over shareholder distributions.
Dayforce Inc
Dayforce displays weak profitability ratios, including a net margin of 1.03% and a return on equity below 1%, reflecting operational challenges. The very high P/E ratio of 633.29 and low asset turnover also raise flags. Liquidity and debt ratios are relatively solid, but interest coverage is low. Dayforce does not pay dividends, suggesting a focus on reinvestment and development.
Which one has the best ratios?
Uber presents a more favorable financial ratio profile overall, with stronger profitability and coverage metrics compared to Dayforce. Dayforce’s ratios reflect operational inefficiencies and higher risk, while Uber balances growth with improved returns, despite some valuation concerns. Thus, Uber’s ratios are relatively superior based on the given data.
Strategic Positioning
This section compares the strategic positioning of Uber Technologies, Inc. and Dayforce Inc, including Market position, Key segments, and disruption:
Uber Technologies, Inc.
- Large global presence in mobility, delivery, and freight markets facing competitive pressure worldwide.
- Operates three main segments: Mobility, Delivery, and Freight driving revenue growth across diverse transportation and logistics services.
- Exposure to technological disruption via proprietary tech platforms connecting consumers with service providers in multiple industries.
Dayforce Inc
- Focused human capital management software provider targeting payroll and workforce management markets.
- Provides cloud HCM platforms with payroll, benefits, and talent management, including solutions for small businesses.
- Faces disruption risks in cloud-based HR software but leverages SaaS delivery and direct sales channels.
Uber vs Dayforce Positioning
Uber’s diversified approach spans transportation and delivery sectors with large market scale, while Dayforce concentrates on cloud HCM software with recurring revenue streams. Uber’s broader footprint offers scale advantages, whereas Dayforce’s focus targets specialized payroll and HR solutions.
Which has the best competitive advantage?
Both companies show slightly unfavorable MOAT status with value destruction, but growing ROIC indicates improving profitability. Uber’s larger scale contrasts with Dayforce’s niche focus, reflecting different competitive dynamics and capital efficiency challenges.
Stock Comparison
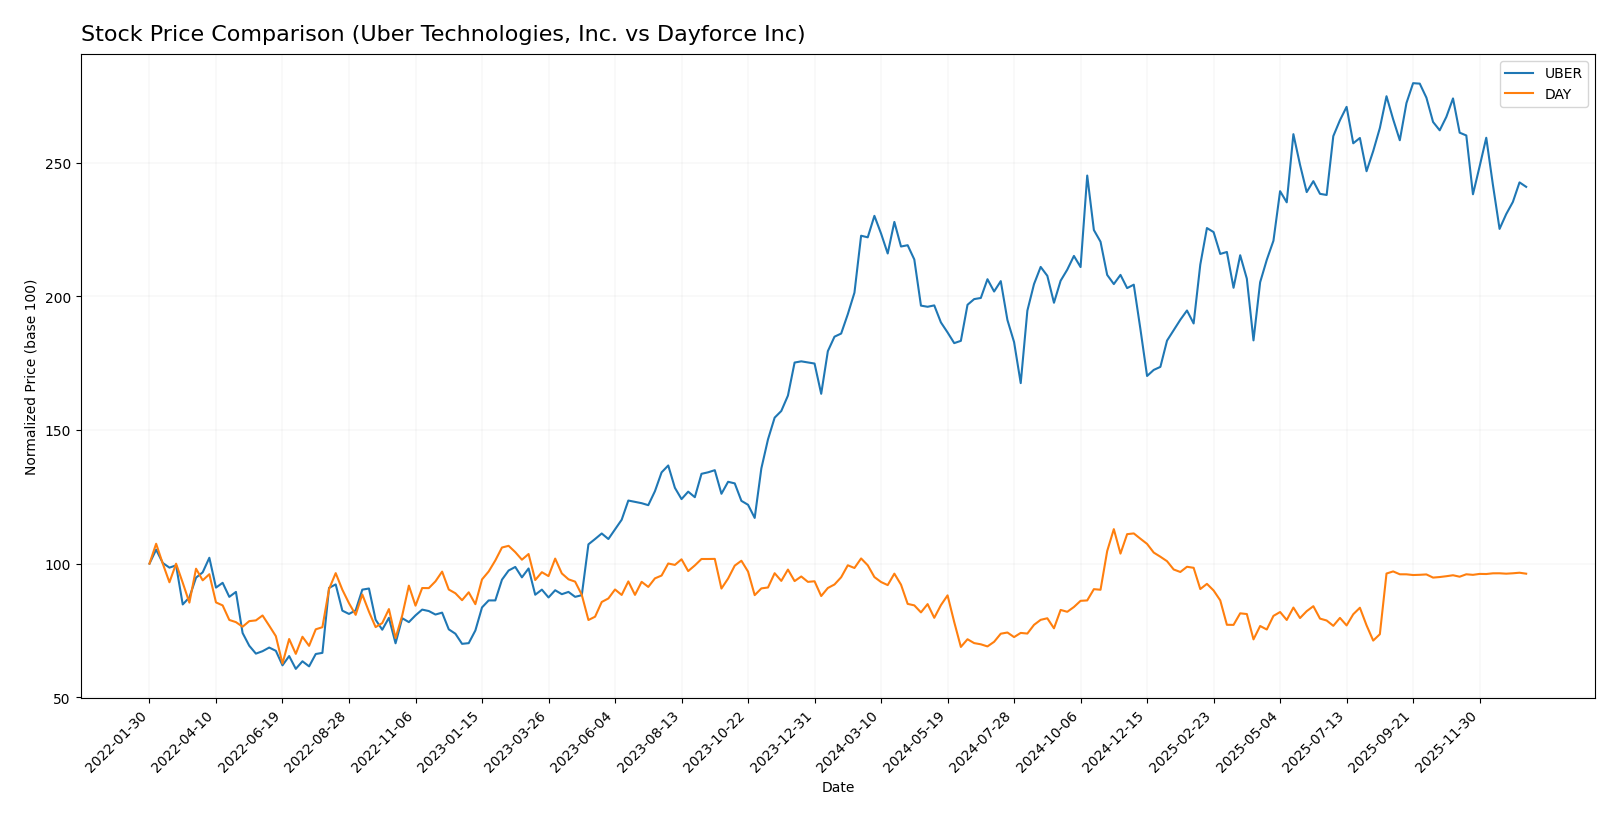
The past year shows contrasting stock movements between Uber Technologies, Inc. and Dayforce Inc, with Uber exhibiting a bullish trend despite recent deceleration, while Dayforce’s trend remains bearish with slight recent recovery.
Trend Analysis
Uber Technologies, Inc. experienced an 8.5% price increase over the past 12 months, indicating a bullish trend with decelerating momentum. The stock ranged between 58.99 and 98.51, showing high volatility with a 10.29 standard deviation.
Dayforce Inc’s stock declined by 3.16% over the same period, marking a bearish trend with deceleration. Price fluctuated between 49.46 and 81.14, displaying moderate volatility with a 7.84 standard deviation.
Comparing both, Uber delivered the highest market performance with a clear bullish trend, while Dayforce showed a bearish trend despite a slight recent price uptick.
Target Prices
The current analyst consensus provides a clear outlook on the target prices for Uber Technologies, Inc. and Dayforce Inc.
| Company | Target High | Target Low | Consensus |
|---|---|---|---|
| Uber Technologies, Inc. | 140 | 73 | 111.26 |
| Dayforce Inc | 70 | 70 | 70 |
Analysts expect Uber’s stock to appreciate significantly above its current price of $84.85, indicating bullish sentiment. Dayforce’s target consensus aligns closely with its current price near $69.16, reflecting a stable outlook.
Analyst Opinions Comparison
This section compares analysts’ ratings and grades for Uber Technologies, Inc. and Dayforce Inc:
Rating Comparison
Uber Rating
- Rating: B, classified as Very Favorable by analysts.
- Discounted Cash Flow Score: 1, indicating a Very Unfavorable valuation outlook.
- ROE Score: 5, reflecting Very Favorable profitability efficiency.
- ROA Score: 5, showing Very Favorable asset utilization.
- Debt To Equity Score: 2, indicating Moderate financial risk.
- Overall Score: 3, assessed as Moderate overall financial standing.
Dayforce Rating
- Rating: C-, also classified as Very Favorable by analysts.
- Discounted Cash Flow Score: 2, indicating a Moderate valuation outlook.
- ROE Score: 1, reflecting Very Unfavorable profitability efficiency.
- ROA Score: 1, showing Very Unfavorable asset utilization.
- Debt To Equity Score: 2, indicating Moderate financial risk.
- Overall Score: 1, assessed as Very Unfavorable overall financial standing.
Which one is the best rated?
Based strictly on the provided data, Uber holds a better overall rating and significantly higher scores in profitability and asset utilization compared to Dayforce, which shows weaker financial metrics and a lower overall score.
Scores Comparison
The following table compares the Altman Z-Score and Piotroski Score of Uber Technologies, Inc. and Dayforce Inc:
Uber Scores
- Altman Z-Score: 4.44, in safe zone, low bankruptcy risk.
- Piotroski Score: 6, average financial strength.
Dayforce Scores
- Altman Z-Score: 1.24, in distress zone, high bankruptcy risk.
- Piotroski Score: 5, average financial strength.
Which company has the best scores?
Uber shows a stronger financial position with a safe zone Altman Z-Score of 4.44 versus Dayforce’s distress zone score of 1.24. Both companies have average Piotroski Scores, with Uber slightly higher at 6 compared to Dayforce’s 5.
Grades Comparison
Here is a comparison of the latest grades assigned to Uber Technologies, Inc. and Dayforce Inc by reputable grading companies:
Uber Technologies, Inc. Grades
The following table shows recent grades from recognized financial institutions for Uber Technologies, Inc.:
| Grading Company | Action | New Grade | Date |
|---|---|---|---|
| BTIG | Maintain | Buy | 2026-01-15 |
| Wells Fargo | Maintain | Overweight | 2026-01-08 |
| Cantor Fitzgerald | Maintain | Overweight | 2026-01-08 |
| Wolfe Research | Maintain | Outperform | 2026-01-06 |
| Wedbush | Maintain | Neutral | 2025-12-19 |
| Morgan Stanley | Maintain | Overweight | 2025-12-08 |
| Arete Research | Upgrade | Buy | 2025-12-03 |
| Wells Fargo | Maintain | Overweight | 2025-11-05 |
| Guggenheim | Maintain | Buy | 2025-11-05 |
| DA Davidson | Maintain | Buy | 2025-11-05 |
Uber’s grades predominantly range from Buy to Overweight with occasional Neutral ratings, indicating a generally positive outlook from analysts.
Dayforce Inc Grades
The following table shows recent grades from recognized financial institutions for Dayforce Inc:
| Grading Company | Action | New Grade | Date |
|---|---|---|---|
| Needham | Maintain | Hold | 2025-10-30 |
| Stifel | Downgrade | Hold | 2025-09-19 |
| Citigroup | Downgrade | Neutral | 2025-09-17 |
| Wells Fargo | Upgrade | Equal Weight | 2025-08-22 |
| BMO Capital | Downgrade | Market Perform | 2025-08-22 |
| Keybanc | Downgrade | Sector Weight | 2025-08-22 |
| Needham | Downgrade | Hold | 2025-08-22 |
| Barclays | Maintain | Equal Weight | 2025-08-22 |
| Deutsche Bank | Maintain | Hold | 2025-08-22 |
| Jefferies | Maintain | Hold | 2025-08-21 |
Dayforce’s grades mostly cluster around Hold, Neutral, and various weightings, showing a more cautious stance from analysts with a trend toward downgrades.
Which company has the best grades?
Uber Technologies, Inc. has received consistently stronger grades, predominantly Buy and Overweight, compared to Dayforce Inc’s Hold and Neutral ratings. For investors, Uber’s more favorable grades may imply higher confidence from analysts in its growth prospects relative to Dayforce.
Strengths and Weaknesses
Below is a comparative overview of the strengths and weaknesses of Uber Technologies, Inc. and Dayforce Inc based on their recent financial and operational data.
| Criterion | Uber Technologies, Inc. | Dayforce Inc |
|---|---|---|
| Diversification | Strong, with Mobility $25.1B, Delivery $13.8B, Freight $5.1B in 2024 | Moderate, mainly focused on Cloud Dayforce and Powerpay services totaling ~$1.6B recurring revenue |
| Profitability | Favorable net margin (22.41%) and ROE (45.72%) in 2024; neutral ROIC vs WACC | Unfavorable profitability metrics: net margin 1.03%, ROE 0.71%, ROIC below WACC |
| Innovation | High fixed asset turnover (14.14) indicating efficient use of assets; growing ROIC trend | Moderate innovation with growing ROIC but high PE ratio (633.29) signals market skepticism |
| Global presence | Extensive global footprint in mobility and delivery sectors | More niche, likely regional with cloud-based HR services |
| Market Share | Large market share in ride-hailing and delivery markets | Smaller market share in cloud HR services, less diversified |
Key takeaways: Uber demonstrates strong diversification and profitability with growing returns, despite slight value destruction. Dayforce shows growth potential but struggles with profitability and market valuation, indicating higher investment risk.
Risk Analysis
Below is a comparison table of key risks for Uber Technologies, Inc. (UBER) and Dayforce Inc (DAY) based on the most recent data from 2024-2026:
| Metric | Uber Technologies, Inc. (UBER) | Dayforce Inc (DAY) |
|---|---|---|
| Market Risk | Moderate (Beta 1.20) | Moderate (Beta 1.18) |
| Debt Level | Moderate (D/E 0.53, interest coverage 8.89) | Low-Moderate (D/E 0.48, interest coverage 1.93) |
| Regulatory Risk | Medium due to global ride-sharing regulations | Medium, HCM software compliance requirements |
| Operational Risk | Moderate (complex multi-segment operations) | Moderate (cloud platform service continuity) |
| Environmental Risk | Low to Moderate (urban transportation impact) | Low (software industry) |
| Geopolitical Risk | Moderate (global presence with exposure in emerging markets) | Low-Moderate (primarily North America) |
Synthesis: Uber faces its most significant risks in regulatory and geopolitical challenges given its global footprint and evolving ride-sharing laws. Debt and operational risks remain manageable with strong interest coverage. Dayforce’s key risk is its financial stability, highlighted by a low interest coverage ratio and Altman Z-Score in the distress zone, signaling potential bankruptcy risk despite low debt levels. Investors should weigh Uber’s regulatory exposure against Dayforce’s financial fragility.
Which Stock to Choose?
Uber Technologies, Inc. shows a strong income evolution with 22.41% net margin and favorable profitability metrics, supported by a solid return on equity of 45.72%. Its debt levels are moderate and financial ratios are slightly favorable overall, with a robust Altman Z-Score indicating financial safety.
Dayforce Inc exhibits a more modest income evolution, with a 1.03% net margin and generally unfavorable profitability ratios. While its debt-to-equity ratio is favorable, overall financial ratios and credit scores suggest caution, and its Altman Z-Score places it in the distress zone.
Investors focused on growth and profitability might find Uber’s strong income statement and favorable ratings more appealing, while those willing to tolerate higher risk and seek potential turnaround opportunities could consider Dayforce, given its improving ROIC trend despite value destruction.
Disclaimer: Investment carries a risk of loss of initial capital. The past performance is not a reliable indicator of future results. Be sure to understand risks before making an investment decision.
Go Further
I encourage you to read the complete analyses of Uber Technologies, Inc. and Dayforce Inc to enhance your investment decisions: