In the fast-evolving software industry, Tyler Technologies, Inc. and Dayforce Inc stand out as influential players with distinct yet overlapping focuses. Tyler specializes in public sector management solutions, while Dayforce excels in human capital management software. Both companies leverage innovation to streamline complex operations, attracting investor attention. This article will explore their strengths and risks, helping you decide which is the more compelling investment opportunity in 2026.
Table of contents
Companies Overview
I will begin the comparison between Tyler Technologies and Dayforce by providing an overview of these two companies and their main differences.
Tyler Technologies Overview
Tyler Technologies, Inc. focuses on delivering integrated information management solutions and services tailored for the public sector. Its software spans multiple government functions, including financial management, tax and appraisal, court and public safety systems, and K-12 education. Headquartered in Plano, Texas, Tyler operates with a market cap of $18.9B and emphasizes cloud hosting partnerships, notably with Amazon Web Services, to support its software offerings.
Dayforce Overview
Dayforce Inc specializes in human capital management software, providing a cloud-based platform for HR, payroll, benefits, workforce, and talent management. The company also targets small businesses with its Powerpay solution and offers payroll bureau services. Based in Minneapolis, Minnesota, Dayforce has a market cap of $11.1B and sells its products through both direct and third-party channels, positioning itself as a key player in HCM software across North America and internationally.
Key similarities and differences
Both Tyler Technologies and Dayforce operate within the software application industry, focusing on niche enterprise solutions. Tyler concentrates on public sector management systems, while Dayforce targets human capital management for businesses. Although both leverage cloud technology, Tyler emphasizes government workflow automation, whereas Dayforce prioritizes workforce and payroll solutions. Their market caps and employee bases differ, reflecting their distinct market segments and operational scopes.
Income Statement Comparison
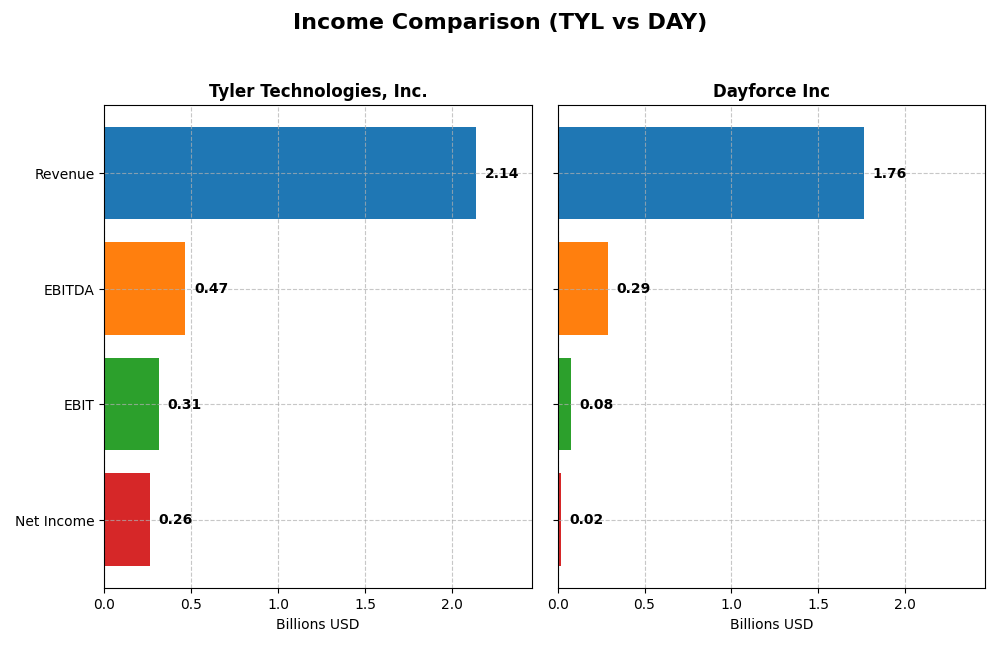
This table provides a side-by-side comparison of key income statement metrics for Tyler Technologies, Inc. and Dayforce Inc for the fiscal year 2024.
| Metric | Tyler Technologies, Inc. (TYL) | Dayforce Inc (DAY) |
|---|---|---|
| Market Cap | 18.9B | 11.1B |
| Revenue | 2.14B | 1.76B |
| EBITDA | 466M | 288M |
| EBIT | 314M | 78.2M |
| Net Income | 263M | 18.1M |
| EPS | 6.17 | 0.11 |
| Fiscal Year | 2024 | 2024 |
Income Statement Interpretations
Tyler Technologies, Inc.
Tyler Technologies showed consistent revenue growth from 2020 to 2024, rising from $1.12B to $2.14B, with net income increasing from $195M to $263M. Gross and EBIT margins remained favorable, around 41% and 15% respectively, though net margin slightly declined overall. In 2024, revenue growth slowed to 9.53%, but EBIT and net income margins improved significantly, reflecting operational efficiency gains.
Dayforce Inc
Dayforce experienced strong revenue growth over the same period, doubling from $842M to $1.76B, with net income recovering from a loss of $4M in 2020 to $18M in 2024. Gross margin stayed robust at 46%, but EBIT and net margins were lower and more volatile, with a net margin near 1% in 2024. The latest year showed 16.27% revenue growth, but profitability metrics weakened, indicating rising operating expenses.
Which one has the stronger fundamentals?
Tyler Technologies demonstrates stronger and more stable fundamentals with consistently favorable margins, solid net income, and improved profitability in 2024. Dayforce shows impressive top-line growth and net income recovery but struggles with margin stability and profitability, especially evident in the recent year’s decline in EBIT and net margin. Tyler’s overall income statement profile appears more balanced and resilient.
Financial Ratios Comparison
The table below presents a side-by-side comparison of key financial ratios for Tyler Technologies, Inc. and Dayforce Inc, based on their most recent fiscal year data for 2024.
| Ratios | Tyler Technologies, Inc. (TYL) | Dayforce Inc (DAY) |
|---|---|---|
| ROE | 7.76% | 0.71% |
| ROIC | 6.20% | 1.31% |
| P/E | 93.42 | 633.29 |
| P/B | 7.25 | 4.50 |
| Current Ratio | 1.35 | 1.13 |
| Quick Ratio | 1.35 | 1.13 |
| D/E | 0.19 | 0.48 |
| Debt-to-Assets | 12.32% | 13.52% |
| Interest Coverage | 50.50 | 2.56 |
| Asset Turnover | 0.41 | 0.19 |
| Fixed Asset Turnover | 10.95 | 7.46 |
| Payout Ratio | 0 | 0 |
| Dividend Yield | 0 | 0 |
Interpretation of the Ratios
Tyler Technologies, Inc.
Tyler Technologies shows a mixed ratio profile with 50% favorable ratios, including a strong net margin of 12.3% and excellent interest coverage at 52.96, but unfavorable metrics like a high P/E of 93.42 and weak asset turnover at 0.41. The company does not pay dividends, indicating a reinvestment strategy likely focused on growth and innovation.
Dayforce Inc
Dayforce’s ratios are mostly unfavorable, with 57.14% negative readings such as a low net margin of 1.03% and poor interest coverage at 1.93. Despite favorable leverage ratios and quick ratio, the high P/E of 633.29 raises concerns. The company also does not pay dividends, likely prioritizing reinvestment and expansion over shareholder payouts.
Which one has the best ratios?
Tyler Technologies exhibits a slightly favorable overall ratio assessment, outperforming Dayforce, which has a predominantly unfavorable profile. Tyler’s stronger profitability and coverage ratios contrast with Dayforce’s weaker earnings and coverage metrics, suggesting Tyler has the more robust financial ratio standing between the two.
Strategic Positioning
This section compares the strategic positioning of Tyler Technologies, Inc. and Dayforce Inc, including Market position, Key segments, and disruption:
Tyler Technologies, Inc.
- Established public sector software provider with 19B market cap, facing moderate competitive pressure.
- Diverse offerings across enterprise software, appraisal, tax, SaaS, and transaction fees drive business.
- Strategic collaboration with AWS for cloud hosting mitigates disruption risks in public sector tech solutions.
Dayforce Inc
- Human capital management software leader with 11B market cap, operating in a competitive cloud HCM market.
- Focused on cloud HCM platform with payroll, benefits, and workforce management as key revenue drivers.
- Cloud-based delivery model enables adaptability amid technological shifts in human capital management.
Tyler Technologies, Inc. vs Dayforce Inc Positioning
Tyler Technologies maintains a diversified portfolio in public sector software, balancing enterprise and tax solutions, while Dayforce concentrates on cloud HCM services. Tyler’s broad segments offer varied revenue streams; Dayforce’s focus supports specialized innovation but may limit diversification.
Which has the best competitive advantage?
Both companies are currently shedding value relative to their cost of capital. Tyler shows declining profitability, while Dayforce’s profitability is improving despite value destruction, indicating a slightly better competitive advantage trend for Dayforce.
Stock Comparison
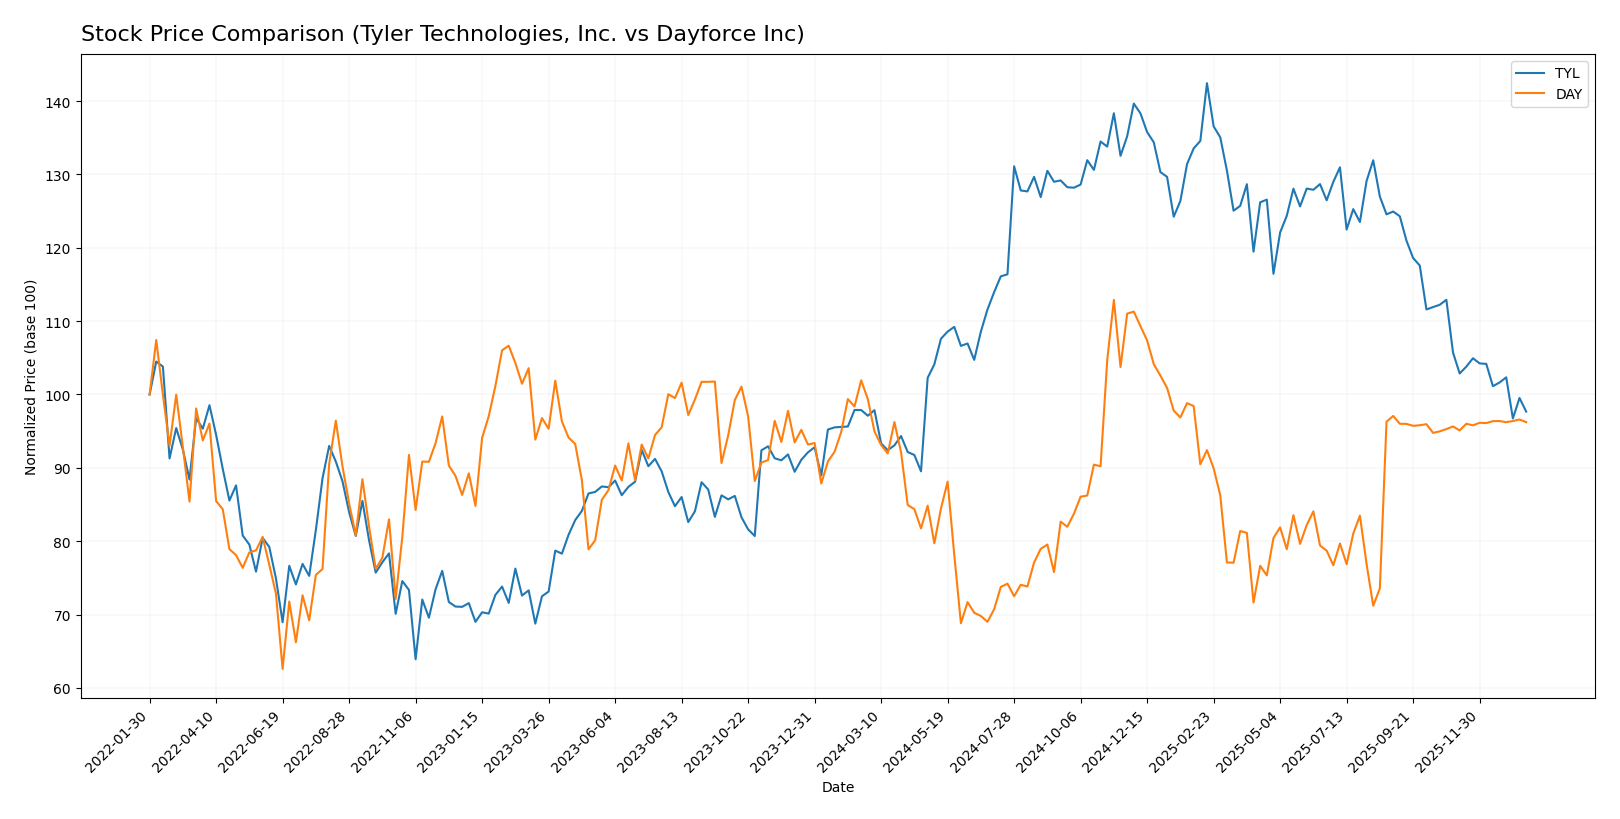
The stock prices of Tyler Technologies, Inc. (TYL) and Dayforce Inc (DAY) exhibited distinct trends over the past 12 months, reflecting differing market dynamics and investor sentiment during this period.
Trend Analysis
Tyler Technologies, Inc. (TYL) showed a modest price increase of 0.58% over the past year, indicating a bullish trend with deceleration. The stock reached a high of 641.7 and a low of 403.35, with significant volatility reflected by a standard deviation of 61.82.
Dayforce Inc (DAY) experienced a 3.16% decline over the same period, signaling a bearish trend with deceleration. Its price fluctuated between 49.46 and 81.14, with lower volatility compared to TYL, demonstrated by a standard deviation of 7.84.
Comparing the two, TYL delivered the highest market performance over the past 12 months with a slight positive gain, while DAY’s stock trended downward, marking a stronger relative loss in value.
Target Prices
Here is the target price consensus from verified analysts for the two companies.
| Company | Target High | Target Low | Consensus |
|---|---|---|---|
| Tyler Technologies, Inc. | 675 | 470 | 584 |
| Dayforce Inc | 70 | 70 | 70 |
Analysts expect Tyler Technologies to trade significantly above its current price of 440.01 USD, indicating potential upside. Dayforce’s target consensus aligns closely with its current price near 69.16 USD, suggesting a stable outlook.
Analyst Opinions Comparison
This section compares analysts’ ratings and financial scores for Tyler Technologies, Inc. (TYL) and Dayforce Inc (DAY):
Rating Comparison
TYL Rating
- Rating: B, considered very favorable
- Discounted Cash Flow Score: 4 (favorable)
- Return on Equity Score: 3 (moderate)
- Return on Assets Score: 4 (favorable)
- Debt To Equity Score: 3 (moderate)
- Overall Score: 3 (moderate)
DAY Rating
- Rating: C-, also considered very favorable
- Discounted Cash Flow Score: 2 (moderate)
- Return on Equity Score: 1 (very unfavorable)
- Return on Assets Score: 1 (very unfavorable)
- Debt To Equity Score: 2 (moderate)
- Overall Score: 1 (very unfavorable)
Which one is the best rated?
Based strictly on provided data, Tyler Technologies (TYL) has higher ratings and scores across all key metrics compared to Dayforce (DAY), indicating a stronger financial standing and more favorable analyst evaluation.
Scores Comparison
Here is a comparison of the Altman Z-Score and Piotroski Score for Tyler Technologies, Inc. and Dayforce Inc:
TYL Scores
- Altman Z-Score: 7.42, indicating a safe zone.
- Piotroski Score: 6, reflecting average financial strength.
DAY Scores
- Altman Z-Score: 1.24, indicating distress zone.
- Piotroski Score: 5, reflecting average financial strength.
Which company has the best scores?
Based on the provided data, Tyler Technologies has a significantly higher Altman Z-Score, indicating stronger financial stability and lower bankruptcy risk. Both companies have similar average Piotroski Scores, showing comparable financial strength.
Grades Comparison
Here is a detailed comparison of the recent grades assigned to Tyler Technologies, Inc. and Dayforce Inc by recognized grading companies:
Tyler Technologies, Inc. Grades
The following table shows recent grades from established financial institutions for Tyler Technologies, Inc.:
| Grading Company | Action | New Grade | Date |
|---|---|---|---|
| Piper Sandler | Maintain | Overweight | 2026-01-13 |
| Wells Fargo | Maintain | Equal Weight | 2026-01-08 |
| DA Davidson | Maintain | Neutral | 2025-12-09 |
| Evercore ISI Group | Maintain | In Line | 2025-10-31 |
| DA Davidson | Maintain | Neutral | 2025-10-31 |
| DA Davidson | Maintain | Neutral | 2025-10-10 |
| DA Davidson | Maintain | Neutral | 2025-08-05 |
| Barclays | Maintain | Overweight | 2025-07-31 |
| Needham | Maintain | Buy | 2025-05-13 |
| Barclays | Maintain | Overweight | 2025-04-25 |
Tyler Technologies has consistently maintained positive grades, predominantly “Overweight” and “Buy,” with stable outlooks over recent months.
Dayforce Inc Grades
The following table summarizes the recent grades from recognized firms for Dayforce Inc:
| Grading Company | Action | New Grade | Date |
|---|---|---|---|
| Needham | Maintain | Hold | 2025-10-30 |
| Stifel | Downgrade | Hold | 2025-09-19 |
| Citigroup | Downgrade | Neutral | 2025-09-17 |
| Wells Fargo | Upgrade | Equal Weight | 2025-08-22 |
| BMO Capital | Downgrade | Market Perform | 2025-08-22 |
| Keybanc | Downgrade | Sector Weight | 2025-08-22 |
| Needham | Downgrade | Hold | 2025-08-22 |
| Barclays | Maintain | Equal Weight | 2025-08-22 |
| Deutsche Bank | Maintain | Hold | 2025-08-22 |
| Jefferies | Maintain | Hold | 2025-08-21 |
Dayforce’s grades show a trend of downgrades from “Buy” to “Hold” or “Neutral,” with recent ratings mostly centered around “Hold” and “Equal Weight.”
Which company has the best grades?
Tyler Technologies, Inc. has received generally stronger and more positive grades compared to Dayforce Inc, with a consensus rating of “Buy” versus “Hold” for Dayforce. This suggests a more favorable analyst outlook on Tyler’s stock, potentially influencing investor confidence and portfolio weighting decisions.
Strengths and Weaknesses
Below is a comparison table highlighting key strengths and weaknesses of Tyler Technologies, Inc. (TYL) and Dayforce Inc (DAY) based on their most recent financial and operational data.
| Criterion | Tyler Technologies, Inc. (TYL) | Dayforce Inc (DAY) |
|---|---|---|
| Diversification | High: Multiple revenue streams including SaaS, Transaction Fees, Maintenance, and Professional Services totaling over 2B USD in 2024 | Moderate: Primarily recurring cloud services and professional services, around 1.5B USD in 2024 |
| Profitability | Moderate: Net margin 12.3%, ROIC 6.2% (neutral), but ROE low at 7.76% (unfavorable) | Low: Net margin 1.03%, ROIC 1.31% (unfavorable), ROE 0.71% (unfavorable) |
| Innovation | Moderate: Strong fixed asset turnover (10.95), indicating efficient use of technology assets | Moderate: Growing ROIC trend suggests improving profitability, but overall still shedding value |
| Global presence | Established: Broad product portfolio with steady maintenance and SaaS revenues | Growing: Focus on cloud-based HR and payroll services, increasing recurring revenues |
| Market Share | Strong in public sector software solutions with steady transactional fee growth | Niche in cloud HR/payroll with increasing recurring revenue but high valuation multiples |
Key takeaways: Tyler Technologies offers better diversification and profitability, though with some efficiency challenges. Dayforce shows potential with rapid ROIC growth and strong recurring revenues but currently operates at low profitability and high valuation risk. Investors should weigh Tyler’s stability against Dayforce’s growth potential and risk.
Risk Analysis
Below is a table summarizing key risks for Tyler Technologies, Inc. (TYL) and Dayforce Inc (DAY) based on the most recent financial and operational data from 2024:
| Metric | Tyler Technologies, Inc. (TYL) | Dayforce Inc (DAY) |
|---|---|---|
| Market Risk | Moderate beta (0.916), stable tech sector exposure | Higher beta (1.181), more volatile market sensitivity |
| Debt level | Low debt-to-equity (0.19), strong interest coverage (53x) | Moderate debt-to-equity (0.48), weak interest coverage (1.93x) |
| Regulatory Risk | Moderate, operates in public sector software with some compliance complexity | Moderate, HCM software subject to data privacy and labor regulations |
| Operational Risk | Diversified solutions, moderate asset turnover (0.41) | Lower asset turnover (0.19), reliance on cloud platform stability |
| Environmental Risk | Low direct exposure, primarily software-based business | Low direct exposure, cloud-based operations with moderate energy use |
| Geopolitical Risk | Low, US-focused public sector contracts | Moderate, international presence increases exposure |
In synthesis, Tyler Technologies exhibits lower financial risk with strong debt management and stable market exposure, making it the less risky option. Dayforce’s higher debt level and weaker interest coverage pose significant financial risks, compounded by greater market volatility and international geopolitical exposure. Investors should carefully weigh Dayforce’s operational and financial vulnerabilities against its growth potential.
Which Stock to Choose?
Tyler Technologies, Inc. (TYL) shows a favorable income evolution with strong revenue and profit growth over recent years, supported by robust margins and efficient debt management. Its financial ratios are slightly favorable overall, with solid liquidity and low leverage, though some valuation metrics remain high. The company carries very favorable ratings and scores, but its economic moat analysis signals value destruction with declining ROIC.
Dayforce Inc (DAY) presents a favorable income trend marked by impressive long-term net income and EPS growth, despite recent margin pressures and mixed profitability. Financial ratios are globally unfavorable, with weaker returns and higher leverage, while ratings are very favorable but scores indicate financial distress risk. Its moat evaluation suggests improving profitability but ongoing value shedding.
Considering ratings and the overall income and financial ratio profiles, Tyler Technologies might appear more stable with better margin performance and stronger financial health, suitable for investors prioritizing quality and moderate risk. Conversely, Dayforce could be seen as a higher-risk option with potential for growth, appealing to those with a tolerance for volatility and a focus on turnaround potential.
Disclaimer: Investment carries a risk of loss of initial capital. The past performance is not a reliable indicator of future results. Be sure to understand risks before making an investment decision.
Go Further
I encourage you to read the complete analyses of Tyler Technologies, Inc. and Dayforce Inc to enhance your investment decisions: