In today’s fast-evolving software landscape, Strategy Inc and Dayforce Inc stand out as key players with distinct yet overlapping market pursuits. Strategy Inc leverages AI and bitcoin treasury management to innovate enterprise analytics, while Dayforce Inc focuses on cloud-based human capital management solutions. Both companies drive growth through technology and strategic innovation, making their comparison crucial for investors seeking balanced exposure. Let’s explore which company offers the most compelling investment opportunity in 2026.

Table of contents
Companies Overview
I will begin the comparison between Strategy Inc and Dayforce Inc by providing an overview of these two companies and their main differences.
Strategy Inc Overview
Strategy Inc, formerly MicroStrategy Incorporated until August 2025, operates as a bitcoin treasury company globally, including the US, Europe, and the Middle East. It offers investors exposure to Bitcoin via diverse securities and provides AI-powered enterprise analytics software like Strategy One and Strategy Mosaic. Founded in 1989, the company is headquartered in Tysons Corner, VA, and employs 1,546 people.
Dayforce Inc Overview
Dayforce Inc, previously known as Ceridian HCM Holding Inc. until February 2024, specializes in human capital management software. Its cloud-based platform Dayforce delivers HR, payroll, benefits, and talent management services, alongside Powerpay for small businesses. Incorporated in 2013 and based in Minneapolis, MN, Dayforce serves clients internationally and employs approximately 9,600 people.
Key similarities and differences
Both Strategy Inc and Dayforce Inc operate in the software application industry within the US and internationally. While Strategy Inc focuses on bitcoin treasury and AI analytics solutions, Dayforce Inc concentrates on human capital management systems and payroll services. Strategy Inc is smaller in workforce size but has a significantly higher market cap at $50B versus Dayforce’s $11B, reflecting distinct business models and market positioning.
Income Statement Comparison
This table compares the most recent full fiscal year income statement metrics for Strategy Inc and Dayforce Inc, providing a clear snapshot of their financial performance.
| Metric | Strategy Inc (MSTR) | Dayforce Inc (DAY) |
|---|---|---|
| Market Cap | 50B | 11B |
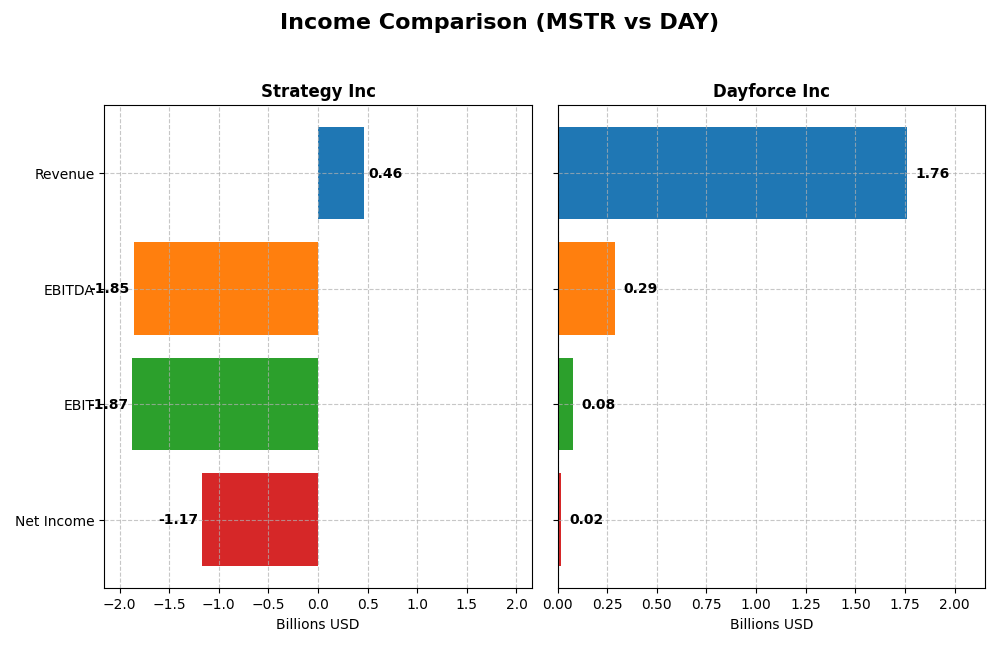
| Revenue | 463M | 1.76B |
| EBITDA | -1.85B | 288M |
| EBIT | -1.87B | 78M |
| Net Income | -1.17B | 18M |
| EPS | -6.06 | 0.11 |
| Fiscal Year | 2024 | 2024 |
Income Statement Interpretations
Strategy Inc
Strategy Inc’s revenue declined modestly by 3.6% over 2020-2024, with net income sharply deteriorating, showing a 15406% decrease. While the gross margin remains strong at 72.06%, operating and net margins are deeply negative, with recent-year results reflecting a 6.6% revenue drop and worsening profitability, driven by substantial operating expenses and interest costs.
Dayforce Inc
Dayforce Inc demonstrated robust revenue growth of 108.9% over the period, paired with a 552.5% increase in net income. Gross margin is moderate at 46.14%, with neutral EBIT and net margins. The latest fiscal year showed a 16.3% revenue gain but a decline in EBIT and net margin, indicating rising operating expenses impacting profitability despite top-line growth.
Which one has the stronger fundamentals?
Dayforce Inc presents stronger fundamentals overall, boasting significant revenue and net income growth, stable gross margins, and manageable interest expenses. In contrast, Strategy Inc faces unfavorable trends with shrinking revenue, severe net losses, and very negative margins, suggesting weaker income statement health and profitability challenges.
Financial Ratios Comparison
The table below presents a side-by-side comparison of key financial ratios for Strategy Inc (MSTR) and Dayforce Inc (DAY) based on their most recent fiscal year data for 2024.
| Ratios | Strategy Inc (MSTR) | Dayforce Inc (DAY) |
|---|---|---|
| ROE | -6.40% | 0.71% |
| ROIC | -4.38% | 1.31% |
| P/E | -47.80 | 633.29 |
| P/B | 3.06 | 4.50 |
| Current Ratio | 0.71 | 1.13 |
| Quick Ratio | 0.71 | 1.13 |
| D/E | 0.40 | 0.48 |
| Debt-to-Assets | 28.09% | 13.52% |
| Interest Coverage | -29.92 | 2.56 |
| Asset Turnover | 0.02 | 0.19 |
| Fixed Asset Turnover | 5.73 | 7.46 |
| Payout ratio | 0% | 0% |
| Dividend yield | 0% | 0% |
Interpretation of the Ratios
Strategy Inc
Strategy Inc shows predominantly unfavorable financial ratios, with weak profitability indicators such as negative net margin (-251.73%) and return on equity (-6.4%). Liquidity ratios are below 1, signaling potential short-term financial stress. The company does not pay dividends, reflecting either a reinvestment strategy or financial constraints given its negative free cash flow to equity of -7.3B, with no share buybacks reported.
Dayforce Inc
Dayforce Inc exhibits mostly unfavorable ratios too, though with better liquidity (current ratio 1.13) and moderate debt levels (debt-to-assets 13.52%). Profitability remains weak with net margin just above zero (1.03%) and low return on equity (0.71%). The company also does not pay dividends, likely prioritizing growth and reinvestment, as suggested by negative free cash flow to equity of -482M and no dividend yield.
Which one has the best ratios?
Both companies face challenges, but Dayforce Inc has a slightly better liquidity position and lower leverage risk. Strategy Inc’s higher leverage and weaker profitability ratios, combined with liquidity concerns, weigh more negatively. Overall, neither company shows strong financial health, with both rated unfavorable in global ratio evaluations.
Strategic Positioning
This section compares the strategic positioning of Strategy Inc and Dayforce Inc, including Market position, Key segments, and disruption:
Strategy Inc
- Leading bitcoin treasury company with high market cap but faces competitive pressure from crypto volatility.
- Focuses on bitcoin exposure, AI-powered analytics software, and enterprise data governance solutions.
- Exposure to technological disruption linked to cryptocurrency markets and AI software innovation.
Dayforce Inc
- Human capital management software provider with lower market cap and moderate competitive pressure.
- Concentrates on cloud-based HCM, payroll, benefits, and workforce management services.
- Faces disruption risks in cloud HCM platforms but benefits from recurring cloud services revenue.
Strategy Inc vs Dayforce Inc Positioning
Strategy Inc has a diversified approach combining bitcoin treasury and AI analytics, while Dayforce Inc focuses on cloud HCM solutions. Strategy’s advantage lies in innovation breadth; Dayforce benefits from a concentrated, recurring revenue business model.
Which has the best competitive advantage?
Both companies are shedding value with ROIC below WACC. Dayforce shows improving profitability trends, indicating a slightly better competitive moat than Strategy Inc’s declining returns and very unfavorable moat status.
Stock Comparison
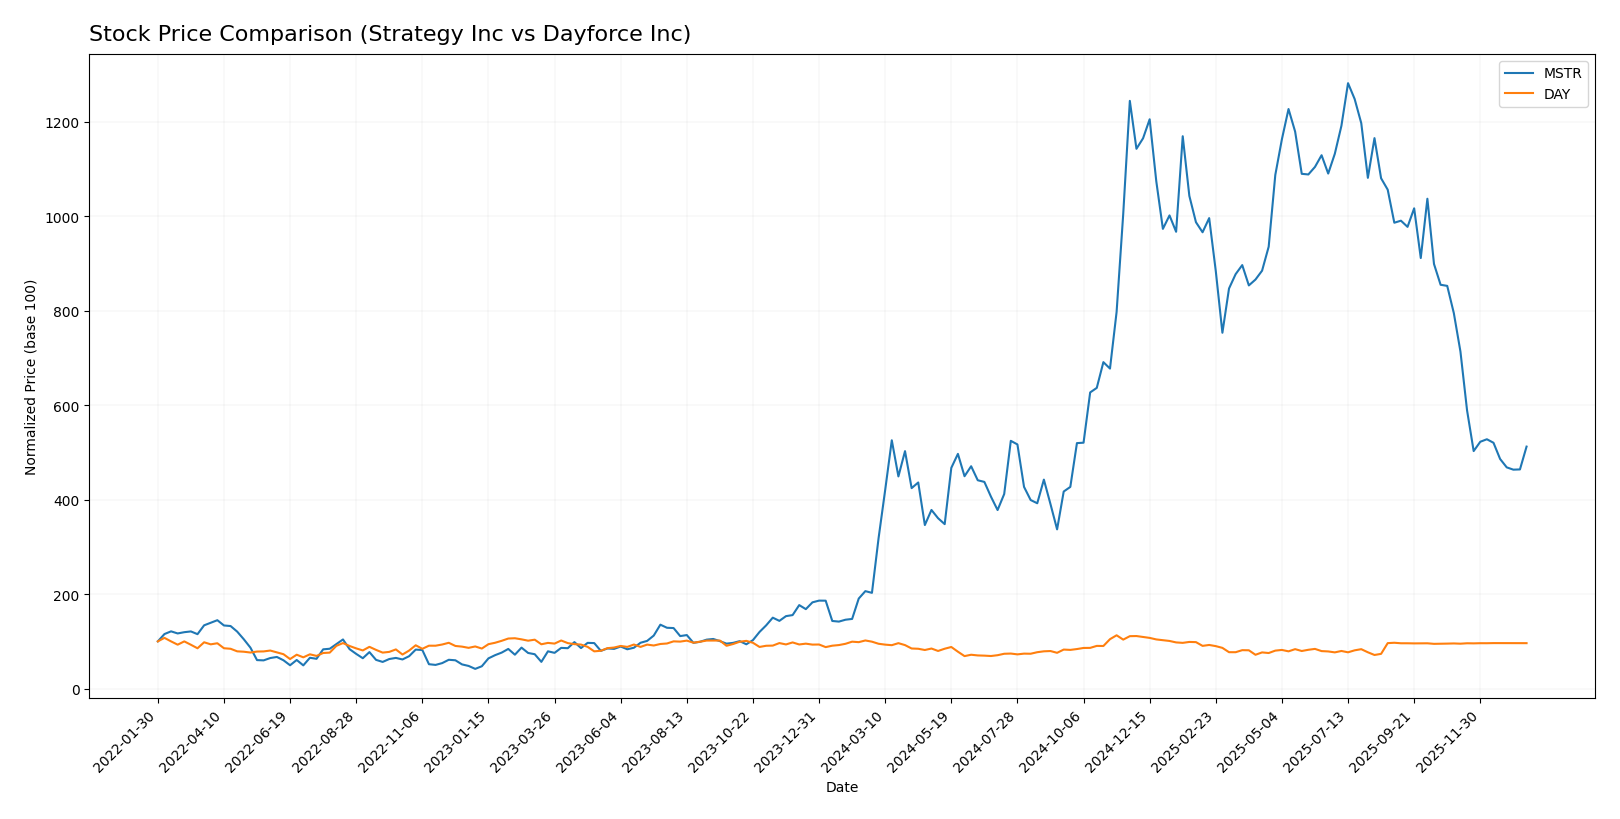
The stock price movements of Strategy Inc and Dayforce Inc over the past 12 months reveal contrasting dynamics, with Strategy Inc showing a strong overall gain despite recent pullbacks, while Dayforce Inc has exhibited a mild decline with stabilizing recent performance.
Trend Analysis
Strategy Inc’s stock gained 152.71% over the past year, reflecting a bullish trend with decelerating momentum. It reached a high of 434.58 and a low of 68.74, with notable volatility marked by a standard deviation of 103.09.
Dayforce Inc experienced a 3.16% decline in the same period, indicating a bearish trend with deceleration. The stock fluctuated between 49.46 and 81.14, showing low volatility with a standard deviation of 7.84.
Comparing the two, Strategy Inc has delivered the highest market performance with a significant bullish trend, while Dayforce Inc remained bearish with marginal changes.
Target Prices
The consensus target prices for Strategy Inc and Dayforce Inc reflect varied analyst expectations.
| Company | Target High | Target Low | Consensus |
|---|---|---|---|
| Strategy Inc | 705 | 175 | 433.57 |
| Dayforce Inc | 70 | 70 | 70 |
Analysts see Strategy Inc’s stock potentially rising significantly from its current price of 174, indicating bullish sentiment. Dayforce Inc’s target consensus closely matches its current price of 69, suggesting a stable outlook.
Analyst Opinions Comparison
This section compares analysts’ ratings and grades for Strategy Inc and Dayforce Inc:
Rating Comparison
Strategy Inc Rating
- Rating: A- indicating a very favorable assessment
- Discounted Cash Flow Score: 1, very unfavorable
- ROE Score: 4, favorable
- ROA Score: 5, very favorable
- Debt To Equity Score: 3, moderate
- Overall Score: 4, favorable
Dayforce Inc Rating
- Rating: C- indicating a very unfavorable assessment
- Discounted Cash Flow Score: 2, moderate
- ROE Score: 1, very unfavorable
- ROA Score: 1, very unfavorable
- Debt To Equity Score: 2, moderate
- Overall Score: 1, very unfavorable
Which one is the best rated?
Based strictly on the provided data, Strategy Inc is better rated than Dayforce Inc across all key financial scores and overall rating. Strategy Inc shows stronger profitability and asset utilization, despite a low discounted cash flow score.
Scores Comparison
Here is a comparison of the Altman Z-Score and Piotroski Score for Strategy Inc and Dayforce Inc:
Strategy Inc Scores
- Altman Z-Score: 2.78, in the grey zone indicating moderate bankruptcy risk.
- Piotroski Score: 4, categorized as average financial strength.
Dayforce Inc Scores
- Altman Z-Score: 1.24, in the distress zone indicating high bankruptcy risk.
- Piotroski Score: 5, categorized as average financial strength.
Which company has the best scores?
Strategy Inc has a higher Altman Z-Score placing it in a safer grey zone compared to Dayforce Inc’s distress zone. Both companies have average Piotroski Scores, with Dayforce slightly higher by one point.
Grades Comparison
Here is a detailed comparison of the recent grades assigned to Strategy Inc and Dayforce Inc by reputable grading companies:
Strategy Inc Grades
This table summarizes the recent grades and actions from verified grading companies for Strategy Inc:
| Grading Company | Action | New Grade | Date |
|---|---|---|---|
| Mizuho | Maintain | Outperform | 2026-01-16 |
| TD Cowen | Maintain | Buy | 2026-01-15 |
| Citigroup | Maintain | Buy | 2025-12-22 |
| Bernstein | Maintain | Outperform | 2025-12-08 |
| Monness, Crespi, Hardt | Upgrade | Neutral | 2025-11-10 |
| HC Wainwright & Co. | Maintain | Buy | 2025-11-03 |
| Canaccord Genuity | Maintain | Buy | 2025-11-03 |
| BTIG | Maintain | Buy | 2025-10-31 |
| Cantor Fitzgerald | Maintain | Overweight | 2025-10-31 |
| TD Cowen | Maintain | Buy | 2025-10-31 |
Overall, Strategy Inc shows a strong consensus of buy and outperform ratings, with mostly maintained positive outlooks and one notable upgrade from sell to neutral.
Dayforce Inc Grades
This table summarizes the recent grades and actions from verified grading companies for Dayforce Inc:
| Grading Company | Action | New Grade | Date |
|---|---|---|---|
| Needham | Maintain | Hold | 2025-10-30 |
| Stifel | Downgrade | Hold | 2025-09-19 |
| Citigroup | Downgrade | Neutral | 2025-09-17 |
| Wells Fargo | Upgrade | Equal Weight | 2025-08-22 |
| BMO Capital | Downgrade | Market Perform | 2025-08-22 |
| Keybanc | Downgrade | Sector Weight | 2025-08-22 |
| Needham | Downgrade | Hold | 2025-08-22 |
| Barclays | Maintain | Equal Weight | 2025-08-22 |
| Deutsche Bank | Maintain | Hold | 2025-08-22 |
| Jefferies | Maintain | Hold | 2025-08-21 |
Dayforce Inc’s grades predominantly trend toward hold and neutral, with several downgrades and few upgrades, indicating a more cautious outlook.
Which company has the best grades?
Strategy Inc has received consistently stronger grades, mostly buys and outperforms, while Dayforce Inc’s ratings are mostly hold or neutral. This disparity could influence investors seeking growth or stability differently.
Strengths and Weaknesses
Below is a comparative overview of key strengths and weaknesses for Strategy Inc (MSTR) and Dayforce Inc (DAY) based on recent financial and operational data.
| Criterion | Strategy Inc (MSTR) | Dayforce Inc (DAY) |
|---|---|---|
| Diversification | Moderate: Revenue mainly from Maintenance (244M) and Licensing (49M) with some Subscription and Services | High: Strong recurring revenue from Cloud Dayforce (1.34B) and Powerpay (103M), plus professional services (243M) |
| Profitability | Weak: Negative net margin (-252%), ROIC -4.38%, shedding value with declining profitability | Weak: Slightly positive net margin (1.03%), ROIC 1.31%, shedding value but improving profitability |
| Innovation | Moderate: Technology services contribute 64M but declining revenue trend | Moderate to strong: Cloud-based services growing, indicating ongoing innovation and scalability |
| Global presence | Limited data, likely moderate given product licensing and services focus | Strong: Cloud services imply extensive global reach and scalability |
| Market Share | Niche market with specialized software offerings, facing profitability challenges | Growing market share in cloud HR/payroll solutions with expanding recurring revenue base |
In summary, both companies face profitability challenges, but Dayforce Inc shows improving returns and stronger recurring revenue streams, suggesting better growth potential. Strategy Inc’s value destruction and declining returns require cautious risk management before investment.
Risk Analysis
Below is a comparative risk assessment table for Strategy Inc (MSTR) and Dayforce Inc (DAY) based on the latest 2024 data.
| Metric | Strategy Inc (MSTR) | Dayforce Inc (DAY) |
|---|---|---|
| Market Risk | High beta at 3.43, volatile price range (149.75-457.22) | Moderate beta at 1.18, stable range (48.01-75.14) |
| Debt Level | Moderate debt-to-equity ratio 0.4, debt/assets 28.09% | Moderate debt-to-equity ratio 0.48, debt/assets 13.52% |
| Regulatory Risk | Exposure to bitcoin treasury regulations globally | HCM software industry with compliance demands in US, Canada, and internationally |
| Operational Risk | Reliant on AI analytics and bitcoin exposure; low current ratio at 0.71 signals liquidity concerns | Larger workforce (9600 employees); better liquidity (current ratio 1.13) but low profitability |
| Environmental Risk | Low direct environmental footprint typical for software firms | Similar low footprint, cloud services reduce physical resource dependency |
| Geopolitical Risk | Significant international operations including volatile regions | International presence but less exposure to high-risk regions |
In synthesis, Strategy Inc faces the highest market risk due to its high beta and bitcoin asset exposure, combined with liquidity constraints and unfavorable profitability metrics. Dayforce Inc has lower market risk but suffers from weak profitability and a distressed Altman Z-Score, signaling higher financial distress risk. Investors should weigh Strategy’s volatility and bitcoin reliance against Dayforce’s operational scale but financial fragility.
Which Stock to Choose?
Strategy Inc (MSTR) shows a declining income trend with unfavorable profitability and financial ratios, including a negative net margin of -251.7% and a current ratio below 1. Debt levels are moderate, and the company holds a very favorable A- rating despite value destruction indicated by its negative ROIC versus WACC.
Dayforce Inc (DAY) presents a generally favorable income evolution with positive revenue growth and a gross margin of 46.1%. Most financial ratios are unfavorable or neutral, with a current ratio above 1 and moderate debt. Despite these challenges, it maintains a very favorable C- rating but shows signs of value destruction with slightly unfavorable ROIC.
Considering ratings and the overall financial picture, MSTR’s strong rating contrasts with its poor income and ratio metrics, while DAY’s favorable income growth and improving ROIC trend might appeal differently. Risk-averse investors might find DAY’s improving fundamentals more reassuring, whereas risk-tolerant investors focusing on rating strength could interpret MSTR’s profile as an opportunity, albeit with caution.
Disclaimer: Investment carries a risk of loss of initial capital. The past performance is not a reliable indicator of future results. Be sure to understand risks before making an investment decision.
Go Further
I encourage you to read the complete analyses of Strategy Inc and Dayforce Inc to enhance your investment decisions: