In the dynamic world of software applications, Shopify Inc. and Dayforce Inc. stand out as influential players shaping distinct but overlapping markets. Shopify, a leader in commerce platforms, empowers merchants globally to manage and grow their businesses online and offline. Meanwhile, Dayforce specializes in human capital management, streamlining HR and payroll services across multiple regions. This article will explore their strategies and market positions to help you identify the most promising investment opportunity.
Table of contents
Companies Overview
I will begin the comparison between Shopify Inc. and Dayforce Inc by providing an overview of these two companies and their main differences.
Shopify Inc. Overview
Shopify Inc. is a commerce company headquartered in Ottawa, Canada, offering a comprehensive platform that enables merchants to manage and sell products across multiple channels globally. Its services include product management, payment processing, order fulfillment, and customer relationship tools. Shopify operates in the software application industry and supports merchants with additional solutions like custom themes, apps, and financing.
Dayforce Inc Overview
Dayforce Inc., based in Minneapolis, Minnesota, provides human capital management (HCM) software, focusing on HR, payroll, benefits, and talent management through its cloud platform. Serving both large enterprises and small businesses, Dayforce sells its solutions via direct and third-party channels. The company competes in the software application sector with a specialized focus on workforce management and payroll services internationally.
Key similarities and differences
Both Shopify and Dayforce operate in the technology sector, specifically within software applications, but they target distinct markets: Shopify serves e-commerce merchants, while Dayforce focuses on human capital and payroll management. Shopify’s platform emphasizes commerce facilitation across sales channels, whereas Dayforce concentrates on cloud-based HR and payroll solutions. The companies differ significantly in market capitalization, with Shopify at 205B and Dayforce at 11B USD, reflecting their scale and market reach.
Income Statement Comparison
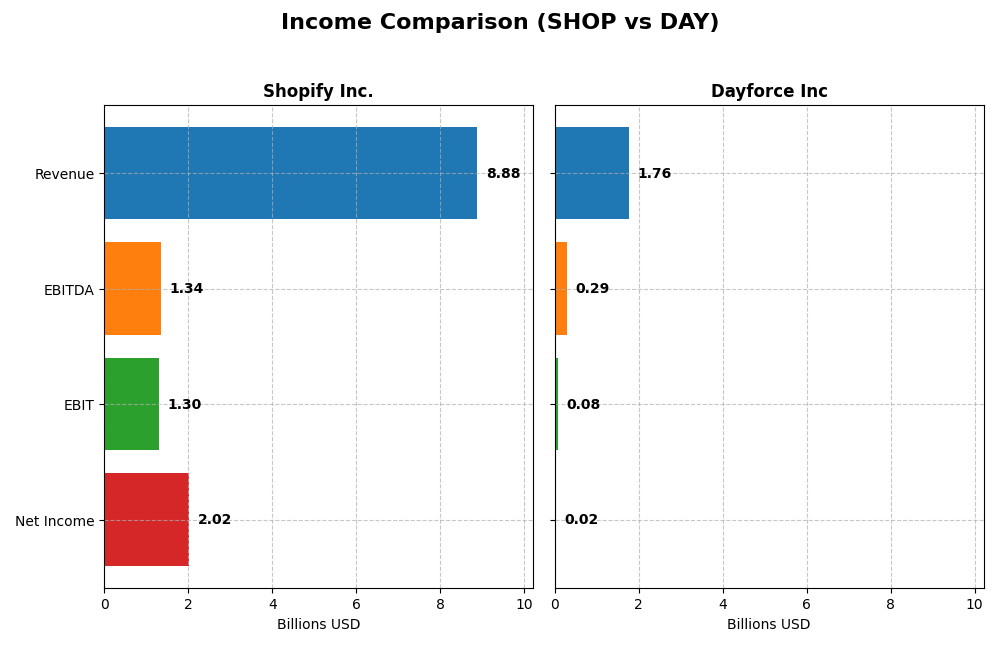
This table presents a factual comparison of key income statement metrics for Shopify Inc. and Dayforce Inc. based on their most recent fiscal year 2024 data.
| Metric | Shopify Inc. (SHOP) | Dayforce Inc (DAY) |
|---|---|---|
| Market Cap | 205B | 11.1B |
| Revenue | 8.88B | 1.76B |
| EBITDA | 1.34B | 288M |
| EBIT | 1.30B | 78.2M |
| Net Income | 2.02B | 18.1M |
| EPS | 1.56 | 0.11 |
| Fiscal Year | 2024 | 2024 |
Income Statement Interpretations
Shopify Inc.
Shopify Inc. showed strong growth from 2020 to 2024, with revenue rising from $2.9B to $8.9B and net income improving from $320M to $2.0B. Margins remained robust, with a gross margin of 50.36% and net margin of 22.74% in 2024. The most recent year evidenced accelerated growth in revenue and profitability, signaling improved operational efficiency and solid margin expansion.
Dayforce Inc
Dayforce Inc’s revenue increased steadily from $842M in 2020 to $1.76B in 2024, with net income growing from a loss of $4M to a positive $18M. Margins were moderate, with a 46.14% gross margin but a thin net margin of 1.03% in 2024. Despite favorable revenue growth, recent operating profit and net margin growth slowed, reflecting some pressure on operational expenses and earnings.
Which one has the stronger fundamentals?
Shopify exhibits stronger fundamentals overall, with consistently higher margins, significant earnings growth, and a favorable income statement evaluation across all metrics. Dayforce, while growing revenue and net income over the period, shows mixed margin performance and recent declines in EBIT and net margin growth, indicating some operational challenges.
Financial Ratios Comparison
The following table presents a side-by-side comparison of key financial ratios for Shopify Inc. and Dayforce Inc based on their most recent fiscal year data (2024). These ratios provide insights into profitability, valuation, liquidity, leverage, and operational efficiency.
| Ratios | Shopify Inc. (SHOP) | Dayforce Inc (DAY) |
|---|---|---|
| ROE | 17.5% | 0.7% |
| ROIC | 7.5% | 1.3% |
| P/E | 68.2 | 633.3 |
| P/B | 11.9 | 4.5 |
| Current Ratio | 3.71 | 1.13 |
| Quick Ratio | 3.70 | 1.13 |
| D/E (Debt to Equity) | 0.10 | 0.48 |
| Debt-to-Assets | 8.1% | 13.5% |
| Interest Coverage | 0 | 2.56 |
| Asset Turnover | 0.64 | 0.19 |
| Fixed Asset Turnover | 63.4 | 7.46 |
| Payout ratio | 0 | 0 |
| Dividend yield | 0 | 0 |
Interpretation of the Ratios
Shopify Inc.
Shopify shows a mix of strong and weak ratios in 2024, with favorable net margin (22.74%) and ROE (17.47%), but unfavorable high P/E (68.18) and P/B (11.91) ratios, indicating premium valuation. The current ratio is also unfavorable at 3.71, but the quick ratio and low debt levels are favorable. Shopify pays no dividends, focusing on reinvestment and growth.
Dayforce Inc
Dayforce’s 2024 ratios are mostly unfavorable, including low net margin (1.03%) and ROE (0.71%), with an extremely high P/E of 633.29 signaling overvaluation or low earnings. The company’s current ratio is neutral, and debt levels are moderate but interest coverage is weak. Dayforce does not pay dividends, likely prioritizing reinvestment and development.
Which one has the best ratios?
Shopify’s ratios are slightly favorable overall, benefiting from strong profitability and low leverage despite some valuation concerns. In contrast, Dayforce’s ratios are predominantly unfavorable, reflecting weaker profitability and valuation challenges. Based on these evaluations, Shopify presents a comparatively stronger financial profile in 2024.
Strategic Positioning
This section compares the strategic positioning of Shopify Inc. and Dayforce Inc., including market position, key segments, and exposure to technological disruption:
Shopify Inc.
- Large market cap of 205B, operating globally with high beta indicating competitive pressure
- Key segments include Merchant Solutions and Subscription Services driving revenue growth
- Exposure to digital commerce disruption through multi-channel sales platforms
Dayforce Inc
- Smaller market cap of 11B, US and international presence with moderate beta and competitive pressure
- Focus on cloud HCM platforms, payroll, and professional services targeting small to large businesses
- Cloud-based HCM solutions face ongoing technological evolution in payroll and workforce management
Shopify Inc. vs Dayforce Inc Positioning
Shopify pursues a diversified commerce platform strategy across multiple sales channels, while Dayforce concentrates on cloud-based human capital management solutions. Shopify’s broad merchant ecosystem contrasts with Dayforce’s focused payroll and HR services, reflecting differing market scopes and business drivers.
Which has the best competitive advantage?
Both companies show slightly unfavorable MOATs due to ROIC below WACC but with growing profitability trends. Neither demonstrates a strong sustained competitive advantage based on current MOAT evaluations.
Stock Comparison
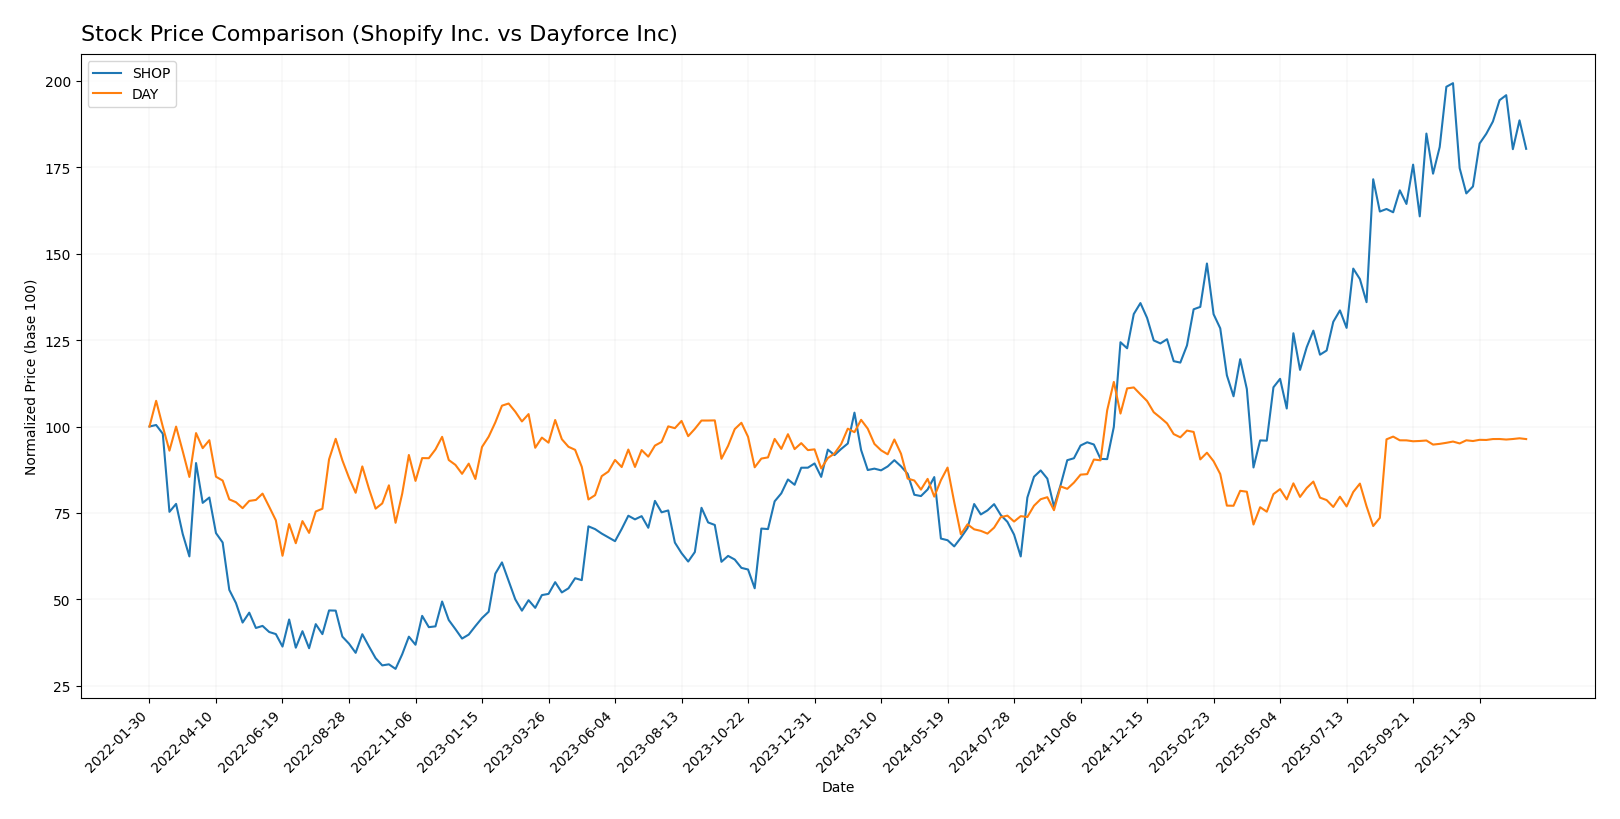
The stock price chart illustrates significant price movements and contrasting trading dynamics between Shopify Inc. and Dayforce Inc over the past year, highlighting Shopify’s strong gains versus Dayforce’s modest decline.
Trend Analysis
Shopify Inc. exhibited a bullish trend over the past 12 months with a price increase of 106.32%, though the trend shows signs of deceleration. The stock recorded a high of 173.86 and a low of 54.43, accompanied by a high volatility level (std deviation 33.7).
Dayforce Inc. experienced a bearish trend with a 3.03% price decline over the same period, but the negative trend is accelerating. The stock’s price fluctuated between 49.46 and 81.14, with moderate volatility (std deviation 7.84).
Comparing both, Shopify delivered the highest market performance by a wide margin, showing a strong bullish trend, whereas Dayforce’s stock weakened slightly despite recent stabilization.
Target Prices
The current target price consensus reflects moderate optimism among analysts for these technology firms.
| Company | Target High | Target Low | Consensus |
|---|---|---|---|
| Shopify Inc. | 200 | 140 | 186.24 |
| Dayforce Inc | 70 | 70 | 70 |
Analysts see Shopify’s price rising from its current 157.47 USD toward the consensus of 186.24 USD, signaling upside potential. Dayforce’s target matches closely its current price of 69.26 USD, indicating a stable outlook.
Analyst Opinions Comparison
This section compares analysts’ ratings and grades for Shopify Inc. and Dayforce Inc.:
Rating Comparison
SHOP Rating
- Rating: B, considered very favorable by analysts.
- Discounted Cash Flow Score: Moderate at 3, indicating balanced valuation outlook.
- ROE Score: Favorable score of 4, showing efficient profit generation from equity.
- ROA Score: Very favorable at 5, signaling strong asset utilization to generate earnings.
- Debt To Equity Score: Moderate at 3, indicating average financial risk level.
- Overall Score: Moderate at 3, summarizing a balanced financial standing.
DAY Rating
- Rating: C-, also classified as very favorable despite a lower grade.
- Discounted Cash Flow Score: Moderate at 2, reflecting a slightly less favorable valuation.
- ROE Score: Very unfavorable at 1, indicating weak efficiency in generating profit from equity.
- ROA Score: Very unfavorable at 1, suggesting poor asset efficiency.
- Debt To Equity Score: Moderate at 2, slightly lower than SHOP’s but still moderate risk.
- Overall Score: Very unfavorable at 1, highlighting significant financial challenges.
Which one is the best rated?
Based strictly on the provided data, Shopify Inc. holds a higher overall rating of B with better scores in ROE and ROA, indicating stronger profitability and asset efficiency compared to Dayforce Inc., which has a lower C- rating and weaker financial metrics.
Scores Comparison
Here is a comparison of the Altman Z-Score and Piotroski Score for Shopify Inc. and Dayforce Inc:
SHOP Scores
- Altman Z-Score: 50.42, in the safe zone, indicating very low bankruptcy risk.
- Piotroski Score: 6, considered average financial strength.
DAY Scores
- Altman Z-Score: 1.24, in the distress zone, indicating high bankruptcy risk.
- Piotroski Score: 5, considered average financial strength.
Which company has the best scores?
Based strictly on the provided data, Shopify has a significantly higher Altman Z-Score indicating stronger financial stability, while both companies have similar average Piotroski Scores.
Grades Comparison
Here is a detailed comparison of the grades assigned to Shopify Inc. and Dayforce Inc by various reliable grading companies:
Shopify Inc. Grades
The table below summarizes recent grades from reputable financial institutions for Shopify Inc.:
| Grading Company | Action | New Grade | Date |
|---|---|---|---|
| Scotiabank | Upgrade | Sector Outperform | 2026-01-08 |
| Wolfe Research | Downgrade | Peer Perform | 2026-01-06 |
| Wells Fargo | Maintain | Overweight | 2025-12-17 |
| Truist Securities | Maintain | Hold | 2025-11-05 |
| CIBC | Maintain | Outperform | 2025-11-05 |
| Cantor Fitzgerald | Maintain | Neutral | 2025-11-05 |
| DA Davidson | Maintain | Buy | 2025-11-05 |
| Scotiabank | Maintain | Sector Perform | 2025-11-05 |
| Needham | Maintain | Buy | 2025-11-05 |
| JP Morgan | Maintain | Overweight | 2025-11-05 |
Shopify’s grades show a generally positive trend with several “Buy” and “Outperform” ratings, alongside a recent upgrade by Scotiabank, indicating optimism about the stock’s prospects.
Dayforce Inc Grades
The table below presents recent grades from credible grading firms for Dayforce Inc:
| Grading Company | Action | New Grade | Date |
|---|---|---|---|
| Needham | Maintain | Hold | 2025-10-30 |
| Stifel | Downgrade | Hold | 2025-09-19 |
| Citigroup | Downgrade | Neutral | 2025-09-17 |
| Wells Fargo | Upgrade | Equal Weight | 2025-08-22 |
| BMO Capital | Downgrade | Market Perform | 2025-08-22 |
| Keybanc | Downgrade | Sector Weight | 2025-08-22 |
| Needham | Downgrade | Hold | 2025-08-22 |
| Barclays | Maintain | Equal Weight | 2025-08-22 |
| Deutsche Bank | Maintain | Hold | 2025-08-22 |
| Jefferies | Maintain | Hold | 2025-08-21 |
Dayforce’s grades trend toward neutrality or hold status, with multiple downgrades and no “Buy” ratings, reflecting a cautious outlook from analysts.
Which company has the best grades?
Shopify Inc. has received significantly stronger grades compared to Dayforce Inc, with a majority of “Buy” and “Outperform” ratings versus Dayforce’s “Hold” and “Neutral” consensus. This divergence suggests Shopify is currently viewed more favorably by analysts, potentially influencing investor confidence and portfolio decisions.
Strengths and Weaknesses
Below is a comparison of the key strengths and weaknesses of Shopify Inc. (SHOP) and Dayforce Inc. (DAY) based on recent financial and operational data.
| Criterion | Shopify Inc. (SHOP) | Dayforce Inc. (DAY) |
|---|---|---|
| Diversification | Strong, with significant growth in Merchant Solutions and Subscription Services, totaling over 8B USD in 2024 | Moderate, focused mainly on Cloud Dayforce and Powerpay recurring services, around 1.6B USD in 2024 |
| Profitability | Favorable net margin at 22.74% and ROE at 17.47%, but ROIC below WACC indicating value destruction | Low net margin (1.03%) and ROE (0.71%), ROIC also below WACC, signaling weak profitability |
| Innovation | High innovation with growing ROIC trend despite current value shedding | Growing ROIC trend but overall still shedding value, innovation momentum less clear |
| Global presence | Strong global e-commerce platform presence with expanding services | More niche, primarily North American cloud-based payroll and HR services |
| Market Share | Large and growing in e-commerce solutions, high fixed asset turnover (63.43) | Smaller in market share with lower asset turnover (7.46), but stable recurring revenues |
In summary, Shopify leads with strong diversification, profitability, and innovation momentum despite current challenges in value creation. Dayforce shows steady growth in recurring revenues but struggles with profitability and market scale, indicating higher investment risk.
Risk Analysis
Below is a comparative risk assessment table for Shopify Inc. (SHOP) and Dayforce Inc. (DAY) based on the most recent data from 2024.
| Metric | Shopify Inc. (SHOP) | Dayforce Inc. (DAY) |
|---|---|---|
| Market Risk | High beta 2.84 indicates significant price volatility vs. market | Moderate beta 1.18 suggests lower volatility |
| Debt Level | Low debt-to-equity 0.1, low debt-to-assets 8.1% (favorable) | Higher debt-to-equity 0.48, debt-to-assets 13.5% (favorable but higher) |
| Regulatory Risk | Moderate, operating globally with diverse compliance requirements | Moderate, US and international HCM software with data privacy concerns |
| Operational Risk | Medium, reliant on platform stability and merchant adoption | Medium, dependent on cloud platform performance and client retention |
| Environmental Risk | Low, primarily digital services with minimal direct environmental impact | Low, software company with limited environmental footprint |
| Geopolitical Risk | Moderate, global presence exposes to regional instabilities | Moderate, US-based but with international exposure |
Synthesis: Shopify faces higher market volatility and unfavorable valuation ratios, but benefits from low leverage and strong financial health (safe Altman Z-Score). Dayforce carries higher financial risk, reflected in a distress-level Altman Z-Score and weaker profitability, increasing bankruptcy risk despite moderate debt levels. Market and financial risks are the most impactful for investors in both companies.
Which Stock to Choose?
Shopify Inc. (SHOP) shows strong income growth with a 25.78% revenue increase in 2024 and favorable profitability metrics including a 22.74% net margin. Its financial ratios are slightly favorable overall, supported by low debt levels and a very favorable interest coverage, though valuation ratios like P/E and P/B appear high. The company holds a solid B rating and demonstrates a growing but slightly unfavorable moat due to ROIC below WACC.
Dayforce Inc (DAY) presents moderate revenue growth of 16.27% in 2024 but weaker profitability, with a net margin near 1.03% and several unfavorable financial ratios including a high P/E and low asset turnover. Its debt is higher but manageable, while the overall rating is C- with a slightly unfavorable moat similar to SHOP, reflecting value destruction despite improving ROIC trends.
Investors prioritizing growth and profitability may find Shopify’s strong income evolution and favorable financial metrics more appealing, while those with tolerance for risk and interest in companies with improving ROIC but currently weaker ratios might consider Dayforce. The differing income statement strengths and rating profiles suggest the choice depends on an investor’s risk appetite and investment strategy focus.
Disclaimer: Investment carries a risk of loss of initial capital. The past performance is not a reliable indicator of future results. Be sure to understand risks before making an investment decision.
Go Further
I encourage you to read the complete analyses of Shopify Inc. and Dayforce Inc to enhance your investment decisions: