In the rapidly evolving software application industry, Salesforce, Inc. (CRM) and Dayforce Inc. (DAY) stand out as key players with distinct yet overlapping focuses. Salesforce leads in customer relationship management and enterprise cloud solutions, while Dayforce specializes in human capital management software. Both companies emphasize innovation and cloud technology, making them compelling choices for investors seeking growth in tech-driven markets. This analysis will reveal which company holds the most promise for your investment portfolio.
Table of contents
Companies Overview
I will begin the comparison between Salesforce and Dayforce by providing an overview of these two companies and their main differences.
Salesforce Overview
Salesforce, Inc. is a leading provider of customer relationship management (CRM) technology, headquartered in San Francisco, CA. Its Customer 360 platform integrates sales, service, marketing, commerce, and analytics to deliver connected customer experiences globally. The company serves multiple industries with a flexible platform and additional offerings like Slack, Tableau, and MuleSoft, employing over 76K people and holding a market cap of $219B.
Dayforce Overview
Dayforce Inc, based in Minneapolis, MN, specializes in human capital management (HCM) software, offering a cloud platform for HR, payroll, benefits, workforce, and talent management. The company targets both enterprise and small business markets through solutions like Dayforce and Powerpay. It has about 9.6K employees and a market cap of $11B, reflecting its focused niche within the technology sector.
Key similarities and differences
Both Salesforce and Dayforce operate in the software application industry with cloud-based platforms, targeting business process optimization. Salesforce’s model is broader, focusing on CRM and customer experience across various industries, while Dayforce concentrates on HCM functions. The scale difference is significant, with Salesforce much larger in market cap and workforce. Both utilize direct sales and third-party channels for distribution but serve distinct aspects of enterprise software needs.
Income Statement Comparison
The table below presents a side-by-side comparison of key income statement metrics for Salesforce, Inc. (CRM) and Dayforce Inc (DAY) for their most recent fiscal years.
| Metric | Salesforce, Inc. (CRM) | Dayforce Inc (DAY) |
|---|---|---|
| Market Cap | 219B | 11.1B |
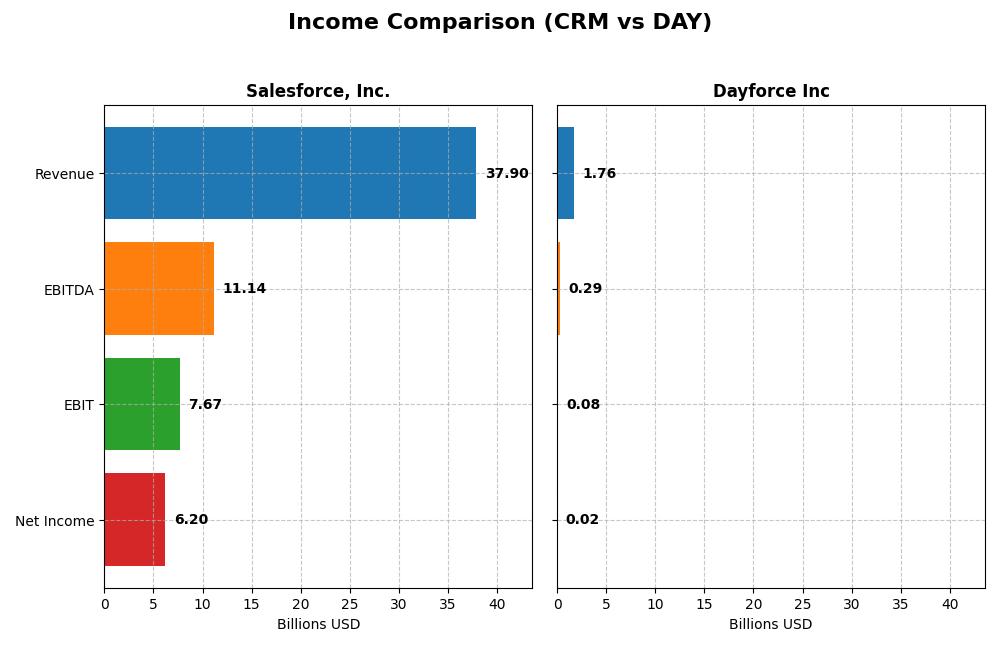
| Revenue | 37.9B | 1.76B |
| EBITDA | 11.1B | 288M |
| EBIT | 7.67B | 78.2M |
| Net Income | 6.20B | 18.1M |
| EPS | 6.44 | 0.11 |
| Fiscal Year | 2025 | 2024 |
Income Statement Interpretations
Salesforce, Inc.
Salesforce showed strong revenue growth from $21.3B in 2021 to nearly $38B in 2025, with net income increasing from $4.07B to $6.2B over the same period. Margins remained robust, with a gross margin around 77% and net margin near 16% in 2025. The latest fiscal year saw revenue growth of 8.7% and a substantial 38% increase in net margin, signaling improved profitability.
Dayforce Inc
Dayforce’s revenue rose from $842M in 2020 to $1.76B in 2024, with net income turning positive and reaching $18.1M in 2024 after losses in prior years. Gross margins improved to 46%, but EBIT and net margins remained low at 4.4% and around 1%, reflecting operational challenges. The most recent year showed 16% revenue growth but a decline in EBIT and net margin, indicating margin pressure.
Which one has the stronger fundamentals?
Salesforce demonstrates stronger fundamentals with consistently high margins and solid profitability growth, including favorable margin and EPS expansions. Dayforce exhibits rapid revenue and net income growth from a low base but faces margin compression and less stable earnings. Overall, Salesforce’s income statement reflects greater stability and profitability compared to Dayforce’s emerging but volatile performance.
Financial Ratios Comparison
The table below presents a side-by-side comparison of key financial ratios for Salesforce, Inc. (CRM) and Dayforce Inc (DAY) based on their most recent fiscal year data, providing insight into their profitability, liquidity, leverage, efficiency, and dividend metrics.
| Ratios | Salesforce, Inc. (CRM) | Dayforce Inc (DAY) |
|---|---|---|
| ROE | 10.13% | 0.71% |
| ROIC | 7.95% | 1.31% |
| P/E | 53.04 | 633.29 |
| P/B | 5.37 | 4.50 |
| Current Ratio | 1.06 | 1.13 |
| Quick Ratio | 1.06 | 1.13 |
| D/E | 0.19 | 0.48 |
| Debt-to-Assets | 11.07% | 13.52% |
| Interest Coverage | 26.49 | 2.56 |
| Asset Turnover | 0.37 | 0.19 |
| Fixed Asset Turnover | 7.03 | 7.46 |
| Payout ratio | 24.80% | 0% |
| Dividend yield | 0.47% | 0% |
Interpretation of the Ratios
Salesforce, Inc.
Salesforce presents a slightly favorable ratio profile with strong net margin at 16.35% and excellent interest coverage at 28.18, but valuation ratios like PE at 53.04 and PB at 5.37 are unfavorable, signaling expensive pricing. Its dividend yield is low at 0.47%, reflecting modest shareholder returns supported by a stable payout ratio without aggressive buybacks.
Dayforce Inc
Dayforce’s ratios are mostly unfavorable with weak profitability metrics: net margin at 1.03%, ROE at 0.71%, and interest coverage at 1.93. Valuation multiples are extremely high, including a PE ratio of 633.29, suggesting overvaluation. The company does not pay dividends, likely due to reinvestment in growth and a focus on operations rather than shareholder returns.
Which one has the best ratios?
Salesforce holds the advantage with a more balanced financial profile, showing multiple favorable ratios in profitability, leverage, and liquidity, despite some valuation concerns. Dayforce’s weaker profitability and elevated valuation ratios, combined with no dividend payments, contribute to its overall unfavorable ratio evaluation compared to Salesforce.
Strategic Positioning
This section compares the strategic positioning of Salesforce, Inc. (CRM) and Dayforce Inc (DAY) regarding market position, key segments, and exposure to technological disruption:
Salesforce, Inc.
- Leading CRM software provider with strong NYSE presence and large market capitalization (218B USD).
- Diverse product portfolio: Sales, Service, Marketing, Commerce Clouds, Analytics, Integration, and Professional Services.
- Continuous innovation in CRM tech; integration of platforms like Slack and Tableau mitigates disruption risks.
Dayforce Inc
- Smaller market cap (11B USD), focused on HCM software in US, Canada, and internationally.
- Core focus on cloud HCM platform including HR, payroll, benefits, and talent management.
- Cloud-based HR and payroll solutions expose it to evolving cloud and SaaS technologies but narrower scope.
Salesforce, Inc. vs Dayforce Inc Positioning
Salesforce exhibits a diversified technology portfolio across multiple customer engagement segments, leveraging scale and integration. Dayforce concentrates on human capital management software with a narrower product line but international reach. Salesforce’s broad segments offer resilience, while Dayforce’s focus may limit diversification.
Which has the best competitive advantage?
Both companies show slightly unfavorable MOATs with value destruction but improving ROIC trends. Salesforce’s larger scale and product breadth suggest stronger competitive positioning, though both face profitability challenges needing attention.
Stock Comparison
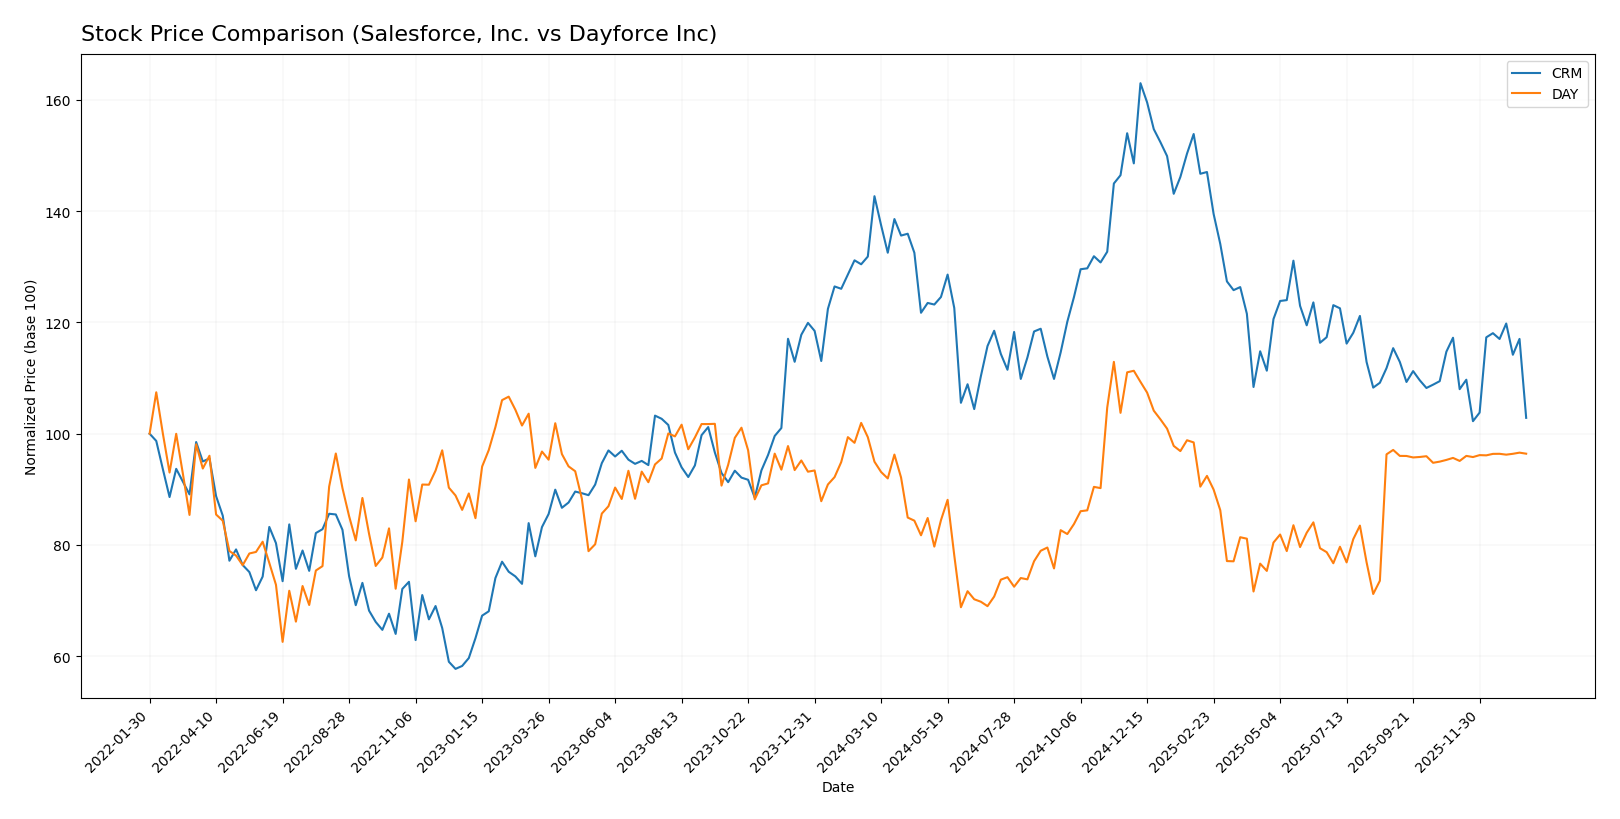
The stock price movements of Salesforce, Inc. (CRM) and Dayforce Inc (DAY) over the past year reveal distinct bearish trends with varying degrees of acceleration and volatility in their trading dynamics.
Trend Analysis
Salesforce, Inc. (CRM) experienced a bearish trend with a -21.98% price change over the past 12 months, showing accelerating decline and high volatility (std deviation 31.8). The stock hit a high of 361.99 and a low of 227.11.
Dayforce Inc (DAY) also followed a bearish trend with a -2.99% price change over the same period, marked by acceleration but lower volatility (std deviation 7.84). The stock ranged between 81.14 and 49.46.
Comparing both, CRM’s stock showed a sharper decline and higher volatility than DAY, leading to a weaker market performance over the past year.
Target Prices
The current analyst consensus on target prices reflects a generally optimistic outlook for both Salesforce, Inc. and Dayforce Inc.
| Company | Target High | Target Low | Consensus |
|---|---|---|---|
| Salesforce, Inc. | 400 | 250 | 324.17 |
| Dayforce Inc | 70 | 70 | 70 |
Analysts expect Salesforce’s stock to appreciate significantly from its current price of 228.7 USD, while Dayforce’s target consensus aligns closely with its current price near 69.28 USD, indicating a stable valuation outlook.
Analyst Opinions Comparison
This section compares analysts’ ratings and grades for Salesforce, Inc. and Dayforce Inc:
Rating Comparison
Salesforce, Inc. Rating
- Rating: B+, indicating a very favorable assessment by analysts.
- Discounted Cash Flow Score: 4, showing favorable future cash flow projections.
- ROE Score: 4, investors see efficient profit generation from equity.
- ROA Score: 4, demonstrating effective asset utilization.
- Debt To Equity Score: 3, reflecting moderate financial risk.
- Overall Score: 3, a moderate summary of financial standing.
Dayforce Inc Rating
- Rating: C-, reflecting a very unfavorable analyst evaluation.
- Discounted Cash Flow Score: 2, indicating a moderate valuation outlook.
- ROE Score: 1, showing very unfavorable efficiency in equity use.
- ROA Score: 1, indicating very unfavorable asset use efficiency.
- Debt To Equity Score: 2, suggesting moderate leverage concerns.
- Overall Score: 1, signaling a very unfavorable overall financial position.
Which one is the best rated?
Based strictly on the provided data, Salesforce, Inc. holds higher ratings and scores across all key metrics compared to Dayforce Inc. Salesforce is clearly better rated, showing stronger financial performance and lower risk indicators.
Scores Comparison
The comparison of scores for Salesforce, Inc. and Dayforce Inc highlights their financial health assessments:
Salesforce Scores
- Altman Z-Score: 5.26, indicating a safe zone with low bankruptcy risk.
- Piotroski Score: 7, showing strong financial strength.
Dayforce Scores
- Altman Z-Score: 1.24, indicating distress zone with high bankruptcy risk.
- Piotroski Score: 5, reflecting average financial strength.
Which company has the best scores?
Based strictly on the provided data, Salesforce shows a safer financial position with a higher Altman Z-Score and stronger Piotroski Score compared to Dayforce, which is in distress and has average financial strength.
Grades Comparison
Here is a comparison of recent reliable grades and ratings for Salesforce, Inc. and Dayforce Inc:
Salesforce, Inc. Grades
This table summarizes recent grades from recognized grading companies for Salesforce, Inc.
| Grading Company | Action | New Grade | Date |
|---|---|---|---|
| Barclays | maintain | Overweight | 2026-01-12 |
| RBC Capital | maintain | Sector Perform | 2026-01-05 |
| Morgan Stanley | maintain | Overweight | 2025-12-09 |
| Citigroup | maintain | Neutral | 2025-12-08 |
| DA Davidson | maintain | Neutral | 2025-12-05 |
| Citizens | maintain | Market Outperform | 2025-12-04 |
| Deutsche Bank | maintain | Buy | 2025-12-04 |
| Wedbush | maintain | Outperform | 2025-12-04 |
| Northland Capital Markets | maintain | Market Perform | 2025-12-04 |
| Canaccord Genuity | maintain | Buy | 2025-12-04 |
Overall, Salesforce, Inc. exhibits a predominantly positive rating trend, with multiple buy and outperform grades and no downgrades.
Dayforce Inc Grades
This table presents recent grades from recognized grading companies for Dayforce Inc.
| Grading Company | Action | New Grade | Date |
|---|---|---|---|
| Needham | maintain | Hold | 2025-10-30 |
| Stifel | downgrade | Hold | 2025-09-19 |
| Citigroup | downgrade | Neutral | 2025-09-17 |
| Wells Fargo | upgrade | Equal Weight | 2025-08-22 |
| BMO Capital | downgrade | Market Perform | 2025-08-22 |
| Keybanc | downgrade | Sector Weight | 2025-08-22 |
| Needham | downgrade | Hold | 2025-08-22 |
| Barclays | maintain | Equal Weight | 2025-08-22 |
| Deutsche Bank | maintain | Hold | 2025-08-22 |
| Jefferies | maintain | Hold | 2025-08-21 |
Dayforce Inc’s ratings show a general trend toward neutral to hold positions, with several downgrades and no strong buy or buy ratings recently.
Which company has the best grades?
Salesforce, Inc. has received stronger and more positive grades than Dayforce Inc, featuring multiple buy and outperform ratings versus Dayforce’s mostly hold and neutral grades. Investors may see Salesforce’s ratings as reflecting higher confidence in performance and potential growth.
Strengths and Weaknesses
Below is a comparative table summarizing the key strengths and weaknesses of Salesforce, Inc. (CRM) and Dayforce Inc (DAY) based on their latest financial and operational data.
| Criterion | Salesforce, Inc. (CRM) | Dayforce Inc (DAY) |
|---|---|---|
| Diversification | Highly diversified across multiple cloud services, including Sales, Service, Marketing, Integration, and Professional Services generating multi-billion revenues each | Less diversified, primarily focused on Cloud Dayforce and Powerpay recurring services, smaller revenue base (~1.5B total) |
| Profitability | Moderate profitability with net margin at 16.35% and ROIC at 7.95%, but currently shedding value (ROIC < WACC) | Low profitability, net margin at 1.03%, ROIC at 1.31%, also shedding value with a large gap between ROIC and WACC |
| Innovation | Strong innovation reflected in growing ROIC trend (+761.9%) and expanding cloud offerings | Positive innovation trend with very strong ROIC growth (+2303.9%), but profitability remains low |
| Global presence | Extensive global footprint supporting diverse cloud solutions | Smaller scale global presence focused on HR and payroll cloud solutions |
| Market Share | Leading market position in CRM and cloud software space | Niche player in cloud HR/payroll market with limited market share |
Key takeaways: Salesforce demonstrates strong diversification and innovation with solid profitability metrics despite currently shedding value, indicating potential for recovery. Dayforce shows promising innovation growth but suffers from weak profitability and limited diversification, posing higher investment risk. Both companies require cautious monitoring.
Risk Analysis
Below is a comparative table summarizing key risks for Salesforce, Inc. (CRM) and Dayforce Inc. (DAY) based on the latest available data for 2025 and 2024 respectively:
| Metric | Salesforce, Inc. (CRM) | Dayforce Inc (DAY) |
|---|---|---|
| Market Risk | Beta 1.27 (moderate volatility) | Beta 1.18 (moderate volatility) |
| Debt level | Low debt-to-equity ratio 0.19 (favorable) | Moderate debt-to-equity ratio 0.48 (favorable but higher leverage) |
| Regulatory Risk | Moderate, due to global operations and software industry compliance | Moderate, focused on US/Canada markets with payroll and HR regulations |
| Operational Risk | Medium, complexity from multiple product lines and acquisitions | Medium, reliance on cloud platform stability and integration |
| Environmental Risk | Low, primarily software with limited environmental footprint | Low, similar software industry profile |
| Geopolitical Risk | Moderate, global customer base exposed to international tensions | Lower, mostly North American focus |
The most significant risk for Salesforce is market volatility combined with a relatively high valuation (P/E of 53), which may impact downside in a turbulent market. Dayforce faces higher operational and financial risk, indicated by a weaker profitability profile and distress-zone Altman Z-Score, making it more vulnerable to economic shifts. Investors should weigh Salesforce’s stable financial health against Dayforce’s elevated risk and lower profitability.
Which Stock to Choose?
Salesforce, Inc. (CRM) shows favorable income evolution with 8.72% revenue growth in 2025 and strong profitability metrics, including a 16.35% net margin. Financial ratios are slightly favorable overall, supported by low debt levels and a strong interest coverage ratio, while the company faces a slightly unfavorable moat rating due to ROIC below WACC but with improving profitability.
Dayforce Inc (DAY) presents a favorable income statement over the period with 16.27% revenue growth in 2024 but mixed profitability, reflected in a low 1.03% net margin and an unfavorable overall ratios evaluation. It carries higher debt relative to EBITDA and a weaker interest coverage, alongside a slightly unfavorable moat rating, despite a growing ROIC trend.
For investors focusing on financial stability and stronger profitability, Salesforce’s metrics and rating might appear more favorable, whereas those willing to consider a company with improving profitability but higher financial risk could view Dayforce differently. The choice could depend on an investor’s tolerance for risk and preference for growth versus stability.
Disclaimer: Investment carries a risk of loss of initial capital. The past performance is not a reliable indicator of future results. Be sure to understand risks before making an investment decision.
Go Further
I encourage you to read the complete analyses of Salesforce, Inc. and Dayforce Inc to enhance your investment decisions: