In today’s fast-evolving tech landscape, selecting the right software company for your investment portfolio requires careful analysis. Dayforce Inc (DAY) and Perfect Corp. (PERF) both operate in the application software industry but target distinct markets—human capital management versus AI-driven beauty tech. Their innovative approaches and growth potential make them compelling contenders. Join me as we explore which company presents the most promising opportunity for investors in 2026.
Table of contents
Companies Overview
I will begin the comparison between Dayforce Inc and Perfect Corp. by providing an overview of these two companies and their main differences.
Dayforce Inc Overview
Dayforce Inc is a human capital management (HCM) software company headquartered in Minneapolis, Minnesota. It offers a cloud-based platform delivering HR, payroll, benefits, workforce, and talent management solutions primarily in the US, Canada, and internationally. With a market cap of $11.1B and 9,600 employees, Dayforce serves both large enterprises and small businesses through direct and third-party sales channels.
Perfect Corp. Overview
Perfect Corp. is a Taiwan-based technology company providing AI and augmented reality SaaS solutions focused on beauty and fashion tech. Its offerings include virtual try-on tools for makeup, hair, glasses, and other accessories, alongside consumer apps like YouCam. Founded in 2015, Perfect Corp. operates with a market cap of $179M and 342 employees, targeting a niche within the software application industry.
Key similarities and differences
Both Dayforce and Perfect Corp. operate in the software application industry with cloud-based solutions. However, Dayforce focuses on enterprise-level human capital management across multiple countries, emphasizing workforce and payroll services. In contrast, Perfect Corp. specializes in AI-driven beauty and fashion virtual try-on technologies, serving a more consumer-oriented and niche market primarily in Asia. Their market capitalizations and employee counts also reflect these strategic differences.
Income Statement Comparison
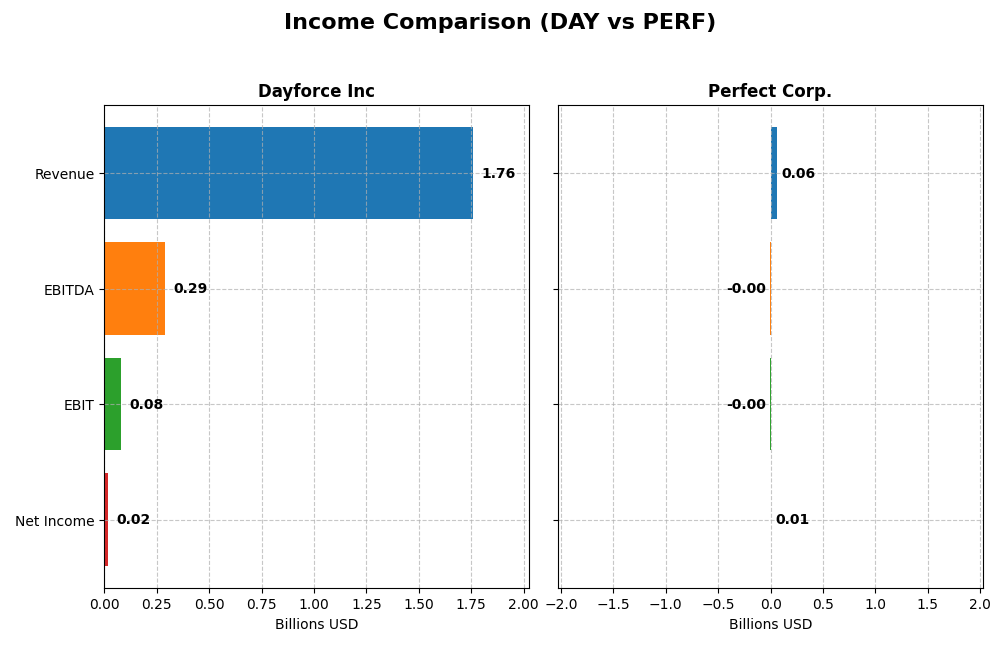
The table below provides a side-by-side comparison of key income statement metrics for Dayforce Inc and Perfect Corp. for the fiscal year 2024.
| Metric | Dayforce Inc | Perfect Corp. |
|---|---|---|
| Market Cap | 11.1B | 179M |
| Revenue | 1.76B | 60.2M |
| EBITDA | 288M | -2.05M |
| EBIT | 78.2M | -2.84M |
| Net Income | 18.1M | 5.02M |
| EPS | 0.11 | 0.05 |
| Fiscal Year | 2024 | 2024 |
Income Statement Interpretations
Dayforce Inc
Dayforce Inc showed strong revenue growth of 16.3% in 2024, continuing an overall rise of 109% since 2020. Gross margins remained favorable around 46%, but EBIT margin declined by 40.8% last year, dragging net margin growth down 71.6%. Despite a positive long-term net income increase of 553%, 2024’s net income growth and EPS fell significantly, reflecting margin compression.
Perfect Corp.
Perfect Corp. delivered steady revenue growth of 12.5% in 2024, doubling revenues since 2020. Its gross margin remained high at nearly 78%, supporting a favorable net margin of 8.3%. EBIT margin stayed negative, worsening by 151%, but net income and EPS grew overall, with net margin expanding 145% over the period. Recent one-year net margin declined slightly, though EPS rose by 8.9%.
Which one has the stronger fundamentals?
Both companies exhibit favorable revenue and net income growth over five years, but Perfect Corp. maintains higher gross and net margins, with less interest expense impact. Dayforce shows stronger long-term net income and EPS growth but faces recent margin pressures. Perfect’s consistent margin expansion contrasts with Dayforce’s recent EBIT and net margin contraction, highlighting differing fundamental strengths.
Financial Ratios Comparison
This table compares the key financial ratios of Dayforce Inc and Perfect Corp. for the fiscal year 2024, providing an overview of their profitability, liquidity, leverage, and market valuation metrics.
| Ratios | Dayforce Inc (DAY) | Perfect Corp. (PERF) |
|---|---|---|
| ROE | 0.71% | 3.42% |
| ROIC | 1.31% | -2.10% |
| P/E | 633.3 | 56.6 |
| P/B | 4.50 | 1.93 |
| Current Ratio | 1.13 | 5.52 |
| Quick Ratio | 1.13 | 5.52 |
| D/E (Debt-to-Equity) | 0.48 | 0.0035 |
| Debt-to-Assets | 13.5% | 0.28% |
| Interest Coverage | 2.56 | -449 |
| Asset Turnover | 0.19 | 0.33 |
| Fixed Asset Turnover | 7.46 | 57.94 |
| Payout ratio | 0 | 0 |
| Dividend yield | 0 | 0 |
Interpretation of the Ratios
Dayforce Inc
Dayforce Inc shows predominantly unfavorable financial ratios, with weak net margin (1.03%) and return on equity (0.71%), alongside a high price-to-earnings ratio (633.29) and low interest coverage (1.93). The company’s quick ratio and debt metrics are favorable, indicating reasonable liquidity and manageable leverage. Dayforce does not pay dividends, likely reinvesting earnings to support growth and operations.
Perfect Corp.
Perfect Corp. presents a mixed ratio profile with a neutral net margin (8.34%) but unfavorable returns on equity (3.42%) and invested capital (-2.1%). Its weighted average cost of capital is favorable at 5.96%, and it maintains no debt, reflected in strong debt-related ratios. As with Dayforce, Perfect Corp. does not pay dividends, possibly prioritizing investment in R&D and business expansion.
Which one has the best ratios?
Comparing the two, Perfect Corp. holds a slightly more favorable ratio profile with stronger liquidity, no debt, and a lower WACC, despite some unfavorable profitability metrics. Dayforce’s higher leverage and weaker profitability metrics weigh on its evaluation. Overall, both companies display more unfavorable than favorable ratios, with Perfect Corp. marginally outperforming Dayforce.
Strategic Positioning
This section compares the strategic positioning of Dayforce Inc and Perfect Corp., including market position, key segments, and exposure to technological disruption:
Dayforce Inc
- Large market cap of 11B with established presence in HCM software amid strong competition.
- Key segments include cloud HCM platform, payroll solutions, and professional services.
- Moderate exposure through cloud software but no direct mention of disruptive innovation.
Perfect Corp.
- Small market cap of 179M focused on AI and AR beauty/fashion tech niche market.
- Business drivers are AI/AR virtual try-on and personalized beauty/fashion SaaS apps.
- High exposure to technological disruption via AI and AR innovations in beauty tech.
Dayforce Inc vs Perfect Corp. Positioning
Dayforce Inc adopts a diversified approach with multiple HCM cloud services and payroll products, leveraging scale. Perfect Corp. concentrates on AI/AR beauty tech solutions, focusing on innovation but with a smaller scale and narrower market scope.
Which has the best competitive advantage?
Both companies show slightly unfavorable MOAT evaluations, shedding value but with growing profitability. Neither currently demonstrates a strong competitive advantage based on ROIC versus WACC metrics provided.
Stock Comparison
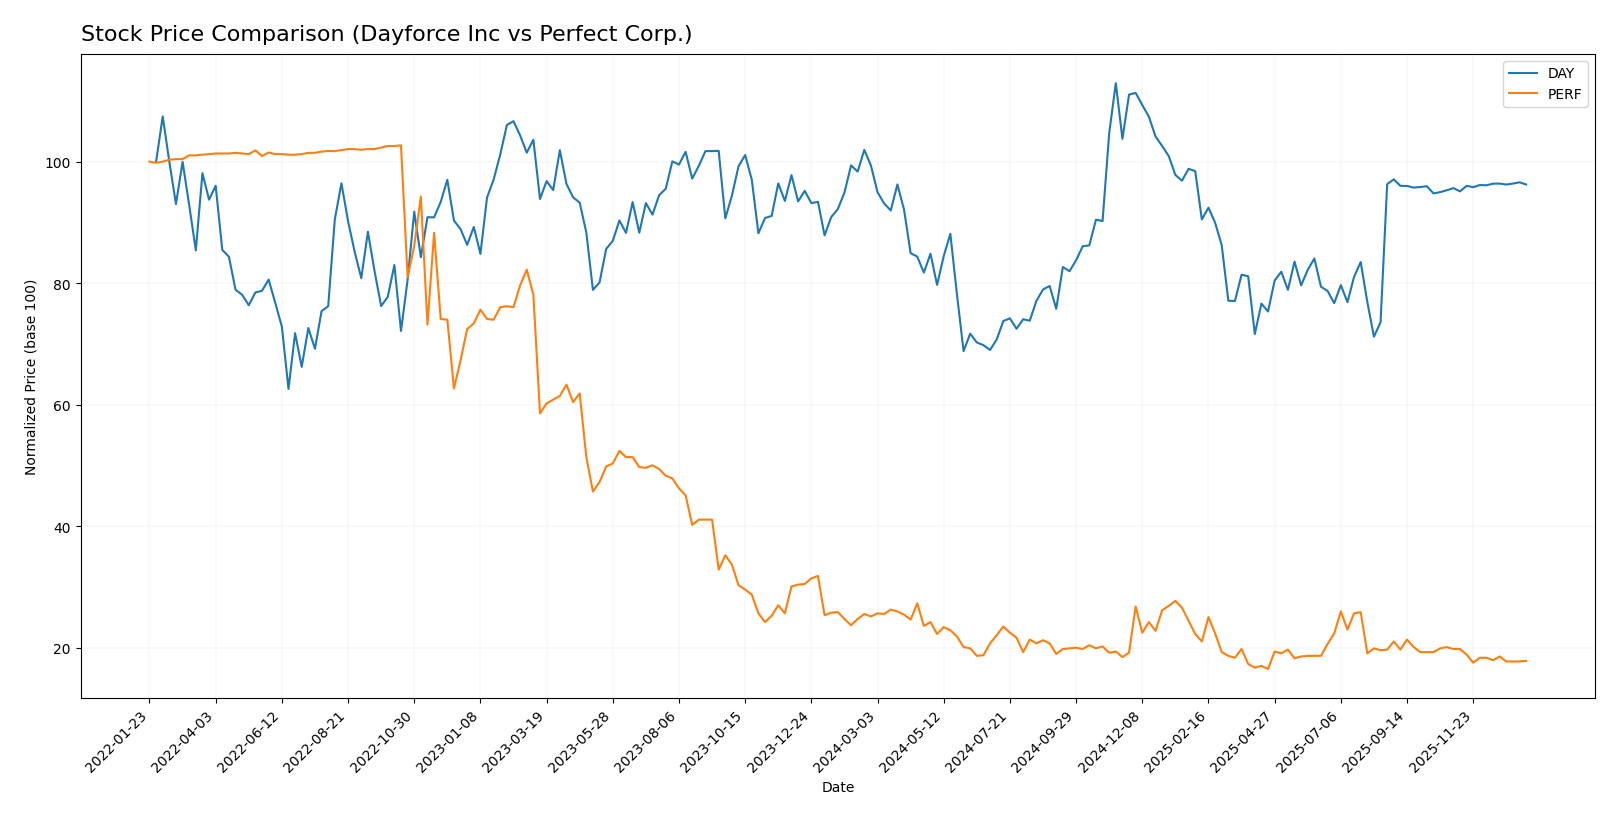
The stock price movements of Dayforce Inc and Perfect Corp. over the past year reveal contrasting bearish trends, with Dayforce showing moderate losses and Perfect Corp. experiencing a sharper decline amid shifting trading volumes.
Trend Analysis
Dayforce Inc’s stock price declined by 3.16% over the past 12 months, indicating a bearish trend with deceleration. The stock fluctuated between a high of 81.14 and a low of 49.46, with notable volatility shown by a standard deviation of 7.84.
Perfect Corp.’s stock price suffered a more pronounced 28.98% drop over the same period, confirming a bearish trend with deceleration. Price ranged from 2.7 to 1.61, and volatility remained low with a standard deviation of 0.27.
Comparing both stocks, Dayforce has delivered the highest market performance over the past year despite its slight decline, outperforming Perfect Corp., which experienced a significantly larger loss.
Target Prices
The target price consensus for the analyzed companies shows a clear valuation outlook from verified analysts.
| Company | Target High | Target Low | Consensus |
|---|---|---|---|
| Dayforce Inc | 70 | 70 | 70 |
| Perfect Corp. | 7 | 7 | 7 |
Analysts expect Dayforce Inc’s stock to hold steady around $70, closely aligned with its current price of $69.16. Perfect Corp. shows a consensus target of $7, significantly above its current $1.74, indicating potential upside.
Analyst Opinions Comparison
This section compares analysts’ ratings and financial scores for Dayforce Inc and Perfect Corp.:
Rating Comparison
Dayforce Inc Rating
- Rating: C-, considered very favorable overall.
- Discounted Cash Flow Score: 2, moderate valuation signal.
- ROE Score: 1, very unfavorable profitability indicator.
- ROA Score: 1, very unfavorable asset efficiency.
- Debt To Equity Score: 2, moderate financial risk.
- Overall Score: 1, very unfavorable overall financial health.
Perfect Corp. Rating
- Rating: A-, considered very favorable overall.
- Discounted Cash Flow Score: 5, very favorable valuation.
- ROE Score: 2, moderate profitability indicator.
- ROA Score: 3, moderate asset efficiency.
- Debt To Equity Score: 4, favorable financial risk.
- Overall Score: 4, favorable overall financial health.
Which one is the best rated?
Based on the provided data, Perfect Corp. holds a stronger position with an A- rating and higher scores across discounted cash flow, ROE, ROA, debt-to-equity, and overall metrics compared to Dayforce Inc’s lower C- rating and generally weaker scores.
Scores Comparison
Here is a comparison of the Altman Z-Score and Piotroski Score for Dayforce Inc and Perfect Corp.:
Dayforce Inc Scores
- Altman Z-Score: 1.24, indicating financial distress zone.
- Piotroski Score: 5, reflecting average financial strength.
Perfect Corp. Scores
- Altman Z-Score: 1.31, indicating financial distress zone.
- Piotroski Score: 6, reflecting average financial strength.
Which company has the best scores?
Perfect Corp. shows slightly higher scores in both Altman Z-Score and Piotroski Score compared to Dayforce Inc, indicating marginally better financial stability and strength based on the provided data.
Grades Comparison
The following tables present the latest reliable grades for Dayforce Inc and Perfect Corp.:
Dayforce Inc Grades
This table summarizes recent analyst grades and recommendations for Dayforce Inc:
| Grading Company | Action | New Grade | Date |
|---|---|---|---|
| Needham | Maintain | Hold | 2025-10-30 |
| Stifel | Downgrade | Hold | 2025-09-19 |
| Citigroup | Downgrade | Neutral | 2025-09-17 |
| Wells Fargo | Upgrade | Equal Weight | 2025-08-22 |
| BMO Capital | Downgrade | Market Perform | 2025-08-22 |
| Keybanc | Downgrade | Sector Weight | 2025-08-22 |
| Needham | Downgrade | Hold | 2025-08-22 |
| Barclays | Maintain | Equal Weight | 2025-08-22 |
| Deutsche Bank | Maintain | Hold | 2025-08-22 |
| Jefferies | Maintain | Hold | 2025-08-21 |
Dayforce Inc’s grades mainly reflect a cautious outlook, with multiple downgrades from Buy to Hold and a consensus rating of Hold.
Perfect Corp. Grades
This table summarizes recent analyst grades and recommendations for Perfect Corp.:
| Grading Company | Action | New Grade | Date |
|---|---|---|---|
| Piper Sandler | Maintain | Neutral | 2024-02-29 |
| Goldman Sachs | Maintain | Neutral | 2023-10-26 |
| Piper Sandler | Maintain | Neutral | 2023-10-25 |
| Piper Sandler | Maintain | Neutral | 2023-07-26 |
| Piper Sandler | Maintain | Neutral | 2023-07-25 |
| Piper Sandler | Maintain | Neutral | 2023-04-27 |
| Oppenheimer | Downgrade | Perform | 2023-04-20 |
| Oppenheimer | Downgrade | Perform | 2023-04-19 |
| Oppenheimer | Downgrade | Perform | 2023-04-18 |
| Piper Sandler | Maintain | Neutral | 2023-03-08 |
Perfect Corp.’s grades are stable, predominantly Neutral with a consensus of Hold, showing little variation in analyst sentiment.
Which company has the best grades?
Both Dayforce Inc and Perfect Corp. have a consensus rating of Hold, but Dayforce shows more recent downgrades from Buy to Hold, while Perfect Corp.’s ratings have remained consistently Neutral. This suggests similar moderate outlooks, which may influence investors to expect cautious performance from both stocks.
Strengths and Weaknesses
Below is a comparative table highlighting key strengths and weaknesses of Dayforce Inc and Perfect Corp based on the most recent financial and operational data.
| Criterion | Dayforce Inc (DAY) | Perfect Corp. (PERF) |
|---|---|---|
| Diversification | Strong recurring revenue with $1.52B from cloud services and professional services | Limited diversification data available |
| Profitability | Low net margin (1.03%), ROIC at 1.31%, overall unfavorable profitability | Moderate net margin (8.34%) but negative ROIC (-2.1%) indicates value destruction |
| Innovation | Growing ROIC trend suggests improving efficiency despite current value loss | Also showing growing ROIC but still shedding value; innovation impact unclear |
| Global presence | Established cloud-based HR and payroll services globally | Global footprint not explicitly detailed |
| Market Share | Large recurring revenue base suggests solid market position | Market share data not available |
Key takeaways: Both companies are currently shedding value as ROIC remains below WACC, but their improving ROIC trends indicate potential future profitability. Dayforce shows stronger diversification and solid recurring revenue, while Perfect Corp’s profitability and market presence are less clear, warranting cautious investment consideration.
Risk Analysis
Below is a comparative table summarizing key risk factors for Dayforce Inc and Perfect Corp in 2026:
| Metric | Dayforce Inc (DAY) | Perfect Corp. (PERF) |
|---|---|---|
| Market Risk | Beta 1.18, moderate volatility | Beta 0.45, lower volatility |
| Debt level | Debt/Equity 0.48, moderate debt | Debt/Equity 0.0, no debt |
| Regulatory Risk | US software sector regulations | Taiwan tech sector regulations |
| Operational Risk | Large workforce (9.6K employees) | Smaller scale (342 employees) |
| Environmental Risk | Moderate, typical for software | Moderate, tech industry norms |
| Geopolitical Risk | US market exposure | Exposure to Taiwan-China tensions |
Dayforce shows moderate market and debt risk with an unfavorable profitability profile and financial distress signs, including an Altman Z-score in the distress zone. Perfect Corp has low debt and lower market volatility but also faces financial distress risks. The most impactful risks are Dayforce’s financial instability and Perfect’s geopolitical exposure due to its Taiwan base. Both companies require careful risk management for investment consideration.
Which Stock to Choose?
Dayforce Inc has shown favorable income growth with a 16.27% revenue increase in 2024 and strong overall net income growth of 552.5% since 2020. Its financial ratios are mostly unfavorable, including low ROE (0.71%) and high P/E (633.29), though it maintains a favorable debt profile and quick ratio. The company is slightly unfavorable on moat evaluation, shedding value but with growing profitability, and holds a very favorable C- rating overall.
Perfect Corp. reports favorable income metrics with an 8.34% net margin and positive revenue growth of 12.52% in 2024, alongside solid overall net income growth of 189.77%. Its financial ratios are slightly unfavorable, with moderate ROE (3.42%) and a lower P/E (56.6) compared to Dayforce. It has a strong balance sheet with zero debt and a slightly unfavorable moat status due to value destruction despite improving profitability, combined with a very favorable A- rating.
Investors focused on growth might find Dayforce’s significant income expansion appealing despite weaker financial ratios, while those preferring financial stability and better rating scores could view Perfect Corp.’s profile as more favorable. The choice may appear to depend on tolerance for financial ratio weaknesses versus rating and income growth patterns.
Disclaimer: Investment carries a risk of loss of initial capital. The past performance is not a reliable indicator of future results. Be sure to understand risks before making an investment decision.
Go Further
I encourage you to read the complete analyses of Dayforce Inc and Perfect Corp. to enhance your investment decisions: