In the dynamic world of human capital management software, Dayforce Inc (DAY) and Paycom Software, Inc. (PAYC) stand out as prominent competitors. Both companies deliver cloud-based HCM solutions targeting businesses seeking efficient workforce and payroll management. Their overlapping markets and innovative approaches make them ideal candidates for comparison. In this article, I will analyze their strengths and risks to help you decide which company deserves a place in your investment portfolio.
Table of contents
Companies Overview
I will begin the comparison between Dayforce Inc and Paycom Software, Inc. by providing an overview of these two companies and their main differences.
Dayforce Inc Overview
Dayforce Inc operates as a human capital management (HCM) software company, offering a cloud-based platform that integrates human resources, payroll, benefits, workforce, and talent management. Serving markets in the US, Canada, and internationally, Dayforce also targets small businesses with its Powerpay solution. The company, headquartered in Minneapolis, MN, is positioned as a comprehensive provider of payroll and workforce management services.
Paycom Software, Inc. Overview
Paycom Software, Inc. delivers a cloud-based HCM solution as software-as-a-service, focusing on small to mid-sized US companies. Its platform encompasses recruitment, payroll, time and labor management, talent management, and compliance functionalities. Based in Oklahoma City, OK, Paycom emphasizes data analytics and user-friendly applications designed to streamline the entire employment lifecycle from hiring to retirement.
Key similarities and differences
Both Dayforce and Paycom operate in the software application sector specializing in human capital management solutions, targeting mainly US markets with cloud-based platforms. Dayforce offers a broader international presence and solutions tailored to small businesses, while Paycom emphasizes an extensive suite of applications and analytics for small to mid-sized companies. Their business models converge on SaaS delivery but differ in geographic reach and solution depth.
Income Statement Comparison
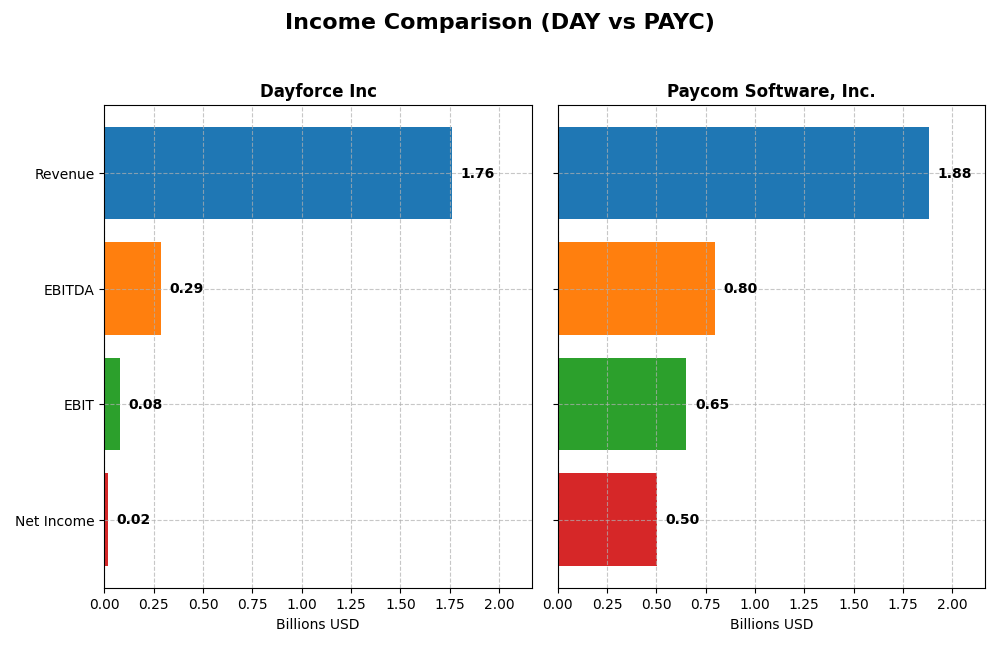
The table below presents a side-by-side comparison of key income statement metrics for Dayforce Inc and Paycom Software, Inc. for their most recent fiscal year, 2024.
| Metric | Dayforce Inc | Paycom Software, Inc. |
|---|---|---|
| Market Cap | 11.1B | 8.3B |
| Revenue | 1.76B | 1.88B |
| EBITDA | 288M | 798M |
| EBIT | 78.2M | 652M |
| Net Income | 18.1M | 502M |
| EPS | 0.11 | 8.93 |
| Fiscal Year | 2024 | 2024 |
Income Statement Interpretations
Dayforce Inc
Dayforce Inc’s revenue and net income grew significantly from 2020 to 2024, with revenue doubling and net income increasing over 550%. Gross margins remained favorable around 46%, while EBIT and net margins were stable but low. In 2024, revenue rose 16%, yet net income and EPS declined sharply, reflecting margin compression and higher operating expenses.
Paycom Software, Inc.
Paycom Software showed consistent revenue and net income growth over the 2020-2024 period, with revenue up by 124% and net income nearly tripling. Margins were robust, with gross margin above 82% and net margin exceeding 26%, all rated favorable. The latest year saw double-digit growth in revenues and profits, with improved EBIT and net margins reinforcing solid operational efficiency.
Which one has the stronger fundamentals?
Paycom demonstrates stronger fundamentals with consistently high and improving margins, favorable growth rates across all key metrics, and no unfavorable signals. Dayforce, while showing impressive long-term growth, faced recent margin pressure and declining profitability. The overall stability and margin strength of Paycom give it a more favorable income statement profile.
Financial Ratios Comparison
The table below presents a side-by-side comparison of key financial ratios for Dayforce Inc and Paycom Software, Inc. based on their most recent fiscal year data for 2024.
| Ratios | Dayforce Inc (DAY) | Paycom Software, Inc. (PAYC) |
|---|---|---|
| ROE | 0.71% | 31.85% |
| ROIC | 1.31% | 24.86% |
| P/E | 633.3 | 22.95 |
| P/B | 4.50 | 7.31 |
| Current Ratio | 1.13 | 1.10 |
| Quick Ratio | 1.13 | 1.10 |
| D/E | 0.48 | 0.05 |
| Debt-to-Assets | 13.5% | 1.4% |
| Interest Coverage | 2.56 | 186.56 |
| Asset Turnover | 0.19 | 0.32 |
| Fixed Asset Turnover | 7.46 | 2.93 |
| Payout Ratio | 0% | 16.9% |
| Dividend Yield | 0% | 0.74% |
Interpretation of the Ratios
Dayforce Inc
Dayforce Inc displays mostly weak financial ratios with unfavorable net margin (1.03%), ROE (0.71%), and ROIC (1.31%), reflecting low profitability and returns. Its P/E ratio is extremely high at 633.29, indicating possible overvaluation. The company does not pay dividends, likely reinvesting earnings to support growth, and shows a cautious balance sheet with favorable debt ratios but weak interest coverage.
Paycom Software, Inc.
Paycom Software reports strong profitability with a 26.66% net margin, 31.85% ROE, and 24.86% ROIC, signaling efficient capital use. Its P/E ratio is reasonable at 22.95, though the P/B ratio is elevated at 7.31. The company pays dividends with a 0.74% yield but the dividend yield is considered unfavorable relative to other metrics. Paycom has solid liquidity and minimal debt, supported by a very high interest coverage ratio.
Which one has the best ratios?
Paycom Software presents a more favorable overall ratio profile with higher profitability, better returns, and stronger coverage ratios than Dayforce. Despite some neutral or unfavorable metrics, Paycom’s financial health and dividend payments are more appealing compared to Dayforce’s predominantly unfavorable profitability and valuation ratios.
Strategic Positioning
This section compares the strategic positioning of Dayforce Inc and Paycom Software, Inc., including their market position, key segments, and exposure to disruption:
Dayforce Inc
- Market position and competitive pressure: Operates globally with 11B market cap, faces strong competition in cloud HCM software.
- Key segments and business drivers: Cloud Dayforce platform leads recurring revenue; small business Powerpay and professional services also contribute.
- Exposure to technological disruption: Cloud HCM solutions face ongoing innovation demands; uses direct and third-party sales channels.
Paycom Software, Inc.
- Focused on US small to mid-sized businesses with 8.3B market cap, operates in a competitive SaaS HCM market.
- Recurring cloud-based HCM services dominate revenue; diverse payroll, talent acquisition, and compliance tools drive growth.
- SaaS model integrates advanced analytics, proprietary Bluetooth tech, and mobile management, enhancing digital disruption readiness.
Dayforce Inc vs Paycom Software, Inc. Positioning
Dayforce shows a diversified approach with multiple revenue streams from cloud platforms and services, while Paycom concentrates on comprehensive SaaS offerings primarily for US SMEs. Dayforce’s global reach contrasts with Paycom’s specialized US market focus, each with distinct operational advantages and challenges.
Which has the best competitive advantage?
Paycom demonstrates a very favorable moat with ROIC significantly above WACC and growing profitability, indicating a durable competitive advantage. Dayforce, despite growing ROIC, currently sheds value with a slightly unfavorable moat position.
Stock Comparison
The stock price dynamics over the past 12 months reveal contrasting bearish trends for Dayforce Inc and Paycom Software, Inc., with differing volatility and volume behavior influencing their trading profiles.

Trend Analysis
Dayforce Inc’s stock experienced a -3.16% decline over the past year, indicating a bearish trend with decelerating momentum. The price ranged between 49.46 and 81.14, with moderate volatility (std deviation 7.84). Recent weeks show a slight positive shift (+0.61%).
Paycom Software, Inc. faced a sharper bearish trend, down by -19.64% over the last 12 months, with higher volatility (std deviation 31.92) and decelerating decline. Recent price action worsened, dropping -20.67% with increased downward slope and volatility.
Comparing the two, Dayforce Inc outperformed Paycom Software, Inc. over the past year, delivering a smaller loss and less volatile trading conditions, reflecting relatively better market stability.
Target Prices
Analysts show a clear consensus on target price expectations for both Dayforce Inc and Paycom Software, Inc.
| Company | Target High | Target Low | Consensus |
|---|---|---|---|
| Dayforce Inc | 70 | 70 | 70 |
| Paycom Software, Inc. | 290 | 165 | 215 |
The target consensus for Dayforce Inc is $70, closely aligned with its current price of $69.16, indicating limited upside. Paycom Software shows a wider range with a consensus target of $215, significantly above its current price of $148.41, suggesting potential growth.
Analyst Opinions Comparison
This section compares analysts’ ratings and grades for Dayforce Inc and Paycom Software, Inc.:
Rating Comparison
Dayforce Inc Rating
- Rating: C- indicating a very favorable overall rating.
- Discounted Cash Flow Score: 2, assessed as moderate.
- ROE Score: 1, considered very unfavorable.
- ROA Score: 1, considered very unfavorable.
- Debt To Equity Score: 2, assessed as moderate.
- Overall Score: 1, considered very unfavorable.
Paycom Software, Inc. Rating
- Rating: A indicating a very favorable overall rating.
- Discounted Cash Flow Score: 5, assessed as very favorable.
- ROE Score: 5, considered very favorable.
- ROA Score: 5, considered very favorable.
- Debt To Equity Score: 4, assessed as favorable.
- Overall Score: 4, considered favorable.
Which one is the best rated?
Based strictly on the provided data, Paycom Software, Inc. holds significantly stronger scores across all financial metrics and an overall favorable rating, while Dayforce Inc has mostly very unfavorable scores and a lower overall rating.
Scores Comparison
Here is a comparison of the Altman Z-Score and Piotroski Score for Dayforce Inc and Paycom Software, Inc.:
Dayforce Inc Scores
- Altman Z-Score: 1.24, in distress zone, high bankruptcy risk
- Piotroski Score: 5, average financial strength
Paycom Software, Inc. Scores
- Altman Z-Score: 3.84, in safe zone, low bankruptcy risk
- Piotroski Score: 5, average financial strength
Which company has the best scores?
Paycom Software, Inc. has a significantly better Altman Z-Score, indicating stronger financial stability and lower bankruptcy risk, while both have the same average Piotroski Score.
Grades Comparison
Here is the detailed grades comparison for Dayforce Inc and Paycom Software, Inc.:
Dayforce Inc Grades
This table summarizes recent grades assigned by reputable financial institutions for Dayforce Inc.
| Grading Company | Action | New Grade | Date |
|---|---|---|---|
| Needham | Maintain | Hold | 2025-10-30 |
| Stifel | Downgrade | Hold | 2025-09-19 |
| Citigroup | Downgrade | Neutral | 2025-09-17 |
| Wells Fargo | Upgrade | Equal Weight | 2025-08-22 |
| BMO Capital | Downgrade | Market Perform | 2025-08-22 |
| Keybanc | Downgrade | Sector Weight | 2025-08-22 |
| Needham | Downgrade | Hold | 2025-08-22 |
| Barclays | Maintain | Equal Weight | 2025-08-22 |
| Deutsche Bank | Maintain | Hold | 2025-08-22 |
| Jefferies | Maintain | Hold | 2025-08-21 |
Overall, Dayforce’s grades trend downward from Buy to Hold or Neutral, indicating a cautious outlook with multiple downgrades and a consensus rating of Hold.
Paycom Software, Inc. Grades
This table presents recent grades assigned by respected financial firms for Paycom Software, Inc.
| Grading Company | Action | New Grade | Date |
|---|---|---|---|
| Barclays | Maintain | Equal Weight | 2026-01-12 |
| TD Cowen | Maintain | Buy | 2026-01-08 |
| Citigroup | Maintain | Neutral | 2025-12-23 |
| Keybanc | Maintain | Overweight | 2025-11-06 |
| TD Cowen | Maintain | Buy | 2025-11-06 |
| UBS | Maintain | Buy | 2025-11-06 |
| Jefferies | Maintain | Hold | 2025-11-06 |
| JP Morgan | Maintain | Neutral | 2025-11-06 |
| Mizuho | Maintain | Neutral | 2025-11-06 |
| Barclays | Maintain | Equal Weight | 2025-11-06 |
Paycom’s ratings remain stable with a majority Buy and Neutral grades, reflecting steady confidence and a consensus rating of Hold.
Which company has the best grades?
Both companies hold a consensus rating of Hold, but Paycom Software, Inc. has more Buy ratings and fewer downgrades compared to Dayforce Inc’s trend of downgrades to Hold or Neutral. This suggests Paycom is viewed with relatively greater confidence, potentially influencing investor sentiment toward more stability.
Strengths and Weaknesses
Below is a comparison of key strengths and weaknesses for Dayforce Inc and Paycom Software, Inc. based on the latest financial and operational data.
| Criterion | Dayforce Inc (DAY) | Paycom Software, Inc. (PAYC) |
|---|---|---|
| Diversification | Moderate, with focus on cloud services and professional services | Moderate, primarily recurring revenue with some implementation services |
| Profitability | Low net margin (1.03%), ROIC below WACC, value destroying | High net margin (26.66%), ROIC well above WACC, strong value creation |
| Innovation | Growing ROIC trend indicates improving operational efficiency | Durable competitive advantage with growing ROIC and innovation leadership |
| Global presence | Limited data, likely regional focus | Stronger global footprint with consistent growth in recurring revenues |
| Market Share | Smaller market share with slower revenue growth | Larger market share, robust revenue growth driven by recurring services |
Key takeaways: Paycom demonstrates a clear competitive advantage with superior profitability, efficient capital use, and strong recurring revenues. Dayforce shows improving profitability but currently struggles with value creation and market penetration, warranting cautious investment consideration.
Risk Analysis
Below is a risk comparison table for Dayforce Inc and Paycom Software, Inc. based on the most recent financial year 2024.
| Metric | Dayforce Inc (DAY) | Paycom Software, Inc. (PAYC) |
|---|---|---|
| Market Risk | Beta 1.18 indicates moderate market volatility | Beta 0.82 indicates lower market volatility |
| Debt level | Debt-to-Equity 0.48 (favorable), Debt-to-Assets 13.5% | Debt-to-Equity 0.05 (very favorable), Debt-to-Assets 1.4% |
| Regulatory Risk | Moderate; operates in heavily regulated HR software | Moderate; US-focused SaaS with compliance obligations |
| Operational Risk | Lower asset turnover (0.19) and weak profitability | Better profitability metrics, but moderate asset turnover (0.32) |
| Environmental Risk | Low; tech sector with limited direct environmental impact | Low; similar tech sector profile |
| Geopolitical Risk | Moderate; operates internationally | Primarily US market, lower geopolitical exposure |
Dayforce Inc faces higher market and operational risks with weak profitability and financial distress signals (Altman Z-Score 1.24, distress zone). Paycom shows stronger financial health and stability (Altman Z-Score 3.84, safe zone), making it less risky. The most impactful risks for Dayforce are financial health and market volatility, while Paycom’s main concern is valuation given its high price-to-book ratio.
Which Stock to Choose?
Dayforce Inc has shown favorable revenue and net income growth over 2020–2024 but faces unfavorable profitability and financial ratios, including low ROE (0.71%) and a high EV/EBITDA ratio. Its debt metrics are favorable with manageable leverage, yet the overall rating remains very unfavorable.
Paycom Software, Inc. exhibits consistent favorable income evolution with strong profitability, including a 26.66% net margin and 31.85% ROE. Financial ratios are mostly favorable, with low debt levels and a very favorable overall rating, despite a somewhat high price-to-book ratio.
Considering ratings and financial health, Paycom may appeal to investors valuing robust profitability and financial stability, while Dayforce might be more aligned with those willing to accept greater risk amid improving income trends but weaker ratios. The choice could depend on the investor’s risk tolerance and investment strategy.
Disclaimer: Investment carries a risk of loss of initial capital. The past performance is not a reliable indicator of future results. Be sure to understand risks before making an investment decision.
Go Further
I encourage you to read the complete analyses of Dayforce Inc and Paycom Software, Inc. to enhance your investment decisions: