In the fast-evolving software application sector, Dayforce Inc (DAY) and monday.com Ltd. (MNDY) stand out as innovative players shaping how businesses manage work and human capital. Dayforce focuses on comprehensive human capital management solutions, while monday.com delivers versatile work operating systems for diverse industries. This comparison highlights their market strategies and growth potential to help you identify which company might best fit your investment portfolio in 2026.
Table of contents
Companies Overview
I will begin the comparison between Dayforce Inc and monday.com Ltd. by providing an overview of these two companies and their main differences.
Dayforce Inc Overview
Dayforce Inc operates as a human capital management (HCM) software company primarily in the US, Canada, and internationally. Its cloud platform offers human resources, payroll, benefits, workforce management, and talent management solutions, including a specialized product for small businesses. With a market cap of 11.1B USD and 9,600 employees, Dayforce emphasizes integrated workforce solutions through direct and third-party sales.
monday.com Ltd. Overview
monday.com Ltd. develops cloud-based software applications for work management globally, including the US, Europe, and the Middle East. Its flagship product, Work OS, enables customizable software creation for project management, CRM, and marketing. The company, headquartered in Tel Aviv with 2,508 employees, has a market cap of 6.5B USD and focuses on modular, visual work operating systems serving diverse organizational needs.
Key similarities and differences
Both companies operate in the software application industry, focusing on cloud-based solutions that optimize organizational workflows. Dayforce specializes in human capital management with a broader employee base and larger market cap, while monday.com targets customizable work operating systems with fewer employees and a smaller market cap. Their geographic reach overlaps internationally but with different core product offerings and market focuses.
Income Statement Comparison
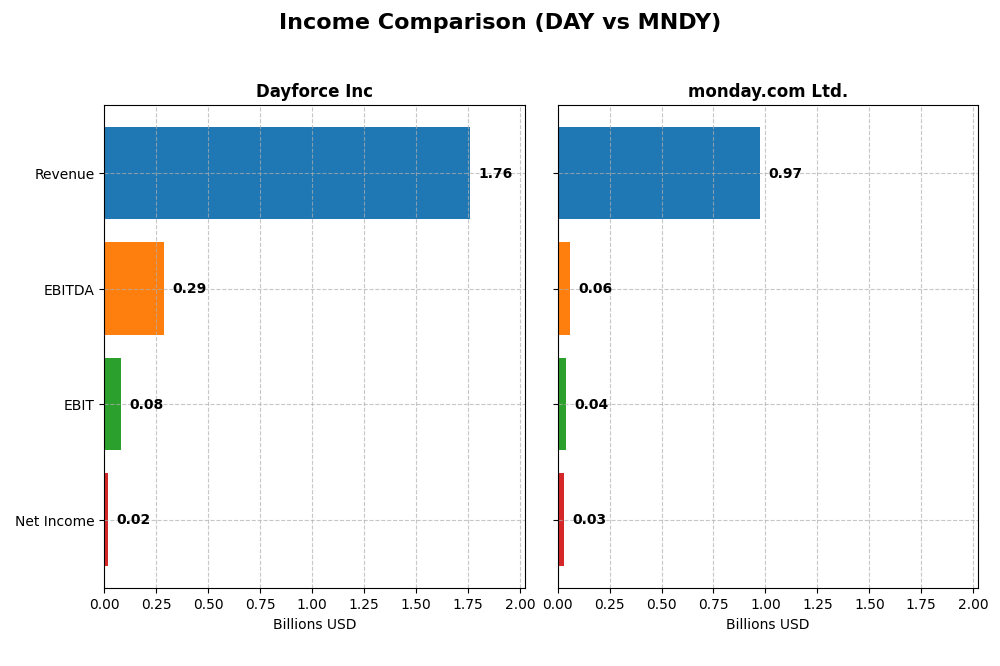
This table provides a side-by-side comparison of the key income statement metrics for Dayforce Inc and monday.com Ltd. for the fiscal year 2024.
| Metric | Dayforce Inc | monday.com Ltd. |
|---|---|---|
| Market Cap | 11.1B | 6.5B |
| Revenue | 1.76B | 972M |
| EBITDA | 288M | 58M |
| EBIT | 78.2M | 39.8M |
| Net Income | 18.1M | 32.4M |
| EPS | 0.11 | 0.65 |
| Fiscal Year | 2024 | 2024 |
Income Statement Interpretations
Dayforce Inc
Dayforce Inc experienced steady revenue growth from $842M in 2020 to $1.76B in 2024, doubling over five years. Gross margin remained favorable at 46.14%, but net margin was only 1.03% in 2024, reflecting pressure on profitability. The latest year saw revenue growth slow to 16.3%, while net income sharply declined by 71.6%, indicating margin compression and rising expenses.
monday.com Ltd.
monday.com Ltd. showed rapid revenue expansion, surging from $161M in 2020 to $972M in 2024, a 503% increase. Its gross margin was exceptionally strong at 89.3%, supporting operational leverage. The 2024 fiscal year posted a 33.2% revenue rise and a significant turnaround in net income to $32M from a loss the prior year, with net margin improving substantially to 3.33%.
Which one has the stronger fundamentals?
monday.com demonstrates stronger fundamentals with higher gross margins and faster revenue and net income growth, showing operational scalability and improved profitability. Dayforce, while growing steadily, shows weaker net margins and declining earnings growth in the latest year, indicating potential challenges controlling costs. Both companies have favorable income statement evaluations, but monday.com’s metrics suggest more robust financial health.
Financial Ratios Comparison
Below is a comparison of key financial ratios for Dayforce Inc and monday.com Ltd. based on their latest fiscal year data (2024).
| Ratios | Dayforce Inc (DAY) | monday.com Ltd. (MNDY) |
|---|---|---|
| ROE | 0.71% | 3.14% |
| ROIC | 1.31% | -1.73% |
| P/E | 633.3 | 363.0 |
| P/B | 4.50 | 11.41 |
| Current Ratio | 1.13 | 2.66 |
| Quick Ratio | 1.13 | 2.66 |
| D/E | 0.48 | 0.10 |
| Debt-to-Assets | 13.5% | 6.3% |
| Interest Coverage | 2.56 | 0 (no data) |
| Asset Turnover | 0.19 | 0.58 |
| Fixed Asset Turnover | 7.46 | 7.13 |
| Payout ratio | 0 | 0 |
| Dividend yield | 0 | 0 |
Interpretation of the Ratios
Dayforce Inc
Dayforce Inc’s financial ratios show several weaknesses, including low net margin (1.03%), ROE (0.71%), and ROIC (1.31%), all marked unfavorable. The company has a high PE ratio of 633.29 and a PB ratio of 4.5, also unfavorable. However, it benefits from a favorable quick ratio (1.13) and manageable debt levels. Dayforce does not pay dividends, likely reflecting reinvestment priorities or growth strategy.
monday.com Ltd.
monday.com Ltd. displays mixed financial ratios with unfavorable net margin (3.33%) and ROE (3.14%), alongside negative ROIC (-1.73%). Its PE ratio at 362.98 and PB at 11.41 are also unfavorable, but liquidity ratios (current and quick ratio at 2.66) and low debt levels are favorable. The company does not pay dividends, probably due to reinvestment and growth focus, supported by positive free cash flow.
Which one has the best ratios?
monday.com Ltd. shows a more balanced profile with 42.86% favorable ratios and stronger liquidity, while Dayforce Inc. has a higher proportion of unfavorable ratios (57.14%) and weaker profitability metrics. Despite some strengths, Dayforce’s overall ratio evaluation remains unfavorable compared to monday.com’s neutral stance.
Strategic Positioning
This section compares the strategic positioning of Dayforce Inc and monday.com Ltd., including market position, key segments, and exposure to technological disruption:
Dayforce Inc
- Large market cap of 11B, faces competitive pressure in HCM software sector.
- Focuses on human capital management software and payroll solutions.
- Operates cloud platforms, moderate risk from tech disruption in software space.
monday.com Ltd.
- Smaller market cap of 6.5B, competes in cloud-based work OS software.
- Provides modular work OS applications for diverse business functions.
- Cloud-based visual work OS platform exposed to evolving tech trends.
Dayforce Inc vs monday.com Ltd. Positioning
Dayforce Inc shows a concentrated focus on HCM and payroll with a larger scale, while monday.com Ltd. offers a diversified modular work OS platform. Dayforce’s scale supports strong market presence; monday.com’s product diversity targets broader workflows.
Which has the best competitive advantage?
Both companies exhibit slightly unfavorable MOAT statuses as they are shedding value despite growing ROIC trends. Neither currently demonstrates a strong sustainable competitive advantage based on ROIC versus WACC data.
Stock Comparison
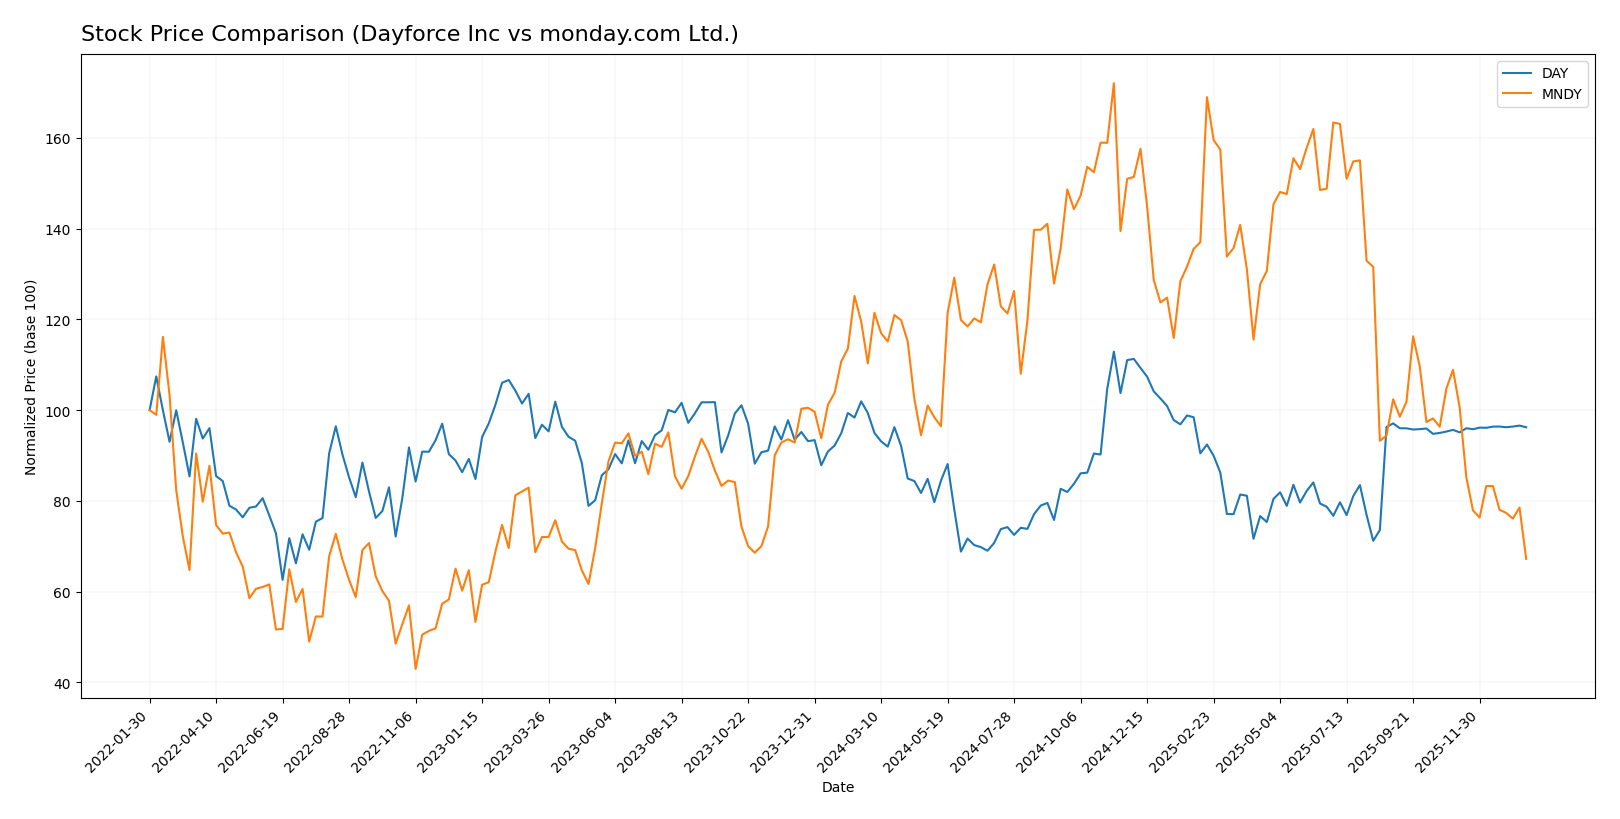
Stock price movements for Dayforce Inc (DAY) and monday.com Ltd. (MNDY) over the past 12 months reveal contrasting bearish trends, with significant differences in price decline magnitudes and trading volume dynamics.
Trend Analysis
Dayforce Inc’s stock experienced a -3.16% decline over the past year, indicating a bearish trend with decelerating losses. The stock showed moderate volatility with a standard deviation of 7.84 and a recent slight positive trend of +0.61%.
monday.com Ltd.’s stock fell sharply by -39.06% over the same period, also bearish with deceleration. It displayed high volatility, reflected by a 47.32 standard deviation and persistent downward pressure in recent months with a -38.27% drop.
Comparing both, Dayforce’s stock exhibited a more moderate decline and better recent performance than monday.com, which suffered a substantially deeper loss and stronger seller dominance.
Target Prices
The current analyst consensus provides a clear outlook on target prices for Dayforce Inc and monday.com Ltd.
| Company | Target High | Target Low | Consensus |
|---|---|---|---|
| Dayforce Inc | 70 | 70 | 70 |
| monday.com Ltd. | 330 | 194 | 264.42 |
Analysts expect Dayforce’s stock to trade around its current price of $69.16, indicating limited upside. Monday.com shows significantly higher upside potential versus its current price of $126.7, reflecting bullish sentiment.
Analyst Opinions Comparison
This section compares analysts’ ratings and grades for Dayforce Inc and monday.com Ltd.:
Rating Comparison
Dayforce Inc Rating
- Rating: C- indicating a very favorable rating status.
- Discounted Cash Flow Score: 2, moderate valuation outlook.
- ROE Score: 1, very unfavorable efficiency in equity use.
- ROA Score: 1, very unfavorable asset utilization.
- Debt To Equity Score: 2, moderate financial risk.
- Overall Score: 1, very unfavorable overall financial health.
monday.com Ltd. Rating
- Rating: B- with a very favorable rating status.
- Discounted Cash Flow Score: 4, favorable valuation outlook.
- ROE Score: 3, moderate efficiency in generating profits.
- ROA Score: 3, moderate effectiveness in asset use.
- Debt To Equity Score: 3, moderate financial risk.
- Overall Score: 3, moderate overall financial health.
Which one is the best rated?
Based strictly on the provided data, monday.com Ltd. is better rated overall with higher scores in discounted cash flow, ROE, ROA, debt-to-equity, and overall financial health compared to Dayforce Inc.
Scores Comparison
Here is a comparison of the Altman Z-Score and Piotroski Score for Dayforce Inc and monday.com Ltd.:
Dayforce Inc Scores
- Altman Z-Score: 1.24, in distress zone, high bankruptcy risk
- Piotroski Score: 5, average financial strength
monday.com Ltd Scores
- Altman Z-Score: 6.33, in safe zone, very low bankruptcy risk
- Piotroski Score: 5, average financial strength
Which company has the best scores?
monday.com Ltd shows a significantly higher Altman Z-Score indicating strong financial stability and low bankruptcy risk. Both companies have the same average Piotroski Score, implying similar financial strength on that metric.
Grades Comparison
The following presents a comparison of recent grades assigned to Dayforce Inc and monday.com Ltd. by reputable grading firms:
Dayforce Inc Grades
This table summarizes the recent grades issued by recognized financial institutions for Dayforce Inc:
| Grading Company | Action | New Grade | Date |
|---|---|---|---|
| Needham | Maintain | Hold | 2025-10-30 |
| Stifel | Downgrade | Hold | 2025-09-19 |
| Citigroup | Downgrade | Neutral | 2025-09-17 |
| Wells Fargo | Upgrade | Equal Weight | 2025-08-22 |
| BMO Capital | Downgrade | Market Perform | 2025-08-22 |
| Keybanc | Downgrade | Sector Weight | 2025-08-22 |
| Needham | Downgrade | Hold | 2025-08-22 |
| Barclays | Maintain | Equal Weight | 2025-08-22 |
| Deutsche Bank | Maintain | Hold | 2025-08-22 |
| Jefferies | Maintain | Hold | 2025-08-21 |
Overall, Dayforce Inc’s grades mostly reflect a cautious stance, with multiple downgrades and a consensus rating of Hold.
monday.com Ltd. Grades
This table details the recent grades assigned to monday.com Ltd. by respected grading companies:
| Grading Company | Action | New Grade | Date |
|---|---|---|---|
| BTIG | Maintain | Buy | 2026-01-15 |
| Barclays | Maintain | Overweight | 2026-01-12 |
| Jefferies | Maintain | Buy | 2026-01-05 |
| Citigroup | Maintain | Buy | 2025-12-23 |
| Tigress Financial | Maintain | Buy | 2025-12-11 |
| Baird | Maintain | Outperform | 2025-11-11 |
| Wells Fargo | Maintain | Overweight | 2025-11-11 |
| DA Davidson | Maintain | Buy | 2025-11-11 |
| Morgan Stanley | Maintain | Overweight | 2025-11-11 |
| Piper Sandler | Maintain | Overweight | 2025-11-11 |
monday.com Ltd. consistently receives buy and overweight ratings, reflecting positive sentiment and a consensus rating of Buy.
Which company has the best grades?
monday.com Ltd. holds the stronger grades with multiple buy and outperform ratings, indicating greater analyst confidence. Dayforce Inc.’s grades are more mixed and lean toward hold, suggesting more cautious market views. Investors may interpret these differences as reflecting varied expectations for future performance and risk profiles.
Strengths and Weaknesses
Here is a comparative overview of key strengths and weaknesses for Dayforce Inc and monday.com Ltd based on the most recent data.
| Criterion | Dayforce Inc (DAY) | monday.com Ltd (MNDY) |
|---|---|---|
| Diversification | Strong focus on cloud recurring services with $1.52B recurring revenue in 2024; moderate professional services segment | Primarily software platform, less diversified product portfolio |
| Profitability | Low net margin (1.03%), ROIC at 1.31%, overall unfavorable profitability metrics | Slightly better net margin (3.33%) but negative ROIC (-1.73%), mixed profitability |
| Innovation | Growing ROIC trend indicates improving efficiency despite current value destruction | Also shows growing ROIC trend but still shedding value, innovation impact uncertain |
| Global presence | Operates in cloud HR/payroll services, likely global reach but less explicit data | Known for wide SaaS adoption, strong international user base |
| Market Share | Significant recurring revenue in niche cloud HR/payroll service market | Strong presence in work OS market but highly competitive space |
Key takeaways: Both companies are currently value destroyers but show improving profitability trends. Dayforce has stronger recurring revenue diversification and slightly better margin stability, while monday.com benefits from a broader SaaS adoption and favorable liquidity ratios. Caution is advised given both face profitability challenges.
Risk Analysis
Below is a comparative table of key risks for Dayforce Inc and monday.com Ltd based on the most recent 2024 data:
| Metric | Dayforce Inc (DAY) | monday.com Ltd (MNDY) |
|---|---|---|
| Market Risk | Beta 1.18, moderate volatility | Beta 1.26, slightly higher volatility |
| Debt level | Debt-to-Equity 0.48, moderate debt | Debt-to-Equity 0.1, low debt level |
| Regulatory Risk | US-based, subject to US tech regulations | Israel-based, exposed to international regulatory environments |
| Operational Risk | Large workforce (9,600), integration complexity | Smaller workforce (2,508), rapid growth challenges |
| Environmental Risk | Moderate, typical for software firms | Moderate, typical for software firms |
| Geopolitical Risk | US domestic exposure | Exposure to Middle East tensions, international markets |
The most impactful risks are market volatility and operational challenges for Dayforce due to its larger scale and moderate leverage. monday.com faces geopolitical uncertainties given its Israeli base and international exposure but maintains lower financial risk with minimal debt. Both companies show average financial health scores, signaling cautious investment consideration.
Which Stock to Choose?
Dayforce Inc (DAY) shows a favorable income evolution with 108.9% revenue growth over 2020–2024 and improved profitability despite recent declines. Its financial ratios are mostly unfavorable, but debt levels and liquidity ratios are favorable. The company is shedding value with a slightly unfavorable moat and holds a very favorable overall rating of C-.
monday.com Ltd. (MNDY) exhibits strong income growth, notably 503.3% revenue increase over the period and consistently favorable income statement metrics. Its financial ratios present a balanced profile with 42.9% favorable metrics and excellent debt and liquidity positions. The company also has a slightly unfavorable moat due to value destruction but a very favorable B- rating and solid financial health scores.
From a rating and fundamental perspective, investors prioritizing robust income growth and moderate financial stability might view monday.com Ltd. as more attractive, while those emphasizing improving profitability and manageable debt might find Dayforce Inc. appealing. The final choice could depend on the investor’s risk tolerance and investment strategy, considering recent income trends and ratio evaluations.
Disclaimer: Investment carries a risk of loss of initial capital. The past performance is not a reliable indicator of future results. Be sure to understand risks before making an investment decision.
Go Further
I encourage you to read the complete analyses of Dayforce Inc and monday.com Ltd. to enhance your investment decisions: