In today’s evolving technology landscape, choosing the right software company to invest in requires careful analysis. Dayforce Inc and Match Group, Inc. both operate in the software application sector but serve distinctly different markets—human capital management and online dating, respectively. Their innovation strategies and market reach highlight contrasting growth opportunities. This article will guide you through a detailed comparison to identify which company stands out as the smarter investment choice.
Table of contents
Companies Overview
I will begin the comparison between Dayforce Inc and Match Group, Inc. by providing an overview of these two companies and their main differences.
Dayforce Inc Overview
Dayforce Inc operates as a human capital management (HCM) software provider, delivering cloud-based solutions for human resources, payroll, benefits, workforce, and talent management. It serves markets in the US, Canada, and internationally, including small businesses through its Powerpay platform. Headquartered in Minneapolis, Dayforce employs about 9,600 people and is listed on the NYSE with a market cap of approximately 11.1B USD.
Match Group, Inc. Overview
Match Group, Inc. offers a portfolio of dating products worldwide, including popular brands like Tinder, Match, OkCupid, and Hinge. The company is focused on the software application industry within the technology sector and is headquartered in Dallas, Texas. With around 2,500 employees, Match Group is traded on the NASDAQ and has a market capitalization near 7.4B USD.
Key similarities and differences
Both Dayforce and Match Group operate in the technology sector specializing in software applications, but their business models differ significantly. Dayforce provides enterprise and small business cloud software for human capital management, whereas Match Group focuses on consumer-facing online dating services. Dayforce’s workforce is considerably larger, reflecting its B2B orientation, compared to Match’s smaller, consumer-driven model.
Income Statement Comparison
The table below presents a factual comparison of the most recent fiscal year income statement metrics for Dayforce Inc and Match Group, Inc., based strictly on their reported financial data.
| Metric | Dayforce Inc (DAY) | Match Group, Inc. (MTCH) |
|---|---|---|
| Market Cap | 11.1B | 7.4B |
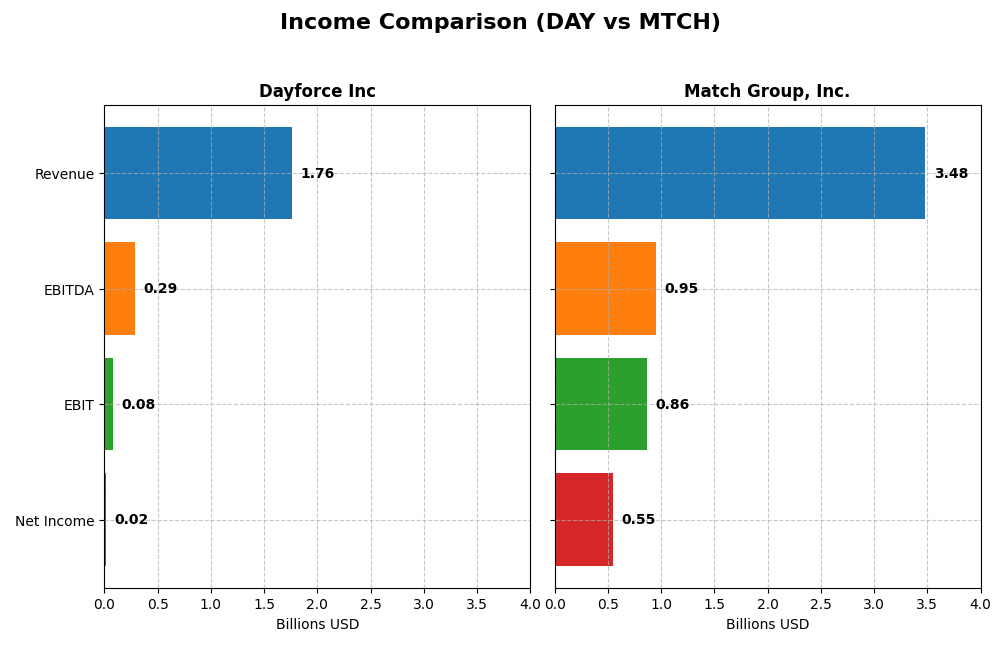
| Revenue | 1.76B | 3.48B |
| EBITDA | 288M | 952M |
| EBIT | 78.2M | 864M |
| Net Income | 18.1M | 551M |
| EPS | 0.11 | 2.12 |
| Fiscal Year | 2024 | 2024 |
Income Statement Interpretations
Dayforce Inc
Dayforce Inc demonstrated strong revenue growth, rising from $842M in 2020 to $1.76B in 2024, more than doubling over five years. Despite this, net income showed significant volatility, swinging from a loss of $-4M in 2020 to a modest profit of $18M in 2024. Gross margin remained favorable at 46.14%, but EBIT and net margins faced pressures in 2024, with EBIT margin neutral at 4.44% and net margin at 1.03%. The latest year saw revenue growth of 16.27%, but EBIT declined by 40.8%, reflecting increased operating expenses impacting profitability.
Match Group, Inc.
Match Group’s revenue steadily increased from $2.39B in 2020 to $3.48B in 2024, showing a 45.5% overall growth. Net income improved significantly, reaching $551M in 2024 from $162M in 2020, supported by a strong net margin of 15.84%. Gross margin was notably high at 71.51%, and EBIT margin stood at 24.84%, both favorable. However, in 2024, revenue growth slowed to 3.41%, with EBIT and net margin declining by 7.74% and 18.18% respectively, indicating some margin compression despite solid top-line performance.
Which one has the stronger fundamentals?
Both companies display favorable overall income statement evaluations with about 57% favorable metrics. Dayforce shows higher revenue growth and net income improvement over the period but struggles with margin stability and recent EBIT contraction. Match Group maintains superior profitability margins and consistent net income growth, though its recent growth rates have slowed. Fundamentals favor Match Group’s robust margins, while Dayforce’s rapid revenue expansion entails more risk amid margin pressures.
Financial Ratios Comparison
The table below presents key financial ratios for Dayforce Inc and Match Group, Inc. based on their most recent fiscal year data of 2024, offering a snapshot of profitability, liquidity, leverage, and efficiency.
| Ratios | Dayforce Inc (DAY) | Match Group, Inc. (MTCH) |
|---|---|---|
| ROE | 0.71% | -865.98% |
| ROIC | 1.31% | 16.38% |
| P/E | 633.3 | 15.4 |
| P/B | 4.50 | -133.75 |
| Current Ratio | 1.13 | 2.54 |
| Quick Ratio | 1.13 | 2.54 |
| D/E | 0.48 | -62.09 |
| Debt-to-Assets | 13.5% | 88.5% |
| Interest Coverage | 2.56 | 5.14 |
| Asset Turnover | 0.19 | 0.78 |
| Fixed Asset Turnover | 7.46 | 22.0 |
| Payout ratio | 0 | 0 |
| Dividend yield | 0% | 0% |
Interpretation of the Ratios
Dayforce Inc
Dayforce’s ratios show several weaknesses, with net margin at 1.03% and return on equity at a low 0.71%, both unfavorable. Its price-to-earnings ratio is very high at 633.29, indicating potential overvaluation. Favorable aspects include a quick ratio of 1.13 and moderate debt-to-equity of 0.48. The company does not pay dividends, reflecting a focus on reinvestment and growth.
Match Group, Inc.
Match Group exhibits stronger profitability metrics, with a favorable net margin of 15.84% and return on invested capital at 16.38%. The company’s balance sheet is supported by a high current ratio of 2.54 and interest coverage of 5.4. Despite no dividend payments, Match Group may prioritize R&D and acquisitions, consistent with its high intangible assets ratio and reinvestment strategy.
Which one has the best ratios?
Match Group’s ratios are generally more favorable, highlighted by stronger profitability, liquidity, and coverage ratios. Dayforce presents more unfavorable metrics, including low returns and a stretched valuation. Overall, Match Group’s financial profile appears stronger based on the ratio evaluation, with fewer notable weaknesses compared to Dayforce.
Strategic Positioning
This section compares the strategic positioning of Dayforce Inc and Match Group, Inc., focusing on market position, key segments, and exposure to technological disruption:
Dayforce Inc
- Leading HCM software provider with strong presence in US, Canada, and internationally; faces competition in cloud HR sector.
- Key segments include cloud HCM platform Dayforce, Powerpay for small businesses, and payroll bureau services; recurring revenue focus.
- Exposure to technological disruption through cloud platform innovation and evolving HR software needs; must adapt to changing workforce trends.
Match Group, Inc.
- Global dating products leader with diversified brand portfolio; competes in dynamic online dating market.
- Key segments are dating services with multiple brands like Tinder and Match; revenue driven by subscriptions and service fees.
- Faces technological disruption in digital dating platforms and consumer preferences; innovation critical to retain user engagement.
Dayforce Inc vs Match Group, Inc. Positioning
Dayforce offers diversified human capital management solutions with strong recurring revenue, while Match Group concentrates on dating services with a broad brand portfolio. Dayforce’s broad segment base contrasts with Match’s focused market approach, each with distinct competitive dynamics.
Which has the best competitive advantage?
Match Group shows a slightly favorable moat by creating value despite declining profitability, while Dayforce has a slightly unfavorable moat, shedding value but with improving profitability trends. Match Group currently holds a stronger competitive advantage.
Stock Comparison
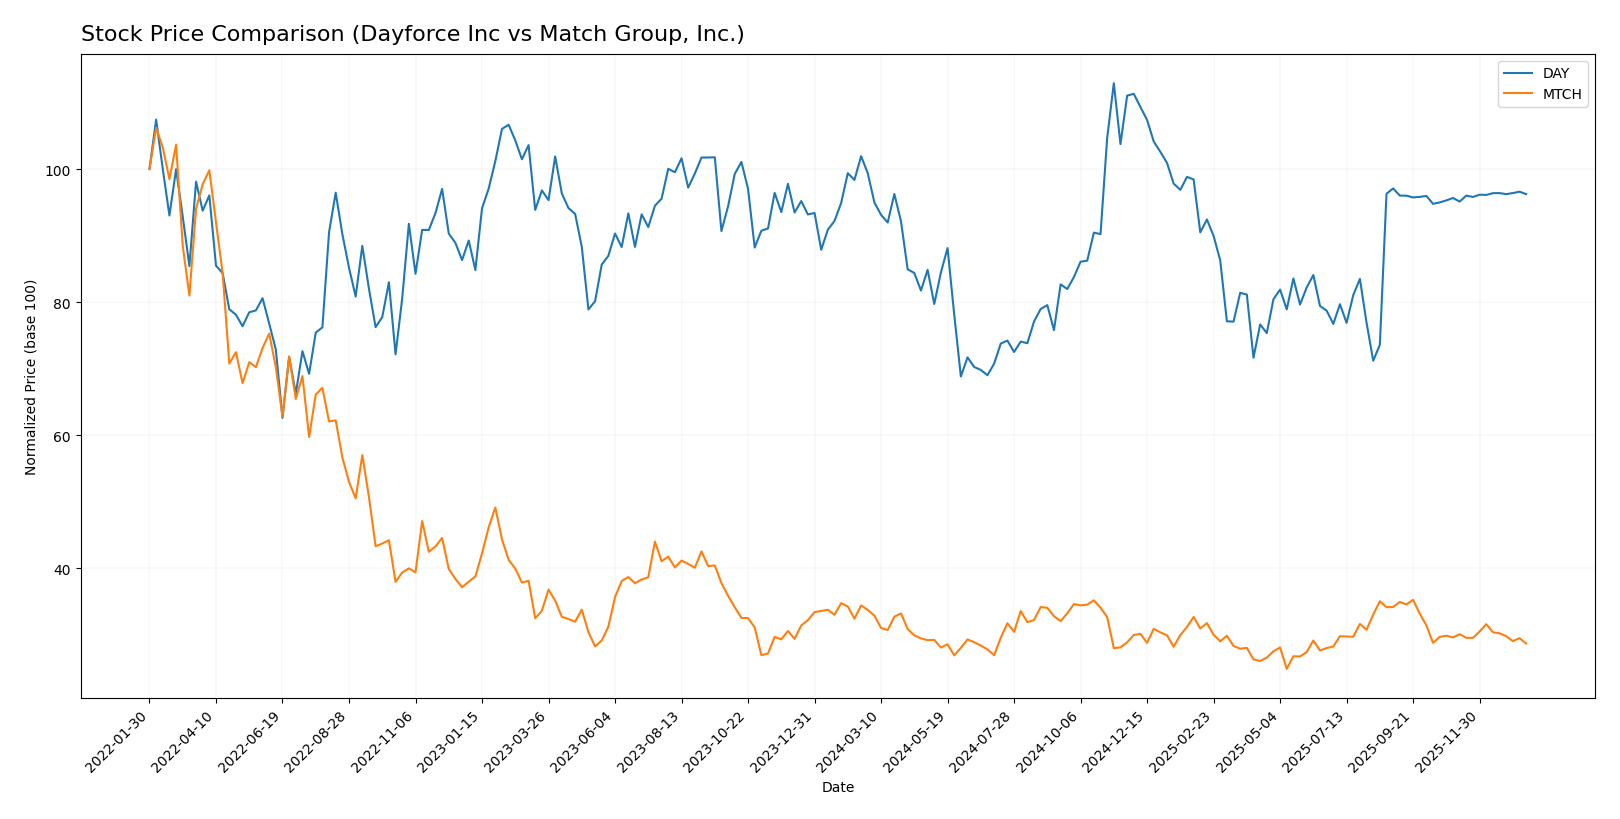
The stock price movements of Dayforce Inc (DAY) and Match Group, Inc. (MTCH) over the past 12 months exhibit bearish trends with differing volatility and volume dynamics, reflecting varied investor sentiment and market performance.
Trend Analysis
Dayforce Inc’s stock shows a bearish trend with a -3.16% price decline over the past year, accompanied by deceleration and high volatility (7.84 std deviation). The price ranged from a low of 49.46 to a high of 81.14.
Match Group, Inc.’s stock also experienced a bearish trend, with a sharper -14.98% decline over the same period, decelerating further and displaying lower volatility (2.64 std deviation). Its price fluctuated between 27.18 and 38.51.
Comparing both, Dayforce Inc outperformed Match Group, Inc. by delivering a smaller negative return, indicating a less severe market performance decline over the past year.
Target Prices
Analysts present a clear consensus on target prices for Dayforce Inc and Match Group, Inc.
| Company | Target High | Target Low | Consensus |
|---|---|---|---|
| Dayforce Inc | 70 | 70 | 70 |
| Match Group, Inc. | 43 | 33 | 36.29 |
The consensus target price for Dayforce Inc aligns closely with its current price of $69.16, suggesting limited upside. Match Group’s target consensus of $36.29 indicates a moderate potential increase from its current $31.34 price.
Analyst Opinions Comparison
This section compares analysts’ ratings and grades for Dayforce Inc and Match Group, Inc.:
Rating Comparison
Dayforce Inc Rating
- Rating: C- with a very favorable status summary.
- Discounted Cash Flow Score: 2, indicating moderate valuation risk.
- ROE Score: 1, showing very unfavorable efficiency in equity use.
- ROA Score: 1, reflecting very unfavorable asset utilization.
- Debt To Equity Score: 2, moderate financial risk.
- Overall Score: 1, considered very unfavorable overall.
Match Group, Inc. Rating
- Rating: B with a very favorable status summary.
- Discounted Cash Flow Score: 5, indicating very favorable valuation.
- ROE Score: 1, also very unfavorable in equity efficiency.
- ROA Score: 5, indicating very favorable asset utilization.
- Debt To Equity Score: 1, very unfavorable financial risk.
- Overall Score: 3, rated as moderate overall.
Which one is the best rated?
Based on the data, Match Group, Inc. holds a higher overall rating (B) and better scores in discounted cash flow and return on assets, despite weaker debt-to-equity and ROE scores, making it better rated than Dayforce Inc.
Scores Comparison
Here is a comparison of the Altman Z-Score and Piotroski Score for Dayforce Inc and Match Group, Inc.:
Dayforce Inc Scores
- Altman Z-Score: 1.24, in the distress zone, indicating high bankruptcy risk.
- Piotroski Score: 5, rated average, showing moderate financial strength.
Match Group Scores
- Altman Z-Score: 0.52, in the distress zone, indicating very high bankruptcy risk.
- Piotroski Score: 8, rated very strong, showing robust financial health.
Which company has the best scores?
Match Group has a much stronger Piotroski Score of 8 compared to Dayforce’s 5, indicating better financial health. However, both companies fall in the Altman Z-Score distress zone, with Match Group’s score being even lower.
Grades Comparison
The following presents the latest grades from reputable grading companies for Dayforce Inc and Match Group, Inc.:
Dayforce Inc Grades
This table summarizes recent analyst grades and changes for Dayforce Inc:
| Grading Company | Action | New Grade | Date |
|---|---|---|---|
| Needham | Maintain | Hold | 2025-10-30 |
| Stifel | Downgrade | Hold | 2025-09-19 |
| Citigroup | Downgrade | Neutral | 2025-09-17 |
| Wells Fargo | Upgrade | Equal Weight | 2025-08-22 |
| BMO Capital | Downgrade | Market Perform | 2025-08-22 |
| Keybanc | Downgrade | Sector Weight | 2025-08-22 |
| Needham | Downgrade | Hold | 2025-08-22 |
| Barclays | Maintain | Equal Weight | 2025-08-22 |
| Deutsche Bank | Maintain | Hold | 2025-08-22 |
| Jefferies | Maintain | Hold | 2025-08-21 |
Overall, Dayforce’s grades show a trend toward more cautious ratings, with multiple downgrades and a consensus rating of “Hold.”
Match Group, Inc. Grades
This table shows recent analyst grades and stability for Match Group, Inc.:
| Grading Company | Action | New Grade | Date |
|---|---|---|---|
| Morgan Stanley | Maintain | Equal Weight | 2026-01-13 |
| Truist Securities | Maintain | Hold | 2025-11-05 |
| Evercore ISI Group | Maintain | In Line | 2025-11-05 |
| Wells Fargo | Maintain | Equal Weight | 2025-11-05 |
| Morgan Stanley | Maintain | Equal Weight | 2025-10-20 |
| Susquehanna | Maintain | Positive | 2025-08-07 |
| Evercore ISI Group | Maintain | In Line | 2025-08-06 |
| JP Morgan | Maintain | Neutral | 2025-08-06 |
| UBS | Maintain | Neutral | 2025-07-23 |
| Wells Fargo | Maintain | Equal Weight | 2025-06-27 |
Match Group’s grades remain stable with no recent downgrades and a consensus rating of “Buy,” indicating a generally positive analyst outlook.
Which company has the best grades?
Match Group, Inc. has received generally steadier and more favorable grades compared to Dayforce Inc, which experienced several downgrades. For investors, this suggests a comparatively more optimistic analyst sentiment toward Match Group’s prospects.
Strengths and Weaknesses
The table below compares the key strengths and weaknesses of Dayforce Inc and Match Group, Inc. based on recent financial and operational data.
| Criterion | Dayforce Inc (DAY) | Match Group, Inc. (MTCH) |
|---|---|---|
| Diversification | Moderate: Mainly SaaS recurring revenue with some professional services (1.52B USD recurring revenue in 2024) | Moderate: Primarily dating services with some product/service diversification |
| Profitability | Low profitability: Net margin 1.03%, ROIC 1.31% (unfavorable) | Strong profitability: Net margin 15.84%, ROIC 16.38% (favorable) |
| Innovation | Growing ROIC trend (+2304%) indicates improving efficiency | Declining ROIC trend (-40%) signals potential innovation or competitive pressure issues |
| Global presence | Focused on cloud HR/payroll services, global footprint moderate | Large global footprint in online dating and social platforms |
| Market Share | Smaller niche player in cloud HR tech | Leading market share in online dating sector |
Key takeaways: Dayforce shows improving operational efficiency but struggles with profitability and market scale. Match Group maintains strong profitability and market leadership but faces challenges in sustaining ROIC growth. Investors should weigh Dayforce’s growth potential against Match Group’s established profitability and global presence.
Risk Analysis
Below is a comparison of key risks for Dayforce Inc and Match Group, Inc. based on their financial and market data for 2024.
| Metric | Dayforce Inc (DAY) | Match Group, Inc. (MTCH) |
|---|---|---|
| Market Risk | Beta 1.18; moderate volatility | Beta 1.33; higher volatility |
| Debt level | Debt-to-Equity 0.48; moderate risk | Negative DE ratio; high debt risk |
| Regulatory Risk | Moderate, industry software | Moderate, data privacy concerns |
| Operational Risk | Scaling cloud services, workforce | Brand diversification challenges |
| Environmental Risk | Low, typical for software sector | Low, typical for software sector |
| Geopolitical Risk | US-based, some international exposure | US-based, global dating platforms |
Dayforce shows moderate market risk and manageable debt but suffers from unfavorable profitability ratios and signs of financial distress (Altman Z-score 1.24). Match Group has higher market volatility and significant debt concerns, reflected in a distress zone Altman Z-score (0.52), but benefits from stronger profitability and operational efficiency. Investors should weigh financial distress risks and market volatility carefully when considering these stocks.
Which Stock to Choose?
Dayforce Inc (DAY) shows a favorable income evolution with revenue growth of 16.27% in 2024 and positive long-term net income increases. However, its financial ratios are largely unfavorable, including a low ROE of 0.71% and high P/E of 633.29, with a moderately low debt level and a very favorable rating of C-. The company is slightly unfavorable in value creation, indicating it is shedding value despite a growing ROIC.
Match Group, Inc. (MTCH) exhibits steady income growth with a 3.41% revenue increase in 2024 and favorable profitability metrics, including a 15.84% net margin and a solid ROIC of 16.38%. Its financial ratios are mostly favorable, though with a high debt-to-assets ratio of 88.5%. MTCH holds a better rating of B and is slightly favorable in value creation, showing value generation despite a declining ROIC.
For investors prioritizing growth and value creation, MTCH’s favorable financial ratios and rating might appear more appealing, while those focused on a company with improving profitability trends despite value shedding could consider DAY. The choice could depend on the investor’s risk tolerance and preference for stability versus turnaround potential.
Disclaimer: Investment carries a risk of loss of initial capital. The past performance is not a reliable indicator of future results. Be sure to understand risks before making an investment decision.
Go Further
I encourage you to read the complete analyses of Dayforce Inc and Match Group, Inc. to enhance your investment decisions: