In the dynamic world of software applications, Intuit Inc. and Dayforce Inc. stand out as leaders driving innovation in financial and human capital management solutions. Intuit focuses on comprehensive financial tools for small businesses and consumers, while Dayforce specializes in cloud-based human resources and payroll software. This comparison explores their market positioning and growth strategies to help you decide which company offers the most compelling investment opportunity in 2026.
Table of contents
Companies Overview
I will begin the comparison between Intuit Inc. and Dayforce Inc by providing an overview of these two companies and their main differences.
Intuit Inc. Overview
Intuit Inc. is a leading provider of financial management and compliance software and services, targeting consumers, small businesses, and accounting professionals primarily in the US, Canada, and internationally. The company operates four main segments, including Small Business & Self-Employed and Consumer, offering solutions like QuickBooks and TurboTax. Intuit is headquartered in Mountain View, California, with a market cap of $151B as of 2026.
Dayforce Inc Overview
Dayforce Inc. specializes in human capital management (HCM) software, providing cloud-based HR, payroll, benefits, workforce, and talent management solutions, including its flagship Dayforce platform and Powerpay for small businesses. Operating mainly in the US, Canada, and internationally, Dayforce is headquartered in Minneapolis, Minnesota, with a market cap of $11B and about 9,600 employees as of 2026.
Key similarities and differences
Both Intuit and Dayforce operate in the software application industry with a technology focus and serve international markets. Intuit’s business model centers on financial management and tax preparation products, while Dayforce focuses exclusively on HCM and payroll services. Intuit’s market cap and workforce size are significantly larger, reflecting its broader product portfolio and customer base compared to Dayforce’s more specialized offerings.
Income Statement Comparison
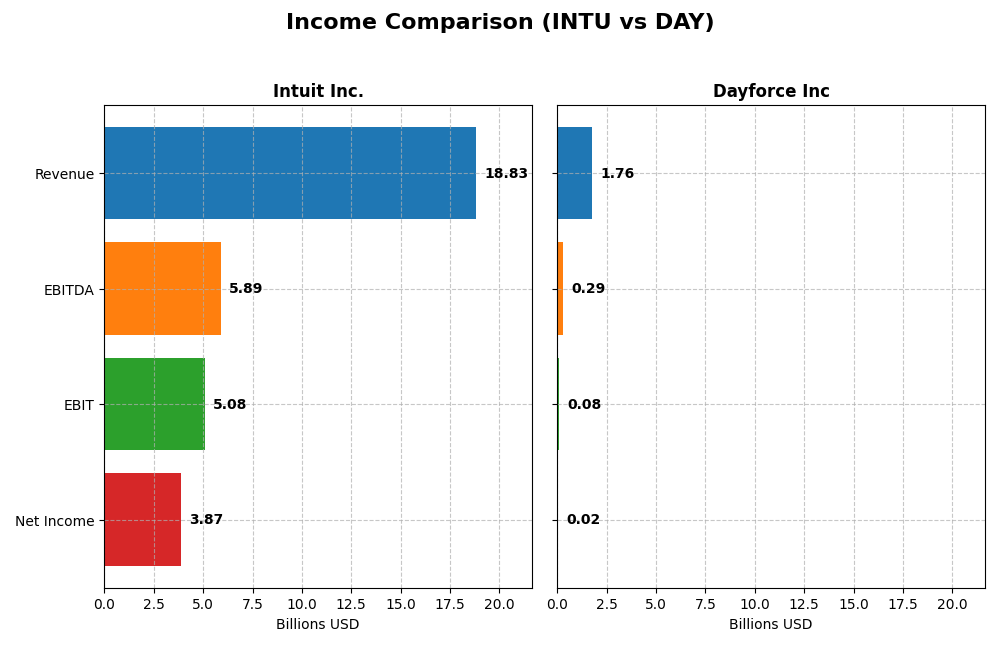
The table below presents a side-by-side comparison of the most recent fiscal year income statement metrics for Intuit Inc. and Dayforce Inc., highlighting key financial results.
| Metric | Intuit Inc. (INTU) | Dayforce Inc (DAY) |
|---|---|---|
| Market Cap | 151.4B | 11.1B |
| Revenue | 18.8B | 1.76B |
| EBITDA | 5.89B | 288M |
| EBIT | 5.08B | 78.2M |
| Net Income | 3.87B | 18.1M |
| EPS | 13.82 | 0.11 |
| Fiscal Year | 2025 | 2024 |
Income Statement Interpretations
Intuit Inc.
Intuit displayed strong revenue growth from $9.63B in 2021 to $18.83B in 2025, with net income rising from $2.06B to $3.87B over the same period. Margins remained robust, with a consistently high gross margin around 80.8%. The latest fiscal year showed a favorable 15.6% revenue increase and a 12.9% net margin improvement, reflecting solid operational efficiency and profitability expansion.
Dayforce Inc
Dayforce’s revenue grew steadily from $842M in 2020 to $1.76B in 2024, while net income improved from a loss of $4M to a positive $18M. The company’s gross margin was favorable at 46.1%, but EBIT and net margins remained modest at 4.4% and 1.0%, respectively. The most recent year saw revenue up 16.3%, but net margin contracted sharply, indicating pressure on profitability despite growth.
Which one has the stronger fundamentals?
Intuit demonstrates stronger fundamentals with high and improving margins, consistent profitability, and favorable growth in key metrics including EPS and EBIT. Dayforce shows impressive growth from a low base but struggles with margin volatility and weaker profitability indicators. Intuit’s stable, high-margin profile contrasts with Dayforce’s narrower margins and recent margin challenges.
Financial Ratios Comparison
The table below presents the most recent key financial ratios for Intuit Inc. and Dayforce Inc, facilitating a straightforward comparison of their financial performance and position as of their latest fiscal years.
| Ratios | Intuit Inc. (2025) | Dayforce Inc (2024) |
|---|---|---|
| ROE | 19.6% | 0.71% |
| ROIC | 14.8% | 1.31% |
| P/E | 56.8 | 633.3 |
| P/B | 11.2 | 4.50 |
| Current Ratio | 1.36 | 1.13 |
| Quick Ratio | 1.36 | 1.13 |
| D/E (Debt-to-Equity) | 0.34 | 0.48 |
| Debt-to-Assets | 18.0% | 13.5% |
| Interest Coverage | 19.9 | 2.56 |
| Asset Turnover | 0.51 | 0.19 |
| Fixed Asset Turnover | 12.5 | 7.46 |
| Payout Ratio | 30.7% | 0% |
| Dividend Yield | 0.54% | 0% |
Interpretation of the Ratios
Intuit Inc.
Intuit’s financial ratios are mostly strong, with favorable net margin at 20.55%, ROE at 19.63%, and ROIC at 14.78%, indicating solid profitability and efficient capital use. However, high P/E of 56.82 and P/B of 11.15 suggest potential overvaluation risks. The dividend yield is low at 0.54%, reflecting a modest payout relative to earnings and free cash flow coverage.
Dayforce Inc
Dayforce shows weak profitability ratios, with net margin at 1.03%, ROE at 0.71%, and ROIC at 1.31%, signaling limited earnings generation. The company pays no dividends, consistent with its low returns and reinvestment focus. Debt levels are moderate, but interest coverage is low at 1.93, posing some financial risk. Asset turnover is also unfavorable, reflecting operational efficiency concerns.
Which one has the best ratios?
Intuit clearly has the best ratios, with a majority of favorable indicators including profitability, leverage, and operational efficiency. Dayforce exhibits multiple unfavorable ratios, notably in profitability and interest coverage, leading to an overall unfavorable evaluation. Intuit’s higher dividend yield and stronger financial health mark it as the more robust entity financially.
Strategic Positioning
This section compares the strategic positioning of Intuit Inc. and Dayforce Inc, including market position, key segments, and exposure to technological disruption:
Intuit Inc.
- Leading software application firm with $151B market cap, facing moderate competitive pressures.
- Diverse segments: Small Business & Self-Employed, Consumer, Credit Karma, ProConnect drive growth.
- Operates cloud-based and desktop solutions with incremental innovation; potential disruption risk managed.
Dayforce Inc
- Smaller scale with $11B market cap, operating under moderate competition in HCM software.
- Focused on cloud HCM platform, payroll, benefits, and talent management for businesses.
- Cloud-based HCM solutions with ongoing platform updates; technology disruption remains a factor.
Intuit Inc. vs Dayforce Inc Positioning
Intuit’s diversified portfolio across multiple financial and tax-related segments contrasts with Dayforce’s concentrated focus on human capital management software. Intuit benefits from broad market reach, while Dayforce targets specialized cloud-based payroll and HR solutions, each with distinct growth drivers and risk profiles.
Which has the best competitive advantage?
Intuit shows a slightly favorable moat with value creation despite declining ROIC, indicating established competitive advantages. Dayforce has a slightly unfavorable moat, shedding value but improving profitability, suggesting emerging but less stable competitive positioning.
Stock Comparison
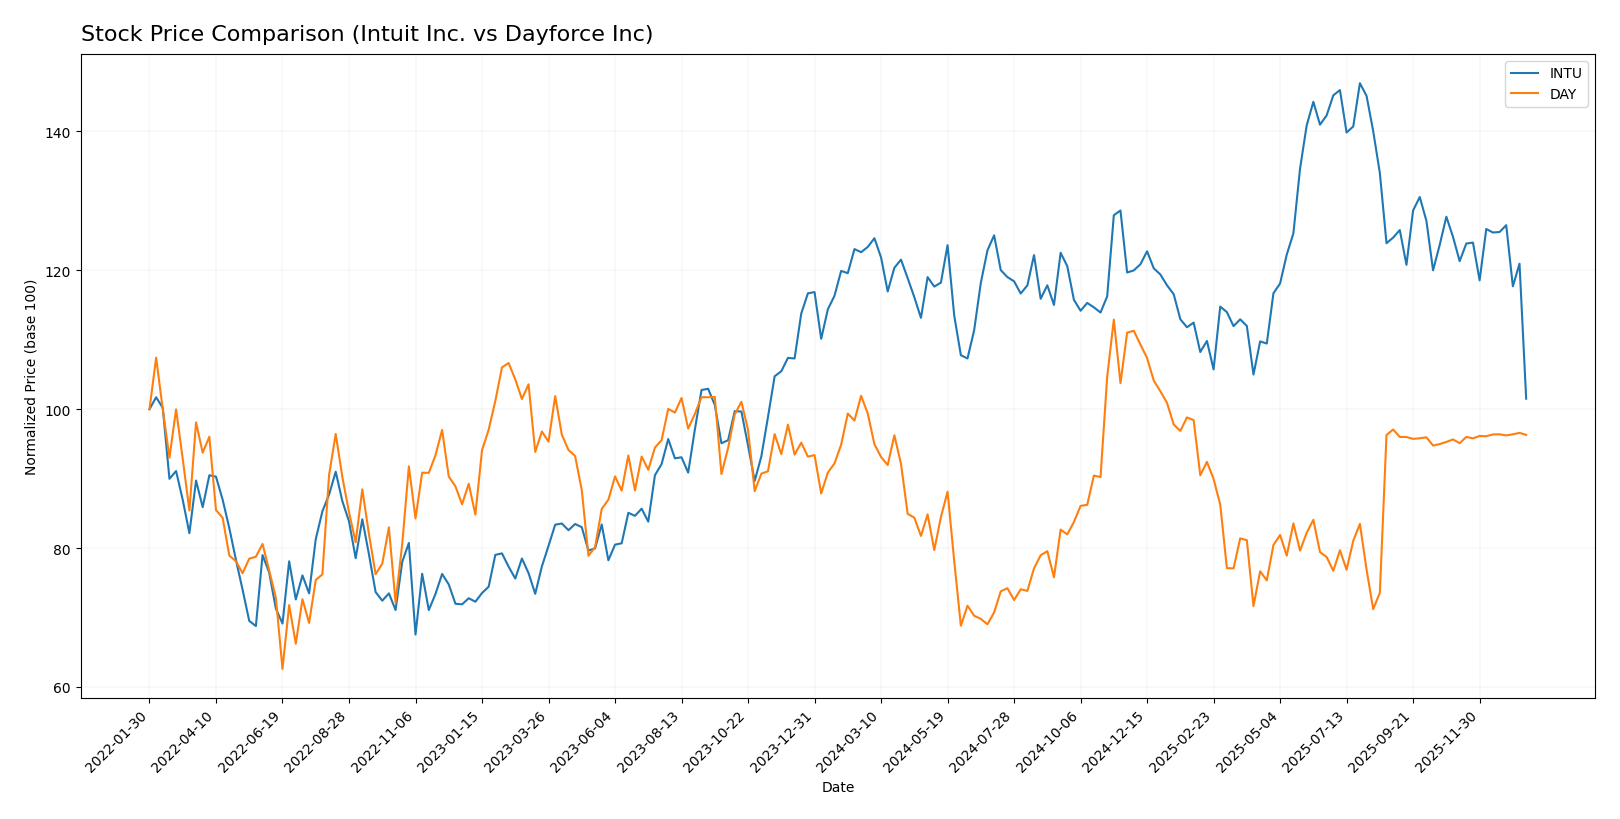
The stock price movements of Intuit Inc. and Dayforce Inc. over the past 12 months reveal contrasting bearish trends with differing degrees of price decline and recent performance dynamics.
Trend Analysis
Intuit Inc. shows a bearish trend with a -17.71% price change over the past year, accompanied by deceleration and high volatility (std deviation 51.56). The stock fluctuated between a high of 785.95 and a low of 542.92.
Dayforce Inc. also experienced a bearish trend with a -3.09% price change over the past year, with deceleration and lower volatility (std deviation 7.84). The price ranged from 81.14 to 49.46, with a slight positive trend recently.
Comparing the two, Dayforce Inc. delivered the highest market performance, with a smaller price decline and recent upward trend, outperforming Intuit Inc.’s steeper and persistent decline.
Target Prices
Analysts present a clear target price consensus for Intuit Inc. and Dayforce Inc, reflecting their growth expectations.
| Company | Target High | Target Low | Consensus |
|---|---|---|---|
| Intuit Inc. | 880 | 700 | 798.4 |
| Dayforce Inc | 70 | 70 | 70 |
For Intuit Inc., the consensus target price of 798.4 USD suggests significant upside potential from the current 543.73 USD stock price. Dayforce Inc.’s target consensus of 70 USD is very close to its current price of 69.2 USD, indicating a stable outlook.
Analyst Opinions Comparison
This section compares analysts’ ratings and grades for Intuit Inc. and Dayforce Inc.:
Rating Comparison
Intuit Inc. Rating
- Rating: B, indicating a very favorable assessment.
- Discounted Cash Flow Score: 4, considered favorable.
- ROE Score: 4, which is favorable.
- ROA Score: 5, very favorable and the highest among scores.
- Debt To Equity Score: 2, moderate financial risk indicated.
- Overall Score: 3, a moderate overall rating.
Dayforce Inc Rating
- Rating: C-, also marked very favorable despite the letter.
- Discounted Cash Flow Score: 2, rated as moderate.
- ROE Score: 1, considered very unfavorable.
- ROA Score: 1, very unfavorable.
- Debt To Equity Score: 2, also moderate financial risk.
- Overall Score: 1, very unfavorable overall rating.
Which one is the best rated?
Based strictly on the provided data, Intuit Inc. holds higher and more favorable ratings across all key financial metrics compared to Dayforce Inc., which shows generally low and unfavorable scores. Intuit is clearly better rated in this comparison.
Scores Comparison
The scores comparison of Intuit Inc. and Dayforce Inc highlights their financial health and bankruptcy risk:
Intuit Inc. Scores
- Altman Z-Score: 9.35, indicating a safe zone with very low bankruptcy risk.
- Piotroski Score: 9, representing very strong financial health.
Dayforce Inc Scores
- Altman Z-Score: 1.24, indicating a distress zone with high bankruptcy risk.
- Piotroski Score: 5, indicating average financial strength.
Which company has the best scores?
Intuit Inc. has significantly better scores than Dayforce Inc, with a much higher Altman Z-Score in the safe zone and a Piotroski Score indicating very strong financial health, compared to Dayforce’s distress zone and average score.
Grades Comparison
Here is a comparison of the recent grades assigned to Intuit Inc. and Dayforce Inc by recognized grading companies:
Intuit Inc. Grades
This table shows recent grades and rating changes from known financial institutions for Intuit Inc.:
| Grading Company | Action | New Grade | Date |
|---|---|---|---|
| Wells Fargo | Downgrade | Equal Weight | 2026-01-08 |
| Wells Fargo | Maintain | Overweight | 2025-11-21 |
| RBC Capital | Maintain | Outperform | 2025-11-21 |
| BMO Capital | Maintain | Outperform | 2025-11-21 |
| Evercore ISI Group | Maintain | Outperform | 2025-11-18 |
| RBC Capital | Maintain | Outperform | 2025-09-02 |
| RBC Capital | Maintain | Outperform | 2025-08-22 |
| UBS | Maintain | Neutral | 2025-08-22 |
| Morgan Stanley | Maintain | Overweight | 2025-08-22 |
| Barclays | Maintain | Overweight | 2025-08-22 |
Overall, Intuit’s grades mainly indicate a bullish outlook with multiple “Outperform” and “Overweight” ratings, despite a recent downgrade by Wells Fargo to “Equal Weight.”
Dayforce Inc Grades
This table provides recent grades and revisions from recognized grading firms for Dayforce Inc:
| Grading Company | Action | New Grade | Date |
|---|---|---|---|
| Needham | Maintain | Hold | 2025-10-30 |
| Stifel | Downgrade | Hold | 2025-09-19 |
| Citigroup | Downgrade | Neutral | 2025-09-17 |
| Wells Fargo | Upgrade | Equal Weight | 2025-08-22 |
| BMO Capital | Downgrade | Market Perform | 2025-08-22 |
| Keybanc | Downgrade | Sector Weight | 2025-08-22 |
| Needham | Downgrade | Hold | 2025-08-22 |
| Barclays | Maintain | Equal Weight | 2025-08-22 |
| Deutsche Bank | Maintain | Hold | 2025-08-22 |
| Jefferies | Maintain | Hold | 2025-08-21 |
Dayforce’s ratings predominantly cluster around “Hold” and “Equal Weight,” with several downgrades from “Buy” or “Outperform” categories, reflecting a more cautious consensus.
Which company has the best grades?
Intuit Inc. holds a stronger overall grade consensus with numerous “Outperform” and “Overweight” ratings compared to Dayforce Inc.’s mainly “Hold” and neutral grades. This difference may influence investors seeking growth potential to view Intuit more favorably.
Strengths and Weaknesses
Below is a comparison of key strengths and weaknesses for Intuit Inc. (INTU) and Dayforce Inc. (DAY) based on the most recent financial and strategic data.
| Criterion | Intuit Inc. (INTU) | Dayforce Inc. (DAY) |
|---|---|---|
| Diversification | Highly diversified across consumer, business, professional tax, and credit services segments (>$22B total revenue in 2025) | Concentrated mostly in cloud-based recurring services (~$1.5B recurring revenue in 2024) |
| Profitability | Strong profitability with 20.55% net margin, 19.63% ROE, and 14.78% ROIC (2025) | Low profitability: 1.03% net margin, 0.71% ROE, and 1.31% ROIC (2024) |
| Innovation | Established innovation with steady growth in product segments and high fixed asset turnover (12.54) | Growing ROIC trend implies improving innovation and profitability, but overall weak financials |
| Global presence | Significant global business solutions segment ($11.1B in 2025), indicating broad international reach | Primarily focused on cloud HR/payroll services with limited global scale yet |
| Market Share | Large market share in financial and small business software markets | Smaller market share, niche player in cloud HR/payroll sector |
Key takeaways: Intuit shows strong diversification, profitability, and global reach, though its profitability trend is slightly declining. Dayforce is less profitable and less diversified but demonstrates improving profitability trends, suggesting potential for growth with higher risk. Investors should weigh Intuit’s established strength against Dayforce’s growth potential and current financial challenges.
Risk Analysis
Below is a comparative table summarizing key risks for Intuit Inc. and Dayforce Inc. based on the most recent financial and market data:
| Metric | Intuit Inc. (INTU) | Dayforce Inc. (DAY) |
|---|---|---|
| Market Risk | Moderate (Beta 1.25) | Moderate (Beta 1.18) |
| Debt Level | Low (D/E 0.34, Debt/Assets 18%) | Moderate (D/E 0.48, Debt/Assets 14%) |
| Regulatory Risk | Moderate (Tech & financial compliance) | Moderate (HR/payroll regulations) |
| Operational Risk | Low (Strong cloud platform, 18.8K employees) | Moderate (Smaller scale, 9.6K employees) |
| Environmental Risk | Low (Software sector, limited direct impact) | Low (Software sector, limited direct impact) |
| Geopolitical Risk | Moderate (Global operations, US-based) | Moderate (Global reach, US-based) |
Intuit faces its most impactful risks in market volatility and regulatory compliance given its size and multiple financial service segments. Dayforce’s key concerns are operational risks and financial distress signals, as indicated by its weak profitability and Altman Z-score in the distress zone. Investors should weigh Intuit’s stronger financial health against Dayforce’s higher leverage and lower earnings stability.
Which Stock to Choose?
Intuit Inc. (INTU) shows a favorable income evolution with a 15.63% revenue growth in 2025, strong profitability indicated by a 20.55% net margin, and solid financial ratios including a 19.63% ROE and low debt levels. Its rating is very favorable with a “B” grade, supported by a safe Altman Z-Score of 9.35 and a very strong Piotroski score of 9, despite a bearish stock trend.
Dayforce Inc (DAY) presents mixed signals: while its revenue grew 16.27% in 2024 and net income improved over the longer term, profitability remains weak at a 1.03% net margin and unfavorable return ratios. The company has higher debt relative to earnings, a very unfavorable overall rating “C-“, and a distress zone Altman Z-Score of 1.24, though its ROIC shows a growing trend indicating improving profitability.
Investors seeking stability and proven value creation may find Intuit’s favorable rating, solid profitability, and financial strength more appealing, while those with tolerance for risk and a focus on turnaround potential might interpret Dayforce’s improving ROIC trend and revenue growth as signs of possible future gains. The choice could thus depend on an investor’s risk profile and investment strategy.
Disclaimer: Investment carries a risk of loss of initial capital. The past performance is not a reliable indicator of future results. Be sure to understand risks before making an investment decision.
Go Further
I encourage you to read the complete analyses of Intuit Inc. and Dayforce Inc to enhance your investment decisions: