In today’s fast-evolving software landscape, Figma, Inc. and Dayforce Inc. stand out as innovators in application software but serve distinct yet overlapping markets. Figma leads with collaborative design tools that transform product development, while Dayforce excels in human capital management solutions for enterprises. This article will analyze their market positions, innovation strategies, and growth potential to help you decide which company offers the most compelling investment opportunity.
Table of contents
Companies Overview
I will begin the comparison between Figma and Dayforce by providing an overview of these two companies and their main differences.
Figma Overview
Figma, Inc. develops browser-based design tools aimed at enhancing collaboration among design and development teams. Its product suite includes Figma Design, Dev Mode, FigJam, and AI-powered Figma Make, focusing on user interface design, prototyping, and streamlining product development. Founded in 2012 and headquartered in San Francisco, Figma operates in the software application industry with a market cap of $14.4B.
Dayforce Overview
Dayforce Inc. operates as a human capital management (HCM) software provider, offering cloud-based platforms like Dayforce and Powerpay for HR, payroll, benefits, and workforce management. The company serves both enterprise and small business markets through direct and third-party sales. Incorporated in 2013 and based in Minneapolis, Dayforce holds a $11.1B market cap in the software application sector.
Key similarities and differences
Both Figma and Dayforce operate in the software application industry and trade on the NYSE, focusing on cloud-based solutions. Figma specializes in collaborative design tools for product development, while Dayforce targets human capital management and payroll services. Their business models differ in target markets and product focus, with Figma serving design teams and Dayforce catering to HR and payroll functions across various organizations.
Income Statement Comparison
This table presents a side-by-side comparison of key income statement metrics for Figma, Inc. and Dayforce Inc for their most recent fiscal year ending 2024.
| Metric | Figma, Inc. (FIG) | Dayforce Inc (DAY) |
|---|---|---|
| Market Cap | 14.4B | 11.1B |
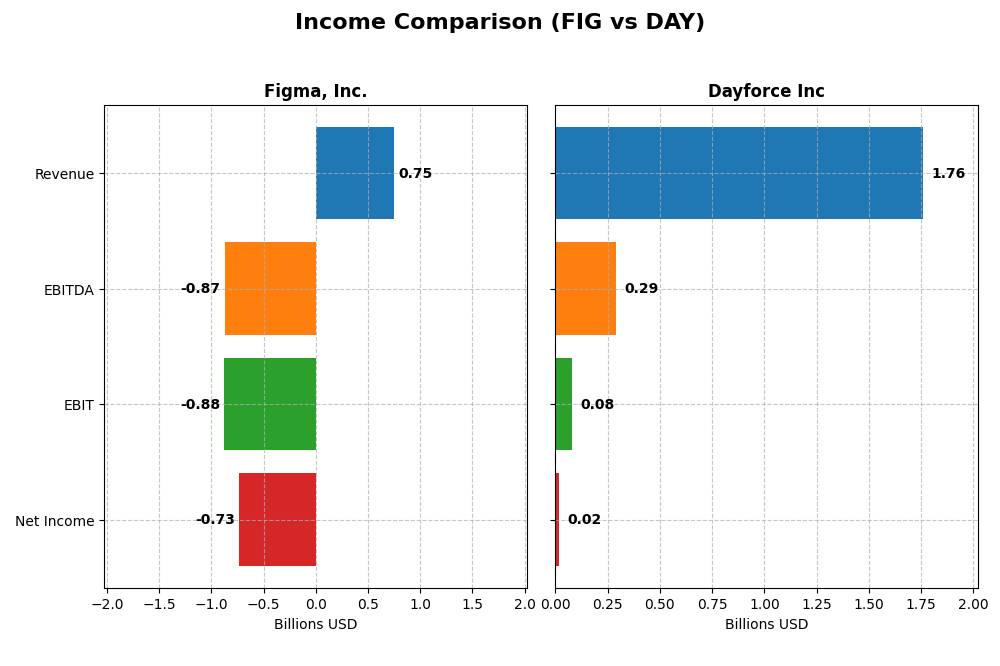
| Revenue | 749M | 1.76B |
| EBITDA | -870M | 288M |
| EBIT | -877M | 78.2M |
| Net Income | -732M | 18.1M |
| EPS | -3.11 | 0.11 |
| Fiscal Year | 2024 | 2024 |
Income Statement Interpretations
Figma, Inc.
Figma’s revenue grew significantly by 48.36% from 2023 to 2024, reaching $749M, with a strong gross margin of 88.32%. However, net income turned sharply negative to -$732M, reflecting deteriorated net margins at -97.74%. Operating expenses rose disproportionately, causing EBIT and net income margins to decline notably in 2024 despite top-line growth.
Dayforce Inc
Dayforce showed steady revenue growth of 16.27% in 2024, totaling $1.76B, with a gross margin of 46.14%. Net income increased over the longer term but declined to $18.1M in 2024, with net margin near 1.03%. EBIT margin was modestly positive at 4.44%, though recent margin contraction and EPS decline indicate pressure on profitability despite top-line expansion.
Which one has the stronger fundamentals?
Dayforce exhibits stronger fundamentals with favorable overall revenue and net income growth, moderate profitability margins, and a positive global income statement evaluation. Figma, despite robust revenue growth and high gross margin, faces significant net losses and unfavorable margin trends. Hence, Dayforce’s financials appear more balanced and sustainable compared to Figma’s current income statement performance.
Financial Ratios Comparison
The table below presents a side-by-side comparison of key financial ratios for Figma, Inc. and Dayforce Inc as reported for fiscal year 2024.
| Ratios | Figma, Inc. (FIG) | Dayforce Inc (DAY) |
|---|---|---|
| ROE | -55.3% | 0.71% |
| ROIC | -59.7% | 1.31% |
| P/E | -70.7 | 633.3 |
| P/B | 39.1 | 4.50 |
| Current Ratio | 3.66 | 1.13 |
| Quick Ratio | 3.66 | 1.13 |
| D/E (Debt-to-Equity) | 0.022 | 0.48 |
| Debt-to-Assets | 1.60% | 13.5% |
| Interest Coverage | 0 | 2.56 |
| Asset Turnover | 0.42 | 0.19 |
| Fixed Asset Turnover | 17.1 | 7.46 |
| Payout Ratio | 0% | 0% |
| Dividend Yield | 0% | 0% |
Interpretation of the Ratios
Figma, Inc.
Figma’s financial ratios present a mixed picture with significant weaknesses: negative net margin (-97.74%), return on equity (-55.29%), and return on invested capital (-59.68%) indicate poor profitability and capital efficiency. While the low debt levels and strong quick ratio are positives, the high price-to-book ratio (39.1) and zero dividend yield raise concerns. Figma does not pay dividends, likely due to its negative net income and focus on growth and reinvestment.
Dayforce Inc
Dayforce shows generally weak profitability ratios with a net margin of 1.03%, return on equity of 0.71%, and return on invested capital of 1.31%, all unfavorable. The company maintains moderate leverage and a quick ratio above 1, but valuation multiples like a price-to-earnings ratio of 633.29 are elevated. Similar to Figma, Dayforce does not issue dividends, suggesting prioritization of reinvestment and growth over shareholder payouts.
Which one has the best ratios?
Both companies exhibit predominantly unfavorable ratios, reflecting challenges in profitability and efficiency. Figma has a slightly higher proportion of favorable ratios (42.86%) compared to Dayforce (28.57%), mainly due to lower leverage and stronger liquidity. However, both lack dividend payments and face concerns around valuation and returns, resulting in an overall cautious view of their financial health.
Strategic Positioning
This section compares the strategic positioning of Figma, Inc. and Dayforce Inc, focusing on market position, key segments, and exposure to technological disruption:
Figma, Inc.
- Emerging software application company with high market volatility and negative beta.
- Focused on collaborative design tools and AI-powered prototyping enhancing UI/UX development.
- Operates in a technology-driven sector with potential risks from rapid innovation in design tools.
Dayforce Inc
- Established software application firm with stable market cap and moderate beta indicating steady demand.
- Concentrated on cloud-based human capital management and payroll services with significant recurring revenue.
- Faces moderate technological disruption risk in cloud HCM but benefits from recurring cloud service models.
Figma, Inc. vs Dayforce Inc Positioning
Figma pursues a concentrated strategy in collaborative design software and AI integration, while Dayforce focuses on diversified cloud HCM and payroll services. Figma’s niche focus contrasts with Dayforce’s broader recurring revenue streams and larger employee base.
Which has the best competitive advantage?
Both companies are currently shedding value relative to their capital costs. Dayforce shows improving profitability trends, indicating a slightly more favorable moat compared to Figma’s strongly declining returns and value destruction.
Stock Comparison
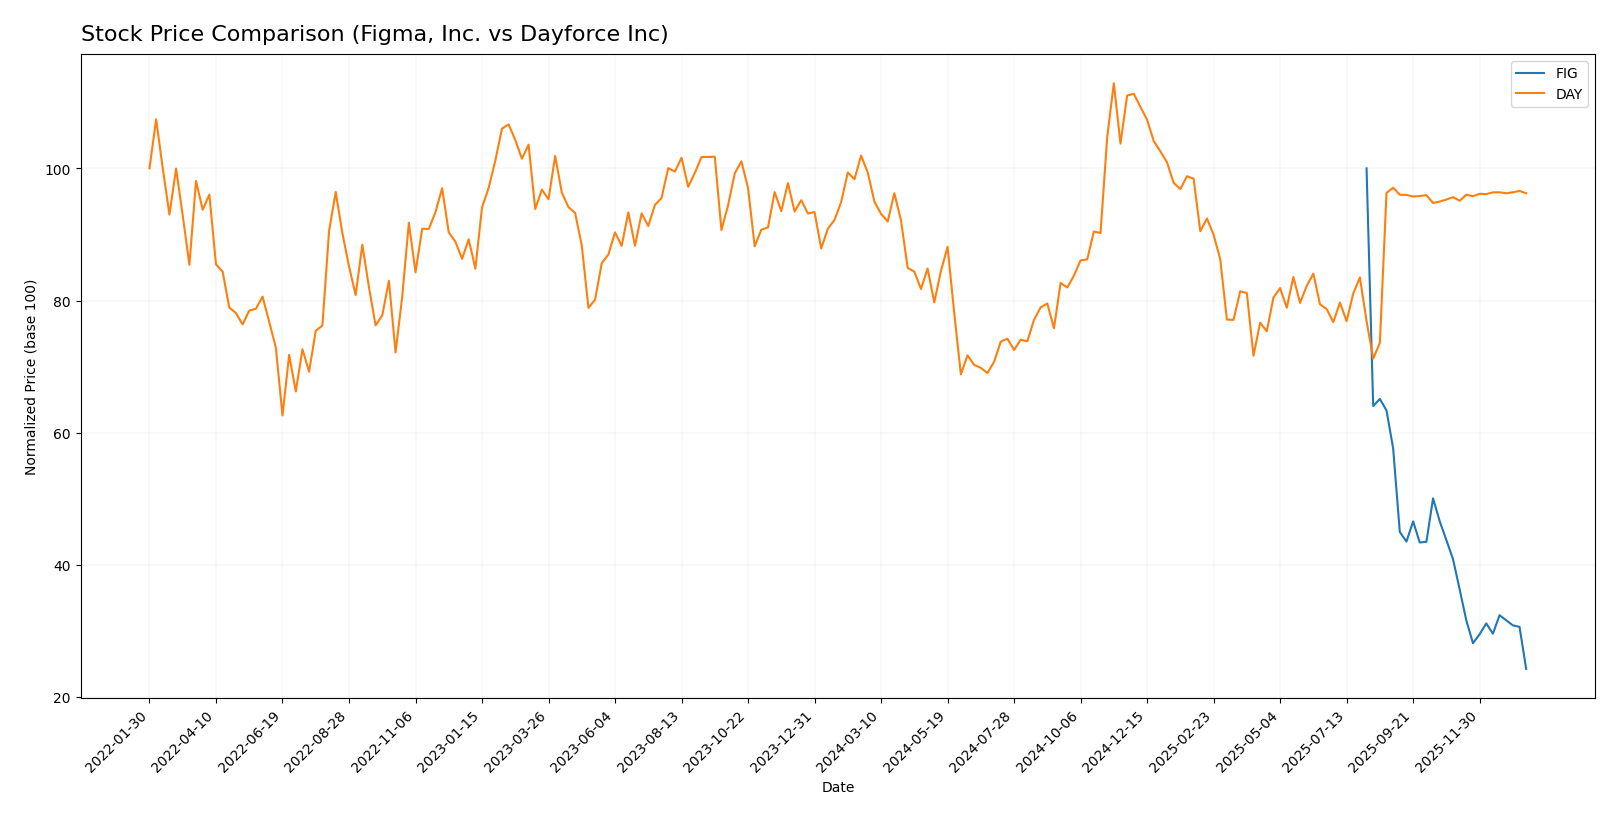
The stock price movements over the past 12 months reveal significant declines for both Figma, Inc. and Dayforce Inc, with Figma experiencing a sharper drop and higher volatility compared to Dayforce’s more moderate losses and recent stabilization.
Trend Analysis
Figma, Inc. (FIG) shows a bearish trend over the past year with a -75.76% price change, marked by accelerating decline and high volatility (std deviation 19.95), hitting a low of 29.57 from a high of 122.0.
Dayforce Inc (DAY) also demonstrates a bearish trend with a -3.16% loss over the year, but with decelerating downward momentum and lower volatility (std deviation 7.84), ranging between 49.46 and 81.14.
Comparing both, Figma’s stock delivered the lowest market performance, falling substantially more than Dayforce, which experienced a mild decline and recent slight upward movement.
Target Prices
Here is the consensus target price outlook from verified analysts for key software companies.
| Company | Target High | Target Low | Consensus |
|---|---|---|---|
| Figma, Inc. | 52 | 38 | 43.6 |
| Dayforce Inc | 70 | 70 | 70 |
Analysts expect Figma’s stock to appreciate from its current price of $29.57 toward a consensus target of $43.6, indicating significant upside potential. Dayforce’s target aligns closely with its current price of $69.16, suggesting a stable valuation outlook.
Analyst Opinions Comparison
This section compares analysts’ ratings and financial scores for Figma, Inc. and Dayforce Inc:
Rating Comparison
FIG Rating
- Rating: C+ with a very favorable status.
- Discounted Cash Flow Score: 4, indicating a favorable valuation outlook.
- ROE Score: 1, classified as very unfavorable for profitability efficiency.
- ROA Score: 1, very unfavorable in asset utilization efficiency.
- Debt To Equity Score: 4, favorable, indicating lower financial risk.
- Overall Score: 2, moderate overall financial standing.
DAY Rating
- Rating: C- with a very favorable status.
- Discounted Cash Flow Score: 2, showing a moderate valuation outlook.
- ROE Score: 1, also very unfavorable in generating profit from equity.
- ROA Score: 1, very unfavorable for asset earnings generation.
- Debt To Equity Score: 2, moderate, suggesting some financial risk exposure.
- Overall Score: 1, very unfavorable overall financial standing.
Which one is the best rated?
Based strictly on the provided data, Figma, Inc. has better overall ratings with a higher discounted cash flow and debt-to-equity score. Dayforce Inc. scores lower overall and has more moderate to very unfavorable scores across most categories.
Scores Comparison
The following table compares the Altman Z-Score and Piotroski Score for Figma, Inc. and Dayforce Inc:
FIG Scores
- Altman Z-Score: 14.34, indicating a safe zone status
- Piotroski Score: 4, categorized as average
DAY Scores
- Altman Z-Score: 1.24, indicating distress zone status
- Piotroski Score: 5, categorized as average
Which company has the best scores?
Based on the provided data, FIG has a significantly higher Altman Z-Score, placing it in the safe zone, while DAY’s score indicates financial distress. Both companies have average Piotroski Scores, with DAY slightly higher by one point.
Grades Comparison
Here is a comparison of the recent grades and ratings for Figma, Inc. and Dayforce Inc.:
Figma, Inc. Grades
The table below summarizes recent grades and recommendations from reputable grading firms for Figma, Inc.:
| Grading Company | Action | New Grade | Date |
|---|---|---|---|
| Morgan Stanley | Maintain | Equal Weight | 2026-01-15 |
| Wells Fargo | Upgrade | Overweight | 2026-01-08 |
| RBC Capital | Maintain | Sector Perform | 2026-01-05 |
| Goldman Sachs | Maintain | Neutral | 2025-11-07 |
| JP Morgan | Maintain | Neutral | 2025-11-06 |
| Piper Sandler | Maintain | Overweight | 2025-11-06 |
| Wells Fargo | Maintain | Equal Weight | 2025-11-05 |
| Wells Fargo | Maintain | Equal Weight | 2025-09-04 |
| Morgan Stanley | Maintain | Equal Weight | 2025-09-04 |
| RBC Capital | Maintain | Sector Perform | 2025-09-04 |
Overall, Figma’s grades show a consistent pattern of neutrality and moderate optimism, with multiple firms maintaining an Equal Weight or Sector Perform rating, and a recent upgrade to Overweight by Wells Fargo.
Dayforce Inc Grades
The table below summarizes recent grades and recommendations from reputable grading firms for Dayforce Inc:
| Grading Company | Action | New Grade | Date |
|---|---|---|---|
| Needham | Maintain | Hold | 2025-10-30 |
| Stifel | Downgrade | Hold | 2025-09-19 |
| Citigroup | Downgrade | Neutral | 2025-09-17 |
| Wells Fargo | Upgrade | Equal Weight | 2025-08-22 |
| BMO Capital | Downgrade | Market Perform | 2025-08-22 |
| Keybanc | Downgrade | Sector Weight | 2025-08-22 |
| Needham | Downgrade | Hold | 2025-08-22 |
| Barclays | Maintain | Equal Weight | 2025-08-22 |
| Deutsche Bank | Maintain | Hold | 2025-08-22 |
| Jefferies | Maintain | Hold | 2025-08-21 |
Dayforce’s grades reveal a clear downward trend with multiple downgrades from Buy or Outperform to Hold or Neutral, reflecting a cautious or less favorable outlook among analysts.
Which company has the best grades?
Figma, Inc. holds better grades overall, with more stable and slightly positive ratings including recent upgrades to Overweight, while Dayforce Inc. faces several downgrades. This difference indicates relatively stronger analyst confidence in Figma, which may influence investor sentiment and risk assessment.
Strengths and Weaknesses
Below is a comparison of key strengths and weaknesses of Figma, Inc. (FIG) and Dayforce Inc (DAY) based on the latest financial and strategic data.
| Criterion | Figma, Inc. (FIG) | Dayforce Inc (DAY) |
|---|---|---|
| Diversification | Limited product segmentation; mainly focused on design software | Diverse revenue streams including Cloud Dayforce and Powerpay recurring services plus professional services |
| Profitability | Negative net margin (-97.74%), ROIC -59.68%, shedding value significantly | Slightly positive net margin (1.03%), ROIC 1.31%, shedding value but improving profitability |
| Innovation | Struggles with profitability despite innovation; declining ROIC trend | Positive ROIC trend suggests improving innovation impact despite current losses |
| Global presence | Moderate global footprint; growth potential constrained by financial performance | Stronger global presence supported by recurring cloud services revenue of $1.5B+ |
| Market Share | Facing pressure with declining value creation; high P/B ratio indicates potential overvaluation | Market share growing with recurring revenue growth from $1.3B (2023) to $1.5B (2024) |
Key takeaways: Figma shows significant challenges in profitability and value creation with a steeply declining ROIC, posing high risk. Dayforce, while also currently unprofitable, demonstrates improving profitability and more diversified recurring revenue streams, making it a comparatively more stable candidate for investors seeking growth with cautious risk management.
Risk Analysis
Below is a comparative table of key risks for Figma, Inc. (FIG) and Dayforce Inc (DAY) based on the most recent 2024 data:
| Metric | Figma, Inc. (FIG) | Dayforce Inc (DAY) |
|---|---|---|
| Market Risk | High volatility with beta -3.8; stock range $29.48–$142.92 | Moderate volatility with beta 1.18; stock range $48.01–$75.14 |
| Debt level | Very low debt (D/E 0.02), debt to assets 1.6% | Moderate debt (D/E 0.48), debt to assets 13.5% |
| Regulatory Risk | Moderate, standard for US tech sector | Moderate, US and international HCM software exposure |
| Operational Risk | Negative profitability metrics: net margin -97.7%, ROE -55.3% | Low profitability: net margin 1.03%, ROE 0.71% |
| Environmental Risk | Low, typical for software application company | Low, typical for software application company |
| Geopolitical Risk | Moderate, US-based with global clients | Moderate, US-based with international operations |
The most impactful risks for these companies lie in their profitability and financial health. Figma shows very high operational risk with large negative margins and unfavorable returns, despite low debt, indicating cash burn and potential sustainability concerns. Dayforce has moderate debt and minimal profitability, coupled with an Altman Z-Score in the distress zone, signaling higher bankruptcy risk. Both companies face market volatility, with Figma’s beta indicating extreme price swings, increasing investment risk.
Which Stock to Choose?
Figma, Inc. (FIG) shows a strong revenue growth of 48% in 2024 but suffers from unfavorable profitability ratios with a net margin of -97.74% and declining ROIC well below WACC, indicating value destruction. Its financial ratios are mixed, with strengths in low debt and quick ratio but weaknesses in return metrics and interest coverage. The company holds a very favorable rating of C+ despite these challenges, supported by a safe-zone Altman Z-Score but only average Piotroski Score.
Dayforce Inc (DAY) exhibits moderate revenue growth of 16.27% and a favorable long-term income statement trend with improving net margin and ROIC growth, although ROIC remains slightly below WACC, signaling slight value erosion. Its financial ratios are largely unfavorable or neutral, with modest profitability and some leverage concerns. The rating is slightly lower at C-, combined with a distress zone Altman Z-Score and an average Piotroski Score, reflecting financial vulnerability.
For investors, FIG might appeal to those with a growth-focused profile willing to tolerate short-term profitability issues for revenue expansion, while DAY could be more suited for cautious investors who value improving profitability and gradual financial stability despite some risks. The choice may appear to depend on one’s tolerance for financial volatility versus preference for a company with a modest recovery trajectory.
Disclaimer: Investment carries a risk of loss of initial capital. The past performance is not a reliable indicator of future results. Be sure to understand risks before making an investment decision.
Go Further
I encourage you to read the complete analyses of Figma, Inc. and Dayforce Inc to enhance your investment decisions: