In today’s fast-evolving tech landscape, choosing the right software company to invest in demands careful analysis. Dayforce Inc and Elastic N.V. both operate in the software application sector but target distinct market needs—human capital management versus data search and analytics. Their innovative approaches and growing market presence make them compelling options. This article will help you decide which company offers the most promising investment opportunity in 2026.
Table of contents
Companies Overview
I will begin the comparison between Dayforce Inc and Elastic N.V. by providing an overview of these two companies and their main differences.
Dayforce Inc Overview
Dayforce Inc operates as a human capital management (HCM) software company, offering a cloud platform that integrates HR, payroll, benefits, workforce, and talent management. It serves markets in the US, Canada, and internationally, including solutions tailored for small businesses. Headquartered in Minneapolis, Dayforce focuses on delivering comprehensive HCM services through direct and third-party sales channels.
Elastic N.V. Overview
Elastic N.V. specializes in search technology solutions designed for multi-cloud environments, primarily through its Elastic Stack software suite. This includes tools for data ingestion, real-time search, analytics, visualization, and monitoring across various data types. Based in Mountain View, California, Elastic targets diverse use cases such as application search, logging, and performance management with a focus on scalable cloud software.
Key similarities and differences
Both companies operate in the software application industry and trade on the NYSE, focusing on cloud-based enterprise solutions. Dayforce emphasizes human capital management platforms to streamline workforce operations, whereas Elastic centers on search and analytics technologies for data management. Dayforce has a larger workforce and market cap, reflecting its broader service scope, while Elastic focuses on specialized search infrastructure and analytics tools.
Income Statement Comparison
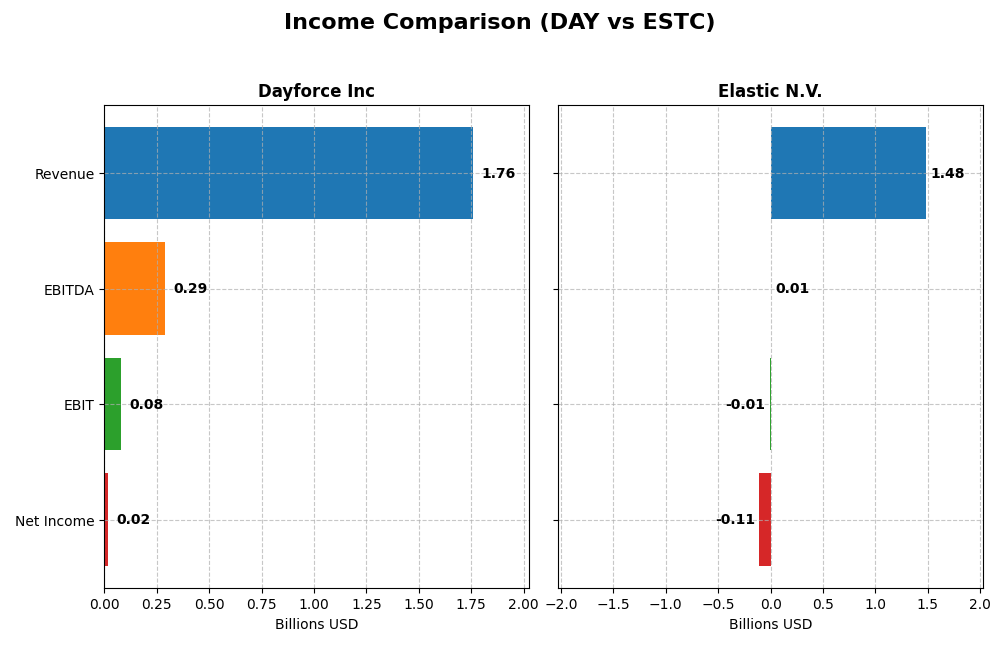
This table compares the most recent fiscal year income statement figures for Dayforce Inc and Elastic N.V., providing an overview of their financial performance.
| Metric | Dayforce Inc | Elastic N.V. |
|---|---|---|
| Market Cap | 11.1B USD | 7.5B USD |
| Revenue | 1.76B USD | 1.48B USD |
| EBITDA | 288M USD | 6.1M USD |
| EBIT | 78.2M USD | -6.3M USD |
| Net Income | 18.1M USD | -108.1M USD |
| EPS | 0.11 USD | -1.04 USD |
| Fiscal Year | 2024 | 2025 |
Income Statement Interpretations
Dayforce Inc
Dayforce Inc showed strong revenue growth of 16.27% in the latest year, continuing a positive trend over 2020-2024 with a 108.9% increase overall. Gross margin remained favorable at 46.14%, though EBIT margin was neutral at 4.44%. The 2024 net income fell sharply by 71.59%, signaling margin pressure despite revenue gains. Operating expenses grew in line with revenue, impacting profitability.
Elastic N.V.
Elastic N.V. reported favorable revenue growth of 17.04% in 2025, building on a 143.77% increase since 2021. Gross margin was strong at 74.39%, but EBIT margin stayed negative at -0.42%. Operating expenses grew proportionally with revenue, supporting margin stability. Net income dropped significantly with a -249.66% decline in net margin, reflecting ongoing profitability challenges despite top-line growth.
Which one has the stronger fundamentals?
Both companies posted favorable revenue growth and gross margins, but Dayforce maintained a positive net margin, albeit shrinking, while Elastic still operates at a net loss. Elastic’s higher gross margin contrasts with its negative EBIT and net margins, whereas Dayforce shows modest profitability. Elastic’s stronger revenue expansion is offset by persistent losses, suggesting Dayforce’s fundamentals are currently more stable.
Financial Ratios Comparison
The table below presents the most recent key financial ratios for Dayforce Inc and Elastic N.V., reflecting their fiscal year 2024 and 2025 data respectively.
| Ratios | Dayforce Inc (2024) | Elastic N.V. (2025) |
|---|---|---|
| ROE | 0.71% | -11.66% |
| ROIC | 1.31% | -3.45% |
| P/E | 633.3 | -82.7 |
| P/B | 4.50 | 9.64 |
| Current Ratio | 1.13 | 1.92 |
| Quick Ratio | 1.13 | 1.92 |
| D/E | 0.48 | 0.64 |
| Debt-to-Assets | 13.5% | 22.9% |
| Interest Coverage | 2.56 | -2.17 |
| Asset Turnover | 0.19 | 0.57 |
| Fixed Asset Turnover | 7.46 | 51.28 |
| Payout Ratio | 0 | 0 |
| Dividend Yield | 0 | 0 |
Interpretation of the Ratios
Dayforce Inc
Dayforce Inc shows a mixed ratio profile with more unfavorable indicators, including low net margin (1.03%) and return on equity (0.71%), suggesting weak profitability and efficiency. However, its quick ratio (1.13) and debt-to-equity (0.48) ratios are favorable, indicating reasonable liquidity and manageable leverage. The company does not pay dividends, likely focusing on reinvestment or growth.
Elastic N.V.
Elastic N.V. presents a more balanced ratio picture with an equal share of favorable and unfavorable metrics. Its current and quick ratios are strong at 1.92, supporting liquidity, but negative net margin (-7.29%) and return on equity (-11.66%) highlight profitability challenges. Elastic also does not pay dividends, possibly prioritizing growth and R&D investments over shareholder payouts.
Which one has the best ratios?
Elastic N.V. holds a relatively better ratio stance, with a more favorable liquidity position and a neutral overall evaluation versus Dayforce’s predominantly unfavorable profitability and efficiency ratios. However, both companies face profitability pressures and do not distribute dividends, reflecting cautious financial health and growth-focused strategies.
Strategic Positioning
This section compares the strategic positioning of Dayforce Inc and Elastic N.V., focusing on Market position, Key segments, and exposure to technological disruption:
Dayforce Inc
- Leading HCM software provider with strong market presence and moderate competitive pressure.
- Focuses on cloud-based human capital management and payroll software serving global markets.
- Operates in a mature software market with cloud adoption, facing gradual technology shifts.
Elastic N.V.
- Specialized search technology firm with solid market niche and competitive challenges.
- Concentrates on Elastic Stack software for data ingestion, search, and analytics in multi-cloud environments.
- Exposed to rapid innovation in cloud and data analytics technology, requiring continuous adaptation.
Dayforce Inc vs Elastic N.V. Positioning
Dayforce pursues a diversified business model with multiple cloud HCM services, offering broader revenue streams. Elastic concentrates on a specialized software stack, focusing on search and analytics, which may limit diversification but enhances domain expertise.
Which has the best competitive advantage?
Both companies are slightly unfavorable in MOAT evaluation, shedding value but showing growing profitability. Neither demonstrates a clear competitive moat advantage based on ROIC versus WACC data provided.
Stock Comparison
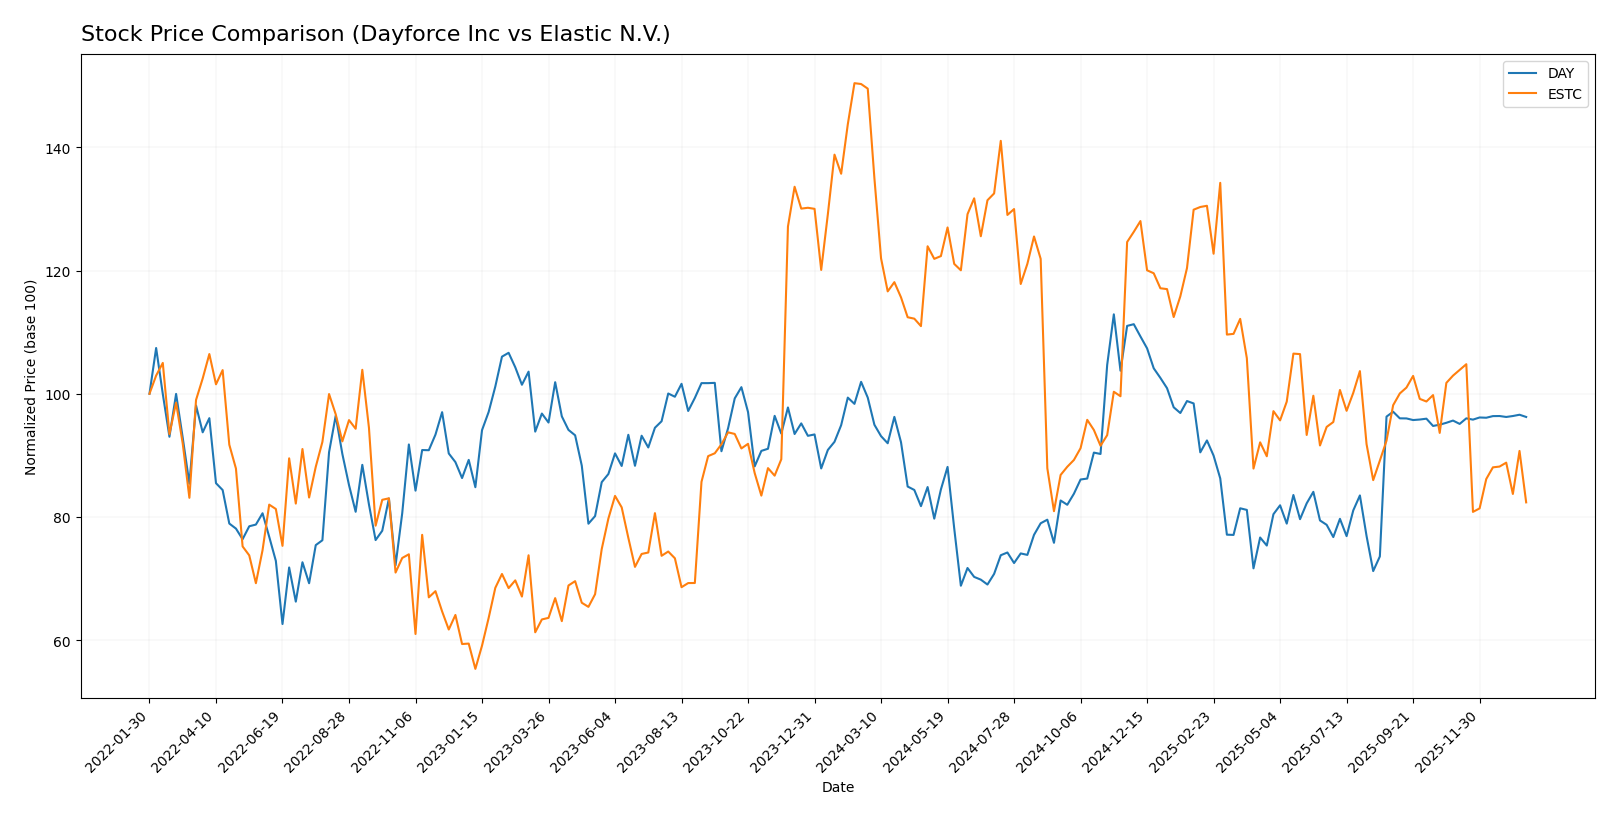
The stock price movements of Dayforce Inc (DAY) and Elastic N.V. (ESTC) over the past 12 months reveal distinct bearish trends with varying degrees of decline and trading volume dynamics.
Trend Analysis
Dayforce Inc experienced a bearish trend with a -3.16% price change over the past year, showing deceleration and a high volatility of 7.84. The stock ranged from a low of 49.46 to a high of 81.14, with a recent slight bullish shift of +0.61%.
Elastic N.V. showed a stronger bearish trend with a -44.93% price drop over the same period, accompanied by deceleration and higher volatility at 14.08. Prices fluctuated between 70.04 and 129.62, while recent performance deteriorated further by -20.0%.
Comparing both, Dayforce Inc delivered the highest market performance with a much smaller decline and a recent upward correction, unlike Elastic N.V.’s steep and accelerating downward trend.
Target Prices
The current analyst consensus for target prices shows clear expectations for both Dayforce Inc and Elastic N.V.
| Company | Target High | Target Low | Consensus |
|---|---|---|---|
| Dayforce Inc | 70 | 70 | 70 |
| Elastic N.V. | 134 | 76 | 108 |
Analysts see Dayforce trading near its current price of $69.16, while Elastic’s consensus target of $108 suggests significant upside from its current $71.38.
Analyst Opinions Comparison
This section compares analysts’ ratings and grades for Dayforce Inc and Elastic N.V.:
Rating Comparison
Dayforce Inc Rating
- Rating: C-, considered very favorable by analysts.
- Discounted Cash Flow Score: 2, moderate valuation.
- ROE Score: 1, very unfavorable return on equity.
- ROA Score: 1, very unfavorable asset utilization.
- Debt To Equity Score: 2, moderate financial risk.
- Overall Score: 1, very unfavorable overall score.
Elastic N.V. Rating
- Rating: C-, considered very favorable by analysts.
- Discounted Cash Flow Score: 3, moderate valuation.
- ROE Score: 1, very unfavorable return on equity.
- ROA Score: 1, very unfavorable asset utilization.
- Debt To Equity Score: 1, very unfavorable financial risk.
- Overall Score: 1, very unfavorable overall score.
Which one is the best rated?
Both companies share the same overall rating of C- and an overall score of 1, indicating very unfavorable financial standing. Elastic N.V. has a slightly higher discounted cash flow score, but Dayforce shows a more moderate debt-to-equity score.
Scores Comparison
The comparison of Dayforce Inc and Elastic N.V. scores is as follows:
Dayforce Inc Scores
- Altman Z-Score: 1.24, indicating financial distress
- Piotroski Score: 5, reflecting average financial strength
Elastic N.V. Scores
- Altman Z-Score: 3.51, indicating a safe financial zone
- Piotroski Score: 4, reflecting average financial strength
Which company has the best scores?
Elastic N.V. has a higher Altman Z-Score of 3.51, placing it in the safe zone, while Dayforce Inc is in financial distress with 1.24. Both have similar average Piotroski Scores, with Dayforce slightly higher at 5 versus 4.
Grades Comparison
Here is a comparison of the latest reliable grades from recognized grading companies for Dayforce Inc and Elastic N.V.:
Dayforce Inc Grades
The following table shows recent analyst grades for Dayforce Inc from major firms:
| Grading Company | Action | New Grade | Date |
|---|---|---|---|
| Needham | Maintain | Hold | 2025-10-30 |
| Stifel | Downgrade | Hold | 2025-09-19 |
| Citigroup | Downgrade | Neutral | 2025-09-17 |
| Wells Fargo | Upgrade | Equal Weight | 2025-08-22 |
| BMO Capital | Downgrade | Market Perform | 2025-08-22 |
| Keybanc | Downgrade | Sector Weight | 2025-08-22 |
| Needham | Downgrade | Hold | 2025-08-22 |
| Barclays | Maintain | Equal Weight | 2025-08-22 |
| Deutsche Bank | Maintain | Hold | 2025-08-22 |
| Jefferies | Maintain | Hold | 2025-08-21 |
Overall, Dayforce’s grades show a pattern of downgrades and cautious stances, mostly holding at neutral or hold ratings.
Elastic N.V. Grades
The following table summarizes recent analyst grades for Elastic N.V. from reputable firms:
| Grading Company | Action | New Grade | Date |
|---|---|---|---|
| Barclays | Maintain | Overweight | 2026-01-12 |
| RBC Capital | Maintain | Outperform | 2026-01-05 |
| Jefferies | Maintain | Buy | 2026-01-05 |
| Citigroup | Maintain | Buy | 2025-11-24 |
| Wedbush | Maintain | Outperform | 2025-11-21 |
| B of A Securities | Maintain | Neutral | 2025-11-21 |
| Guggenheim | Maintain | Buy | 2025-11-21 |
| Wells Fargo | Maintain | Equal Weight | 2025-11-21 |
| RBC Capital | Maintain | Outperform | 2025-11-21 |
| Canaccord Genuity | Maintain | Buy | 2025-11-21 |
Elastic N.V. displays consistently positive ratings, with multiple buy and outperform recommendations.
Which company has the best grades?
Elastic N.V. holds significantly stronger analyst grades compared to Dayforce Inc, with numerous buy and outperform ratings versus Dayforce’s predominantly hold and neutral grades. This contrast could influence investor sentiment, reflecting higher confidence in Elastic’s prospects.
Strengths and Weaknesses
Below is a comparative overview of the strengths and weaknesses of Dayforce Inc and Elastic N.V. based on recent financial and operational data.
| Criterion | Dayforce Inc (DAY) | Elastic N.V. (ESTC) |
|---|---|---|
| Diversification | Moderate: Focused on cloud-based HR and payroll services with some professional services. | Moderate: Primarily subscription-based software with growing professional services. |
| Profitability | Low profitability: ROIC at 1.31%, net margin 1.03%, overall unfavorable profitability metrics. | Negative profitability: ROIC -3.45%, net margin -7.29%, reflecting ongoing value shedding. |
| Innovation | Steady innovation in cloud services; growing ROIC trend suggests improving efficiency. | Strong innovation in search and data analytics platforms; ROIC improving but still negative. |
| Global presence | Established global presence in HR and payroll solutions markets. | Global SaaS provider with expanding international footprint. |
| Market Share | Solid foothold in cloud HR/payroll with recurring revenues at $1.52B in 2024. | Rapidly growing subscription base, revenues reaching $1.38B in 2025, increasing market share. |
Key takeaways: Both companies are slightly unfavorable in terms of value creation but show improving profitability trends. Dayforce benefits from stable recurring revenues, while Elastic’s innovation and subscription growth position it well for future gains despite current losses. Investors should weigh growth potential against ongoing profitability challenges.
Risk Analysis
Below is a comparative table highlighting key risk metrics for Dayforce Inc and Elastic N.V. based on the most recent data available.
| Metric | Dayforce Inc (DAY) | Elastic N.V. (ESTC) |
|---|---|---|
| Market Risk | Beta 1.18 – Moderate risk | Beta 0.93 – Lower volatility |
| Debt level | Debt/Equity 0.48 – Favorable | Debt/Equity 0.64 – Neutral |
| Regulatory Risk | Moderate – US technology sector regulation | Moderate – US and international compliance |
| Operational Risk | Moderate – Large workforce (9,600 employees) | Moderate – Smaller scale (3,400 employees) |
| Environmental Risk | Low – Software industry, limited exposure | Low – Software industry, limited exposure |
| Geopolitical Risk | Moderate – US-based with international operations | Moderate – US-based with global cloud services |
The most significant risks include Dayforce’s elevated market beta indicating higher sensitivity to market swings and its financial distress signals (Altman Z-score in distress zone), which suggest potential solvency concerns. Elastic shows a safer financial position (Altman Z-score in safe zone) but struggles with profitability and operational efficiency, which could impact long-term stability. Both face ongoing regulatory and geopolitical uncertainties typical in the tech sector.
Which Stock to Choose?
Dayforce Inc (DAY) shows a favorable income statement with a 16.3% revenue growth in the last year and a strong 109% growth over five years. However, its financial ratios are mostly unfavorable, reflecting low profitability and moderate debt, while its rating is very favorable despite weak overall scores.
Elastic N.V. (ESTC) also exhibits a favorable income statement with a 17% revenue increase last year and 144% over the period, though profitability remains negative. Financial ratios are neutral with several favorable liquidity metrics, yet its rating is very favorable but with low scores on profitability and valuation.
Considering ratings and income evaluations, DAY might appear more attractive for investors seeking improving profitability and value creation trends, while ESTC could appeal to those prioritizing liquidity and growth potential despite current losses; risk tolerance and investment strategy will likely influence the interpretation.
Disclaimer: Investment carries a risk of loss of initial capital. The past performance is not a reliable indicator of future results. Be sure to understand risks before making an investment decision.
Go Further
I encourage you to read the complete analyses of Dayforce Inc and Elastic N.V. to enhance your investment decisions: