Home > Comparison > Healthcare > HCA vs DVA
The strategic rivalry between HCA Healthcare, Inc. and DaVita Inc. shapes the healthcare sector’s competitive landscape. HCA operates a vast network of general and acute care hospitals, emphasizing broad inpatient and outpatient services. In contrast, DaVita specializes in kidney dialysis, focusing on outpatient centers with integrated care models. This analysis explores which operational approach delivers superior risk-adjusted returns, guiding investors seeking resilience and growth in healthcare portfolios.
Table of contents
Companies Overview
HCA Healthcare and DaVita Inc. stand as pivotal players in the US healthcare services market.
HCA Healthcare, Inc.: Comprehensive Hospital Network Leader
HCA Healthcare dominates the general and acute care hospital sector. It generates revenue through inpatient, outpatient, and specialty services across 182 hospitals and numerous freestanding centers. In 2021, HCA prioritized expanding its hospital footprint and enhancing outpatient care to capture diverse patient needs and improve operational efficiency.
DaVita Inc.: Kidney Care Specialist
DaVita Inc. focuses on kidney dialysis and related services. Its revenue stems from operating 3,154 dialysis centers globally and delivering outpatient, inpatient, and home hemodialysis. In 2021, DaVita emphasized integrated, risk-based care models to enhance patient outcomes and streamline chronic kidney disease management.
Strategic Collision: Similarities & Divergences
Both companies operate within healthcare facilities but contrast in scope: HCA runs a broad hospital network, while DaVita specializes in kidney care. They compete primarily in outpatient services, targeting chronic care management. Their investment profiles diverge; HCA offers broad healthcare exposure with scale advantages, whereas DaVita presents a niche focus with specialized clinical expertise.
Income Statement Comparison
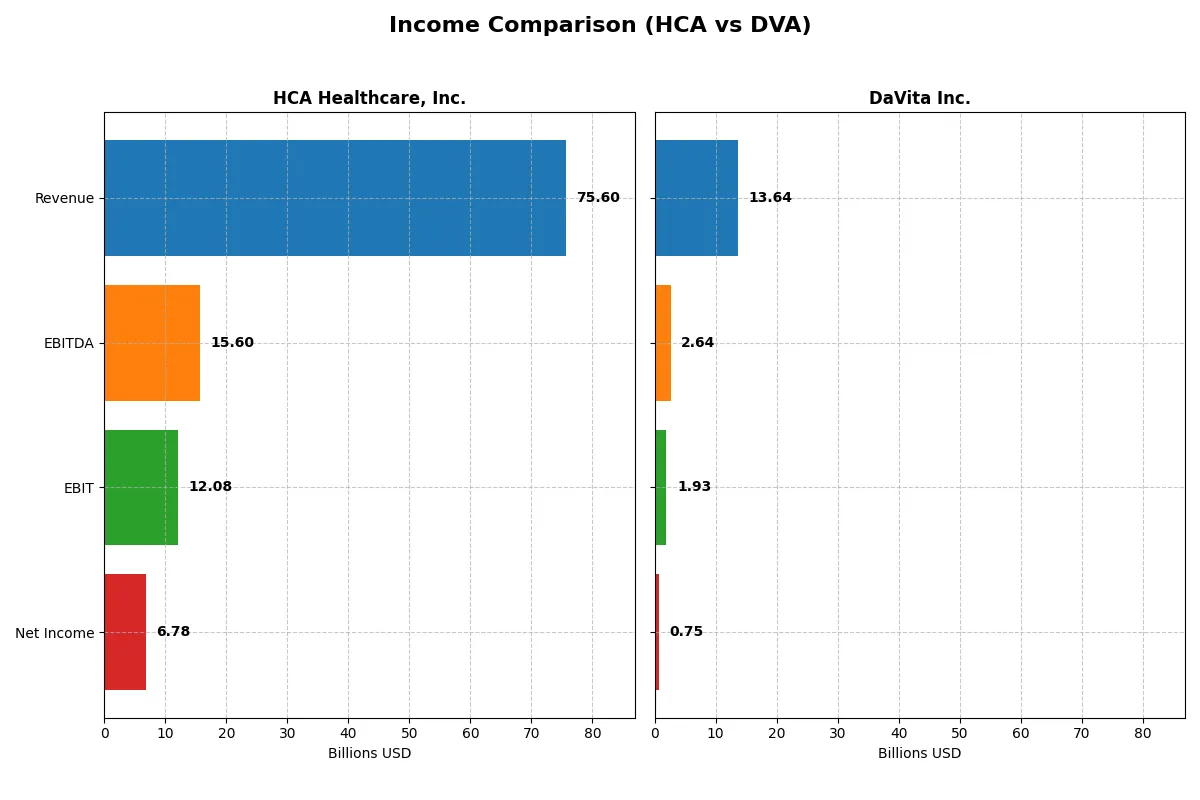
The following data dissects the core profitability and scalability of both corporate engines to reveal who dominates the bottom line:
| Metric | HCA Healthcare, Inc. (HCA) | DaVita Inc. (DVA) |
|---|---|---|
| Revenue | 75.6B | 13.6B |
| Cost of Revenue | 44.2B | 10.0B |
| Operating Expenses | 19.4B | 1.67B |
| Gross Profit | 31.4B | 3.68B |
| EBITDA | 15.6B | 2.64B |
| EBIT | 12.1B | 1.93B |
| Interest Expense | 2.25B | 550M |
| Net Income | 6.78B | 722M |
| EPS | 28.62 | 10.06 |
| Fiscal Year | 2025 | 2025 |
Income Statement Analysis: The Bottom-Line Duel
The following income statement comparison reveals the true operational efficiency and profitability trends of these two healthcare giants.
HCA Healthcare, Inc. Analysis
HCA’s revenue rose steadily from 59B in 2021 to 75.6B in 2025, showing solid top-line growth. Net income fluctuated but reached 6.78B in 2025, supported by a favorable gross margin of 41.5%. The net margin improved to 8.97%, reflecting efficient cost control and strong recent momentum in profitability and earnings per share growth.
DaVita Inc. Analysis
DaVita’s revenue grew moderately from 11.6B in 2021 to 13.6B in 2025, while net income declined to 722M, pressured by shrinking gross profit and net margin at 5.47%. Despite a stable operating expense ratio, earnings and margins contracted in the latest year, indicating challenges in sustaining profitability momentum.
Margin Strength vs. Revenue Expansion
HCA outpaces DaVita with superior margins and stronger net income growth despite similar revenue growth rates. HCA’s efficient cost management and higher profitability make it the clear fundamental winner. Investors seeking robust margin profiles and earnings growth may find HCA’s profile more attractive.
Financial Ratios Comparison
These vital ratios act as a diagnostic tool to expose the underlying fiscal health, valuation premiums, and capital efficiency of the companies compared below:
| Ratios | HCA Healthcare, Inc. (HCA) | DaVita Inc. (DVA) |
|---|---|---|
| ROE | -1.13% | -1.15% |
| ROIC | 18.53% | 10.58% |
| P/E | 15.88 | 13.10 |
| P/B | -17.87 | -15.02 |
| Current Ratio | 0.83 | 1.29 |
| Quick Ratio | 0.73 | 1.24 |
| D/E | -8.33 | -23.12 |
| Debt-to-Assets | 82.67% | 86.10% |
| Interest Coverage | 5.32 | 3.66 |
| Asset Turnover | 1.25 | 0.78 |
| Fixed Asset Turnover | 2.43 | 2.62 |
| Payout Ratio | 10.01% | 0% |
| Dividend Yield | 0.63% | 0% |
| Fiscal Year | 2025 | 2025 |
Efficiency & Valuation Duel: The Vital Signs
Financial ratios act as the company’s DNA, uncovering hidden risks and revealing operational excellence critical for investment decisions.
HCA Healthcare, Inc.
HCA shows solid operational efficiency with a favorable 18.5% ROIC, yet a deeply negative ROE flags shareholder returns as unfavorable. The stock trades at a neutral P/E of 15.9, reflecting fair valuation. Minimal dividends yield 0.63%, suggesting reinvestment focuses on capital and asset efficiency rather than direct payouts.
DaVita Inc.
DaVita posts a moderate 10.6% ROIC and a neutral 5.5% net margin, with a slightly favorable P/E of 13.1 signaling an attractive valuation. Despite a negative ROE, the company maintains better liquidity and a zero dividend yield, hinting at growth-driven reinvestment rather than cash returns to shareholders.
Balanced Operational Efficiency vs. Valuation Appeal
HCA excels in operational returns but struggles with shareholder equity and liquidity, while DaVita offers a more favorable valuation and liquidity profile. Investors prioritizing risk management may prefer DaVita’s steadier footing, whereas those focused on operational strength might lean toward HCA’s efficiency despite its risks.
Which one offers the Superior Shareholder Reward?
I observe that HCA Healthcare pays a modest dividend yield near 0.63% with a low payout ratio around 10%, supporting sustainability through strong free cash flow coverage above 60%. HCA also executes aggressive buybacks, enhancing total shareholder return. DaVita, by contrast, pays no dividend but reinvests heavily in growth and maintains a robust free cash flow conversion near 70%. Its buyback program is consistent but less pronounced than HCA’s. Historically, HCA’s balanced distribution of dividends and buybacks offers steadier, more sustainable returns versus DaVita’s growth-focused, no-dividend model. In 2026, I favor HCA for superior total shareholder reward, blending income and capital appreciation with prudent capital allocation.
Comparative Score Analysis: The Strategic Profile
The radar chart reveals the fundamental DNA and trade-offs of HCA Healthcare, Inc. and DaVita Inc., highlighting their financial strengths and vulnerabilities:
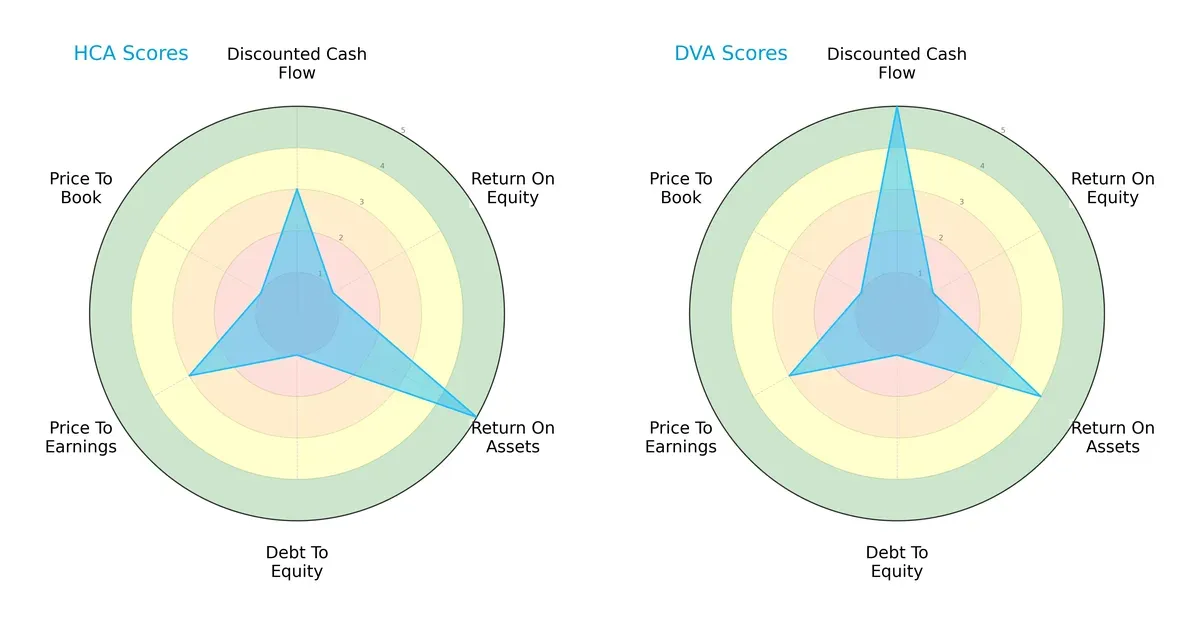
HCA shows a very favorable ROA (5) but struggles with ROE (1) and debt-to-equity (1), reflecting asset efficiency but high leverage. DaVita excels in discounted cash flow (5) and maintains a balanced ROA (4). DaVita’s profile is more balanced, leveraging strong cash flow, while HCA relies heavily on asset utilization amid debt concerns.
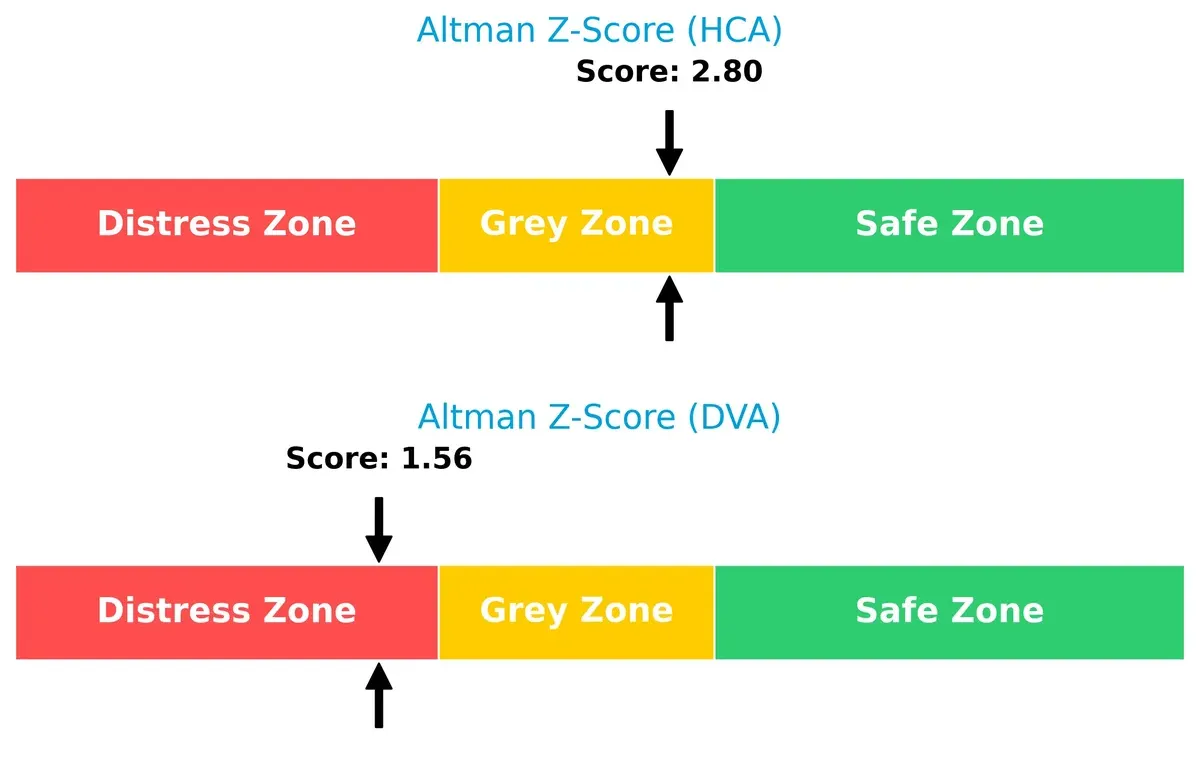
Bankruptcy Risk: Solvency Showdown
HCA’s Altman Z-Score of 2.80 places it in the grey zone, indicating moderate bankruptcy risk. DaVita scores 1.56, in the distress zone, signaling significant solvency concerns in this cycle:
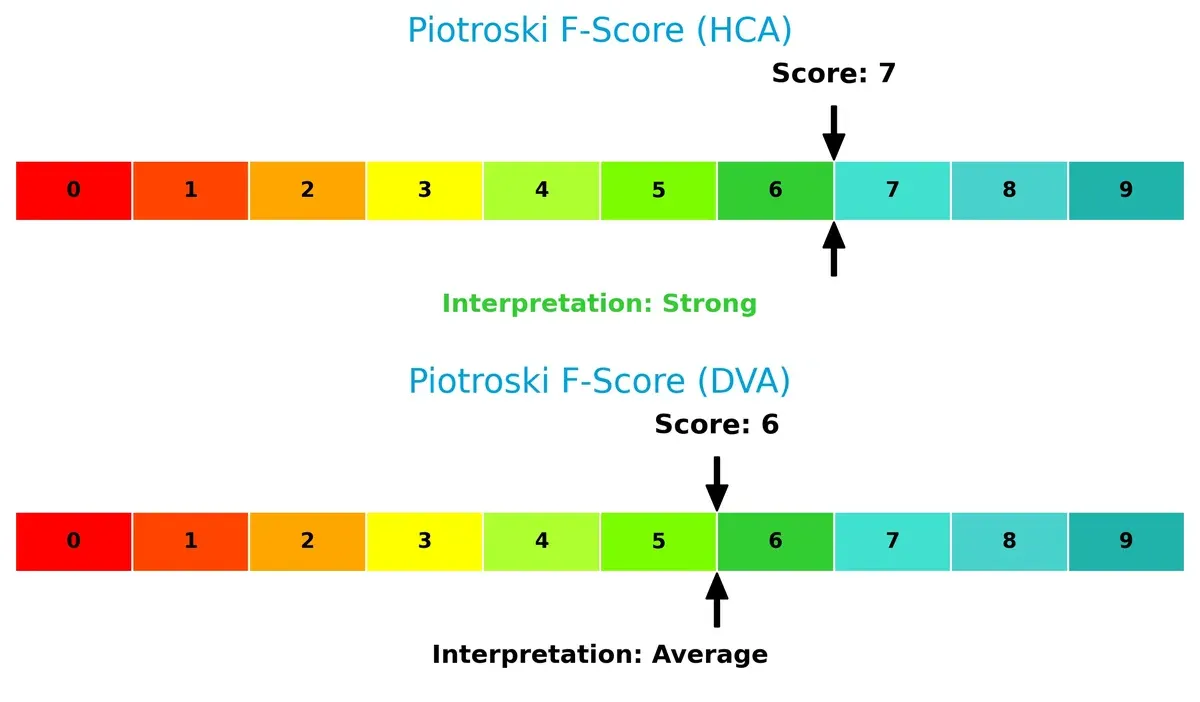
Financial Health: Quality of Operations
HCA’s Piotroski F-Score of 7 signals strong financial health, outperforming DaVita’s average score of 6. HCA demonstrates better internal operational quality and fewer red flags:
How are the two companies positioned?
This section dissects HCA and DVA’s operational DNA by comparing their revenue distribution and internal strengths and weaknesses. The goal is to confront their economic moats and identify which model delivers a more resilient, sustainable advantage today.
Revenue Segmentation: The Strategic Mix
The following visual comparison dissects how HCA Healthcare, Inc. and DaVita Inc. diversify their income streams and reveals their primary sector bets:
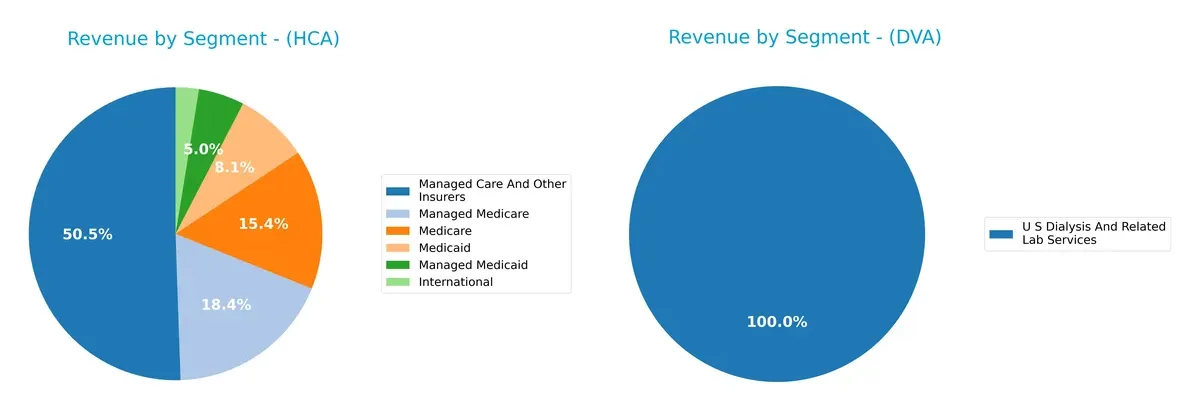
HCA Healthcare anchors revenue in “Managed Care And Other Insurers” with $37B in 2025, complemented by Medicare and Medicaid segments, showing a diversified payer mix. In contrast, DaVita relies heavily on a single segment: “U S Dialysis And Related Lab Services” at $11.7B, with minimal contribution from “Other Segments.” HCA’s mix reduces concentration risk, while DaVita’s focus signals infrastructure dominance but raises vulnerability to sector-specific shifts.
Strengths and Weaknesses Comparison
This table compares the strengths and weaknesses of HCA Healthcare, Inc. and DaVita Inc. based on diversification, profitability, financial statements, innovation, global presence, and market share:
HCA Strengths
- Diversified revenue across multiple payer segments
- Favorable ROIC above WACC indicates efficient capital allocation
- Strong asset turnover shows effective use of assets
- Favorable interest coverage ratio supports debt servicing
- Global presence with international and multiple geographic groups
DVA Strengths
- Favorable ROIC and WACC suggest efficient capital usage
- Strong price-to-earnings and price-to-book ratios
- Higher current and quick ratios indicate better short-term liquidity
- Favorable debt-to-equity ratio supports financial stability
- Focused market presence with U.S. dialysis services
HCA Weaknesses
- Negative ROE signals poor return on equity
- Low current and quick ratios raise liquidity concerns
- High debt-to-assets ratio implies heavy leverage
- Negative dividend yield limits income investors
- Neutral to unfavorable net margin impacts profitability
DVA Weaknesses
- Negative ROE reflects poor shareholder returns
- High debt-to-assets ratio indicates significant leverage
- Zero dividend yield may deter income-focused investors
- Neutral net margin and asset turnover limit profitability signals
HCA shows strength in diversification and operational efficiency but faces liquidity and leverage challenges. DVA presents better liquidity and valuation metrics but is concentrated in a single segment and carries leverage risks. Both companies must carefully manage financial structure and profitability to enhance long-term resilience.
The Moat Duel: Analyzing Competitive Defensibility
A structural moat is the only shield protecting long-term profits from relentless competition erosion. Let’s dissect the moats of HCA Healthcare and DaVita Inc.:
HCA Healthcare, Inc.: Scale-Driven Cost Advantage
HCA leverages its vast hospital network to achieve cost efficiencies and margin stability. Its ROIC exceeds WACC by 10.5%, signaling value creation. Expansion into outpatient services may deepen this moat in 2026.
DaVita Inc.: Specialized Network Effects
DaVita’s moat stems from its integrated dialysis network and clinical services, creating high switching costs for patients and providers. ROIC outpaces WACC by 5.5%, with a strong upward ROIC trend supporting sustainable growth and margin improvement opportunities.
Verdict: Scale Cost Advantage vs. Specialized Network Effects
HCA’s broader scale yields a deeper moat in absolute ROIC terms, but DaVita’s rapidly growing ROIC signals a more sustainable, focused competitive edge. I see DaVita better positioned to defend and expand its niche market share in the evolving healthcare landscape.
Which stock offers better returns?
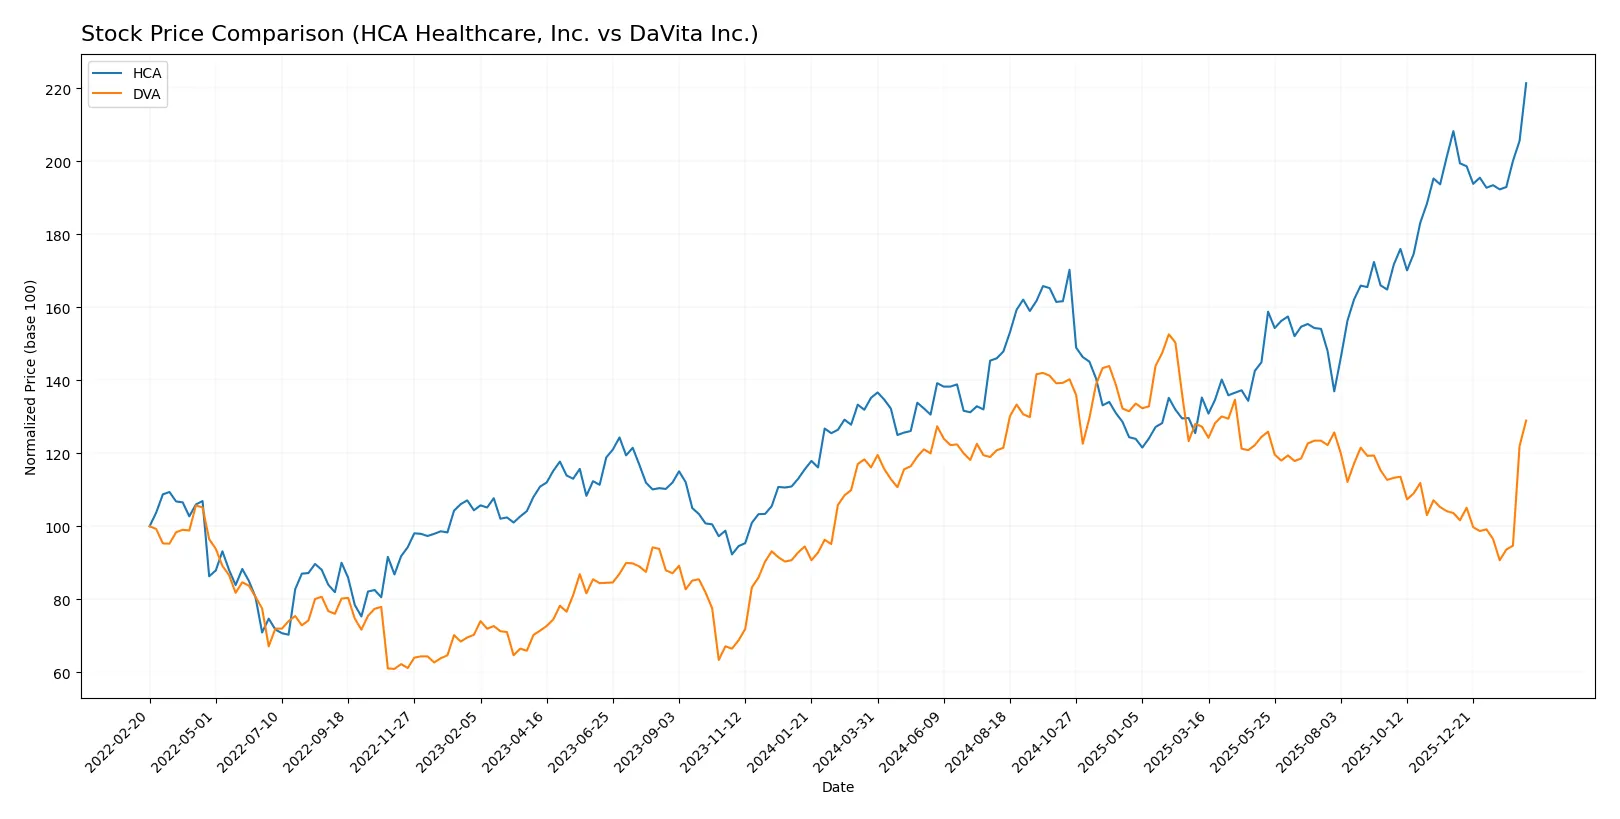
The past year saw notable price surges for both HCA Healthcare, Inc. and DaVita Inc., with HCA showing strong acceleration and higher volatility compared to DaVita’s steadier climb.
Trend Comparison
HCA Healthcare, Inc. gained 63.75% over the past 12 months, reflecting a bullish trend with accelerating momentum. Price volatility is high, with a standard deviation of 59.05, hitting a peak of 540.29.
DaVita Inc. rose 11.07% in the same period, also bullish with acceleration. Its price volatility is moderate at 14.89 standard deviation, reaching a high of 176.2.
HCA outperformed DaVita significantly over the year, delivering superior market returns despite higher volatility.
Target Prices
Analysts present a moderately bullish consensus on HCA Healthcare and DaVita Inc.
| Company | Target Low | Target High | Consensus |
|---|---|---|---|
| HCA Healthcare, Inc. | 425 | 598 | 521.08 |
| DaVita Inc. | 158 | 190 | 168.67 |
HCA’s target consensus sits slightly below its current price of 540.29, indicating cautious optimism. DaVita’s consensus of 168.67 implies a solid upside from its 148.95 market price.

Don’t Let Luck Decide Your Entry Point
Optimize your entry points with our advanced ProRealTime indicators. You’ll get efficient buy signals with precise price targets for maximum performance. Start outperforming now!
How do institutions grade them?
The following tables summarize the latest institutional grades for HCA Healthcare, Inc. and DaVita Inc.:
HCA Healthcare, Inc. Grades
The table below shows recent grades from reputable financial institutions for HCA Healthcare, Inc.
| Grading Company | Action | New Grade | Date |
|---|---|---|---|
| Argus Research | Maintain | Buy | 2026-02-06 |
| Wells Fargo | Maintain | Equal Weight | 2026-01-30 |
| Jefferies | Maintain | Buy | 2026-01-28 |
| Keybanc | Maintain | Overweight | 2026-01-28 |
| Truist Securities | Maintain | Buy | 2026-01-28 |
| Barclays | Maintain | Overweight | 2026-01-28 |
| Deutsche Bank | Maintain | Buy | 2026-01-28 |
| Oppenheimer | Maintain | Outperform | 2026-01-28 |
| UBS | Maintain | Buy | 2026-01-28 |
| Cantor Fitzgerald | Maintain | Overweight | 2026-01-28 |
DaVita Inc. Grades
The table below presents recent grades from verified grading firms for DaVita Inc.
| Grading Company | Action | New Grade | Date |
|---|---|---|---|
| UBS | Maintain | Buy | 2026-02-04 |
| Barclays | Maintain | Equal Weight | 2026-02-03 |
| TD Cowen | Maintain | Hold | 2025-11-03 |
| Barclays | Maintain | Equal Weight | 2025-10-30 |
| Barclays | Maintain | Equal Weight | 2025-10-09 |
| B of A Securities | Maintain | Underperform | 2025-09-10 |
| Barclays | Maintain | Equal Weight | 2025-08-07 |
| Truist Securities | Maintain | Hold | 2025-05-19 |
| Barclays | Maintain | Equal Weight | 2025-02-18 |
| Barclays | Maintain | Equal Weight | 2024-10-31 |
Which company has the best grades?
HCA Healthcare, Inc. consistently earns Buy and Overweight ratings, signaling stronger institutional confidence. DaVita Inc. shows a mixed pattern, with multiple Equal Weight and Hold ratings. Investors may interpret HCA’s superior grades as a sign of better market positioning and potential upside.
Risks specific to each company
The following categories identify the critical pressure points and systemic threats facing both firms in the 2026 market environment:
1. Market & Competition
HCA Healthcare, Inc.
- Operates a broad hospital network facing intense healthcare sector competition and evolving patient care demands.
DaVita Inc.
- Focused on kidney dialysis services with niche specialization but exposed to competition from emerging renal care providers.
2. Capital Structure & Debt
HCA Healthcare, Inc.
- High debt-to-assets at 82.7% signals financial leverage risks despite solid interest coverage of 5.37x.
DaVita Inc.
- Debt-to-assets even higher at 86.1%, with moderate interest coverage of 3.51x, suggesting tighter debt servicing capacity.
3. Stock Volatility
HCA Healthcare, Inc.
- Beta of 1.37 indicates above-market volatility, heightening risk during market downturns.
DaVita Inc.
- Beta near 1.01 implies stock moves roughly in line with the market, showing moderate volatility.
4. Regulatory & Legal
HCA Healthcare, Inc.
- Subject to broad healthcare regulations with risk from policy shifts impacting hospital reimbursement rates.
DaVita Inc.
- Dialysis-centric regulatory environment with scrutiny on quality standards and reimbursement policies poses ongoing challenges.
5. Supply Chain & Operations
HCA Healthcare, Inc.
- Complex hospital operations require resilient supply chains; disruptions can affect service delivery and costs.
DaVita Inc.
- Reliance on specialized medical supplies for dialysis increases vulnerability to supply chain interruptions.
6. ESG & Climate Transition
HCA Healthcare, Inc.
- ESG risks include managing hospital energy use and waste, with pressure to invest in sustainable infrastructure.
DaVita Inc.
- Faces pressure to reduce environmental impact of dialysis equipment and clinical waste disposal.
7. Geopolitical Exposure
HCA Healthcare, Inc.
- Primarily US-focused with minor England exposure, limiting geopolitical risk but sensitive to domestic policy changes.
DaVita Inc.
- Operates in 10 countries outside the US; geopolitical instability in those regions could disrupt operations.
Which company shows a better risk-adjusted profile?
HCA’s most impactful risk is its aggressive leverage, risking financial stress despite strong operational cash flow. DaVita’s critical risk lies in its weaker bankruptcy risk profile and high debt level amid international geopolitical exposure. Overall, DaVita shows a slightly better risk-adjusted profile, backed by a more favorable ratio mix and moderate stock volatility. However, its Altman Z-Score in the distress zone signals caution. HCA’s grey zone Z-Score and stronger interest coverage suggest more resilience if leverage is managed prudently.
Final Verdict: Which stock to choose?
HCA Healthcare’s superpower lies in its robust capital efficiency, generating returns well above its cost of capital. It consistently turns invested capital into value, signaling a strong competitive position. A point of vigilance is its stretched liquidity, which could pressure short-term flexibility. It suits aggressive growth portfolios ready to navigate operational risks.
DaVita stands out with a sustainable moat driven by a growing ROIC and disciplined capital allocation. Its balance sheet shows better liquidity and a safer profile than HCA, providing a cushion in volatile markets. It fits well in GARP portfolios that seek growth tempered with financial prudence.
If you prioritize capital efficiency and are comfortable with tighter liquidity, HCA’s value creation and operational momentum make it a compelling choice. However, if you seek a more stable balance sheet and a steadily improving profitability trend, DaVita offers better stability and a clearer path of sustainable growth. Both present distinct analytical scenarios for different investor risk appetites and strategic goals.
Disclaimer: Investment carries a risk of loss of initial capital. The past performance is not a reliable indicator of future results. Be sure to understand risks before making an investment decision.
Go Further
I encourage you to read the complete analyses of HCA Healthcare, Inc. and DaVita Inc. to enhance your investment decisions: