Workday, Inc. and Datadog, Inc. are two prominent players in the software application industry, each driving innovation in enterprise cloud solutions. Workday specializes in financial and human capital management applications, while Datadog focuses on cloud infrastructure monitoring and analytics. Their overlapping markets and distinct innovation strategies make this comparison crucial. In this article, I will help you determine which company offers the most compelling investment opportunity in 2026.
Table of contents
Companies Overview
I will begin the comparison between Workday, Inc. and Datadog, Inc. by providing an overview of these two companies and their main differences.
Workday Overview
Workday, Inc. provides enterprise cloud applications globally, focusing on financial management, human capital management, planning, and analytics. Its mission centers on helping organizations manage business operations through integrated cloud solutions. Workday serves diverse sectors including finance, healthcare, education, and retail, positioning itself as a comprehensive software provider for enterprise resource planning and workforce management.
Datadog Overview
Datadog, Inc. delivers a SaaS monitoring and analytics platform designed for developers, IT operations, and business users worldwide. The company emphasizes real-time observability of technology stacks via integrated infrastructure, application performance, log, and security monitoring. Headquartered in New York, Datadog targets cloud-native environments with tools for user experience, network, and cloud security monitoring.
Key similarities and differences
Both Workday and Datadog operate in the software application industry with cloud-based solutions, targeting enterprise clients. Workday’s model is broader, focusing on financial and human capital management, while Datadog specializes in IT monitoring and observability services. Workday has a larger workforce and market cap, reflecting a more established presence, whereas Datadog emphasizes specialized cloud infrastructure monitoring for modern technology environments.
Income Statement Comparison
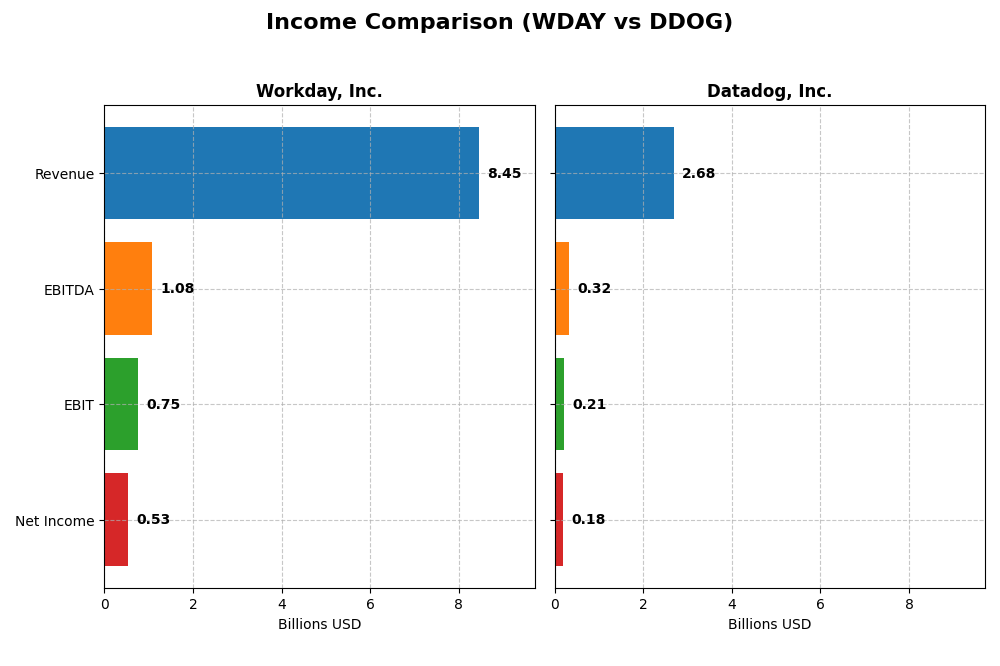
This table compares the most recent fiscal year income statement metrics for Workday, Inc. and Datadog, Inc., providing a snapshot of their financial performance.
| Metric | Workday, Inc. (WDAY) | Datadog, Inc. (DDOG) |
|---|---|---|
| Market Cap | 49.9B | 41.7B |
| Revenue | 8.45B | 2.68B |
| EBITDA | 1.08B | 318M |
| EBIT | 752M | 211M |
| Net Income | 526M | 184M |
| EPS | 1.98 | 0.55 |
| Fiscal Year | 2025 | 2024 |
Income Statement Interpretations
Workday, Inc.
Workday has shown steady revenue growth from $4.3B in 2021 to $8.4B in 2025, nearly doubling over five years. Net income turned positive after losses, reaching $526M in 2025, though net margin declined sharply last year. Gross margins remain strong at 75.5%, and EBIT margin stabilized around 8.9%. The latest year saw favorable revenue and EBIT growth, but net margin and EPS contracted.
Datadog, Inc.
Datadog’s revenue surged from $603M in 2020 to $2.68B in 2024, a nearly 4.5x increase, with net income improving from losses to $184M. Gross margin stands high at 80.8%, and EBIT margin is stable near 7.9%. The most recent year recorded robust growth across revenue, gross profit, EBIT, net margin, and EPS, reflecting strong operational scaling and profitability gains.
Which one has the stronger fundamentals?
Both companies exhibit favorable fundamentals with solid revenue and profit growth, but Datadog leads with higher gross margin (80.8% vs. 75.5%) and more pronounced net margin and EPS expansion. Workday’s recent net margin contraction contrasts with Datadog’s consistent improvement. Overall, Datadog shows a higher proportion of favorable income metrics, indicating relatively stronger income statement fundamentals.
Financial Ratios Comparison
The following table compares key financial ratios for Workday, Inc. (WDAY) and Datadog, Inc. (DDOG) based on their most recent fiscal year data from 2025 and 2024 respectively.
| Ratios | Workday, Inc. (2025) | Datadog, Inc. (2024) |
|---|---|---|
| ROE | 5.82% | 6.77% |
| ROIC | 2.73% | 1.07% |
| P/E | 132.15 | 261.42 |
| P/B | 7.69 | 17.70 |
| Current Ratio | 1.85 | 2.64 |
| Quick Ratio | 1.85 | 2.64 |
| D/E (Debt-to-Equity) | 0.37 | 0.68 |
| Debt-to-Assets | 18.70% | 31.84% |
| Interest Coverage | 3.64 | 7.68 |
| Asset Turnover | 0.47 | 0.46 |
| Fixed Asset Turnover | 5.36 | 6.72 |
| Payout Ratio | 0 | 0 |
| Dividend Yield | 0 | 0 |
This table presents a snapshot of profitability, valuation, liquidity, leverage, and efficiency metrics to facilitate a direct comparison between these two technology application companies.
Interpretation of the Ratios
Workday, Inc.
Workday presents a balanced ratio profile with favorable liquidity metrics, including a current ratio of 1.85 and a strong interest coverage of 6.6. However, profitability ratios such as ROE (5.82%) and ROIC (2.73%) are unfavorable, alongside a high P/E of 132.15 and a price-to-book of 7.69. The company does not pay dividends, likely prioritizing reinvestment for growth and operational expansion.
Datadog, Inc.
Datadog shows mixed ratios with strong liquidity (current ratio 2.64) and excellent interest coverage of 29.85, but struggles with profitability, reflected by an ROE of 6.77% and ROIC of 1.07%, both unfavorable. Valuation multiples are high, with a P/E of 261.42 and PB at 17.7. Like Workday, Datadog pays no dividends, focusing on growth and reinvestment.
Which one has the best ratios?
Workday’s ratio evaluation is neutral, balancing favorable liquidity and coverage against weak profitability and high valuation multiples. Datadog’s ratios are slightly unfavorable, with strong liquidity offset by weaker profitability and even higher valuation ratios. Overall, Workday’s ratios appear somewhat more balanced than Datadog’s, although both face profitability challenges.
Strategic Positioning
This section compares the strategic positioning of Workday, Inc. and Datadog, Inc. in terms of Market position, Key segments, and Exposure to technological disruption:
Workday, Inc.
- Market position and competitive pressure: Large market cap of 49.9B in enterprise cloud software with moderate beta indicating stable competition.
- Key segments and business drivers: Primarily subscription services (7.7B in 2025) and professional services.
- Exposure to technological disruption: Cloud applications with advanced analytics and machine learning integration.
Datadog, Inc.
- Market cap of 41.7B in cloud monitoring software with higher beta suggesting more market volatility.
- Focused on SaaS monitoring and analytics platform for IT and business users, no segmented revenue data.
- Real-time observability platform integrating monitoring and security, highly aligned with cloud trends.
Workday, Inc. vs Datadog, Inc. Positioning
Workday features a diversified portfolio across financial management, HCM, and analytics with strong subscription revenues, while Datadog focuses on a concentrated SaaS monitoring platform. Workday’s broader service range contrasts with Datadog’s specialized cloud observability.
Which has the best competitive advantage?
Both companies show slightly unfavorable MOAT ratings due to shedding value despite growing ROIC trends. Neither currently demonstrates a strong sustainable competitive advantage based on the ROIC vs WACC evaluation.
Stock Comparison
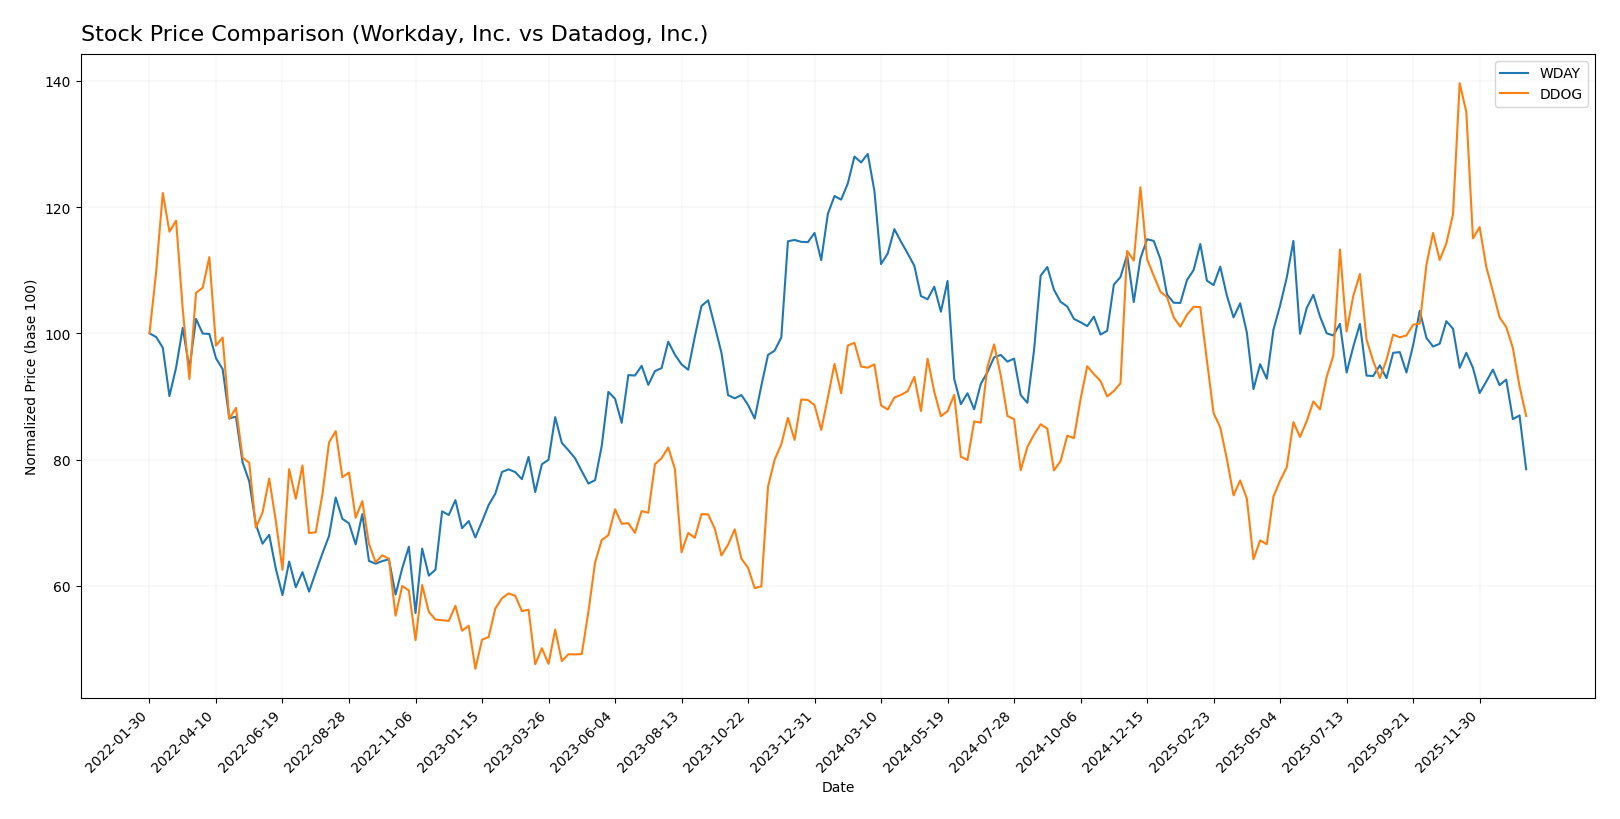
The stock prices of Workday, Inc. (WDAY) and Datadog, Inc. (DDOG) have both experienced notable declines over the past year, with persistent bearish trends and increasing trading volumes highlighting significant market activity.
Trend Analysis
Workday, Inc. (WDAY) showed a bearish trend over the past 12 months with a -38.91% price change and decelerating decline. The stock experienced high volatility (20.22 std deviation) with prices ranging from 305.88 to 186.86.
Datadog, Inc. (DDOG) also followed a bearish trend with an -8.1% price drop over the year and deceleration in the downward trend. Volatility remained elevated at 18.63 std deviation, with a high of 191.24 and a low of 87.93.
Comparing both, WDAY’s stock delivered a larger negative return than DDOG, indicating a stronger bearish performance over the last 12 months.
Target Prices
Analysts present a bullish consensus for both Workday, Inc. and Datadog, Inc., indicating potential upside from current prices.
| Company | Target High | Target Low | Consensus |
|---|---|---|---|
| Workday, Inc. | 320 | 235 | 274.47 |
| Datadog, Inc. | 215 | 105 | 177.67 |
The consensus targets for Workday and Datadog stand well above their current prices of $186.86 and $119.02 respectively, reflecting analyst optimism about future growth potential.
Analyst Opinions Comparison
This section compares analysts’ ratings and grades for Workday, Inc. and Datadog, Inc.:
Rating Comparison
WDAY Rating
- Rating: B-, assessed as Very Favorable overall financial standing.
- Discounted Cash Flow Score: 4, indicating a Favorable valuation based on future cash flows.
- ROE Score: 3, Moderate efficiency in generating profit from equity.
- ROA Score: 3, Moderate effectiveness in asset utilization.
- Debt To Equity Score: 2, Moderate financial risk with balanced debt levels.
- Overall Score: 2, Moderate overall financial performance rating.
DDOG Rating
- Rating: C+, also assessed as Very Favorable overall financial standing.
- Discounted Cash Flow Score: 4, indicating a Favorable valuation based on future cash flows.
- ROE Score: 2, Moderate but lower efficiency compared to WDAY.
- ROA Score: 3, Moderate effectiveness in asset utilization, equal to WDAY.
- Debt To Equity Score: 2, Moderate financial risk, same as WDAY.
- Overall Score: 2, Moderate overall financial performance rating, equal to WDAY.
Which one is the best rated?
Both Workday and Datadog share the same overall score of 2 and identical Discounted Cash Flow, ROA, and Debt to Equity scores. Workday holds a higher ROE score and a better letter rating (B- vs. C+), making it slightly better rated based strictly on the data provided.
Scores Comparison
Here is a comparison of the financial stability and strength scores for Workday, Inc. and Datadog, Inc.:
WDAY Scores
- Altman Z-Score: 4.41, indicating a safe zone from bankruptcy risk.
- Piotroski Score: 6, representing average financial strength.
DDOG Scores
- Altman Z-Score: 11.37, indicating a safe zone from bankruptcy risk.
- Piotroski Score: 6, representing average financial strength.
Which company has the best scores?
Both Workday and Datadog have Altman Z-Scores in the safe zone, with Datadog’s score significantly higher. Their Piotroski Scores are equal, reflecting average financial strength for both companies.
Grades Comparison
Here is the grades comparison for Workday, Inc. and Datadog, Inc. based on recent analyst ratings:
Workday, Inc. Grades
The following table summarizes the recent grades issued by recognized grading companies for Workday, Inc.:
| Grading Company | Action | New Grade | Date |
|---|---|---|---|
| Barclays | Maintain | Overweight | 2026-01-12 |
| RBC Capital | Maintain | Outperform | 2026-01-05 |
| TD Cowen | Maintain | Buy | 2025-11-26 |
| DA Davidson | Maintain | Neutral | 2025-11-26 |
| Wells Fargo | Maintain | Overweight | 2025-11-26 |
| Barclays | Maintain | Overweight | 2025-11-26 |
| Keybanc | Maintain | Overweight | 2025-11-26 |
| Citigroup | Maintain | Neutral | 2025-11-26 |
| JP Morgan | Maintain | Overweight | 2025-11-26 |
| UBS | Maintain | Neutral | 2025-11-26 |
Workday’s grades show a predominance of “Overweight” and “Buy” ratings, indicating a generally positive analyst sentiment with consistent maintenance of these ratings over several months.
Datadog, Inc. Grades
Below is a summary of the latest analyst grades for Datadog, Inc.:
| Grading Company | Action | New Grade | Date |
|---|---|---|---|
| Barclays | Maintain | Overweight | 2026-01-12 |
| Keybanc | Maintain | Overweight | 2026-01-12 |
| Morgan Stanley | Upgrade | Overweight | 2026-01-12 |
| Truist Securities | Maintain | Hold | 2026-01-07 |
| RBC Capital | Maintain | Outperform | 2026-01-05 |
| Jefferies | Maintain | Buy | 2026-01-05 |
| Piper Sandler | Maintain | Overweight | 2026-01-05 |
| Citigroup | Maintain | Buy | 2025-11-12 |
| Truist Securities | Maintain | Hold | 2025-11-07 |
| DA Davidson | Maintain | Buy | 2025-11-07 |
Datadog exhibits a strong consensus around “Overweight” and “Buy” ratings, with Morgan Stanley recently upgrading its grade, reflecting a positive trend among analysts.
Which company has the best grades?
Both Workday and Datadog have received predominantly positive grades, with a majority classified as “Buy,” “Outperform,” or “Overweight.” Datadog shows a slight edge due to a recent upgrade and fewer hold recommendations, which could suggest stronger analyst conviction. This may imply different risk and reward profiles for investors depending on their portfolio strategies.
Strengths and Weaknesses
Below is a comparative overview of key strengths and weaknesses of Workday, Inc. (WDAY) and Datadog, Inc. (DDOG) based on the most recent financial and operational data.
| Criterion | Workday, Inc. (WDAY) | Datadog, Inc. (DDOG) |
|---|---|---|
| Diversification | Moderate: Predominantly subscription services with growing professional services segment (7.72B and 728M in 2025). | Limited product diversification; focused on cloud monitoring and analytics services. |
| Profitability | Neutral net margin at 6.23%, but ROIC (2.73%) below WACC (8.86%), indicating value destruction. | Neutral net margin at 6.85%, ROIC (1.07%) below WACC (9.53%), also shedding value. |
| Innovation | Sustained growth in ROIC trend (161.9%), indicating improving profitability potential. | Stronger ROIC growth trend (224.5%), showing improving profitability despite current losses. |
| Global presence | Established global footprint with expanding subscription base. | Growing international presence but less diversified geographically. |
| Market Share | Strong in enterprise HR and financial management cloud services. | Leading in cloud monitoring market with increasing adoption. |
Key takeaways: Both companies are currently shedding value as ROIC remains below their cost of capital, despite marked improvements in profitability trends. Workday shows more diversification and a balanced financial position, while Datadog excels in innovation and growth potential but faces challenges in diversification and valuation metrics. Caution and continuous monitoring of profitability improvements are advised.
Risk Analysis
Below is a comparative risk assessment for Workday, Inc. (WDAY) and Datadog, Inc. (DDOG) based on the most recent data available in 2026.
| Metric | Workday, Inc. (WDAY) | Datadog, Inc. (DDOG) |
|---|---|---|
| Market Risk | Beta 1.14, moderate volatility | Beta 1.26, slightly higher volatility |
| Debt level | Low debt-to-equity 0.37, favorable | Moderate debt-to-equity 0.68, neutral |
| Regulatory Risk | Moderate, typical for cloud software | Moderate, with some exposure to data privacy laws |
| Operational Risk | Medium, reliant on continuous cloud service uptime | Medium, dependency on SaaS platform stability |
| Environmental Risk | Low, software industry with limited direct impact | Low, similar profile with limited environmental footprint |
| Geopolitical Risk | Moderate, US-based but global clients | Moderate, US-based with international exposure |
Workday and Datadog both face moderate market and geopolitical risks due to their global operations. Datadog’s higher beta indicates greater price sensitivity to market swings. Workday’s lower debt levels reduce financial risk, while Datadog carries moderate leverage. Operational risks are comparable, centered on cloud infrastructure reliability. Regulatory risks focus on data security and privacy compliance. Environmental risks remain low for both companies.
The most impactful risk for investors is market volatility combined with regulatory uncertainties in the fast-evolving technology and cloud sectors, which can affect valuations and operational compliance costs.
Which Stock to Choose?
Workday, Inc. (WDAY) shows a generally favorable income evolution with strong revenue growth of 16.35% in the last year and a positive global income statement opinion. However, its profitability ratios like ROE and ROIC are unfavorable, and the company is shedding value despite a growing ROIC trend. Debt metrics are favorable, and the rating stands at B- with a moderate overall score.
Datadog, Inc. (DDOG) reports a highly favorable income statement with revenue growth of 26.12% last year and sustained strong net income growth overall. Profitability ratios such as ROE and ROIC remain unfavorable, and the company is also shedding value despite improving profitability. Debt ratios are neutral to favorable, and the rating is C+ with a moderate overall score.
Investors focused on growth might find Datadog’s stronger income growth and improving profitability more appealing, while those prioritizing financial stability and balanced debt metrics could see Workday as slightly more favorable. Both companies show signs of value destruction but with improving profitability trends, suggesting a nuanced interpretation depending on the investor’s risk tolerance and investment strategy.
Disclaimer: Investment carries a risk of loss of initial capital. The past performance is not a reliable indicator of future results. Be sure to understand risks before making an investment decision.
Go Further
I encourage you to read the complete analyses of Workday, Inc. and Datadog, Inc. to enhance your investment decisions: