Home > Comparison > Technology > DDOG vs U
The strategic rivalry between Datadog, Inc. and Unity Software Inc. shapes the evolving landscape of the technology sector. Datadog operates as a robust SaaS platform specializing in cloud monitoring and analytics, while Unity leads with an interactive real-time 3D content creation platform. This analysis pits Datadog’s infrastructure focus against Unity’s immersive software to identify which offers a superior risk-adjusted return for diversified portfolios amid ongoing digital transformation.
Table of contents
Companies Overview
Datadog and Unity Software stand as pivotal players reshaping software application markets with distinct technological approaches.
Datadog, Inc.: Cloud Monitoring Powerhouse
Datadog dominates the cloud monitoring and analytics space. It generates revenue through a SaaS platform that integrates infrastructure and application performance monitoring, security, and log management. In 2026, its strategic focus centers on expanding real-time observability and enhancing collaboration tools for developers and IT operations worldwide.
Unity Software Inc.: Real-Time 3D Innovator
Unity Software leads in interactive real-time 3D content creation. It earns revenue by providing a platform for developers and designers to build and monetize 2D and 3D content across multiple devices. In 2026, Unity concentrates on broadening its market reach and refining monetization tools for augmented and virtual reality applications.
Strategic Collision: Similarities & Divergences
Both companies thrive in software but diverge in business philosophy: Datadog offers a comprehensive cloud observability suite, while Unity builds an open ecosystem for interactive content creation. Their battleground lies in serving developers, but with different end goals—performance monitoring versus immersive experience. These differences define unique investment profiles shaped by distinct sector dynamics and growth trajectories.
Income Statement Comparison
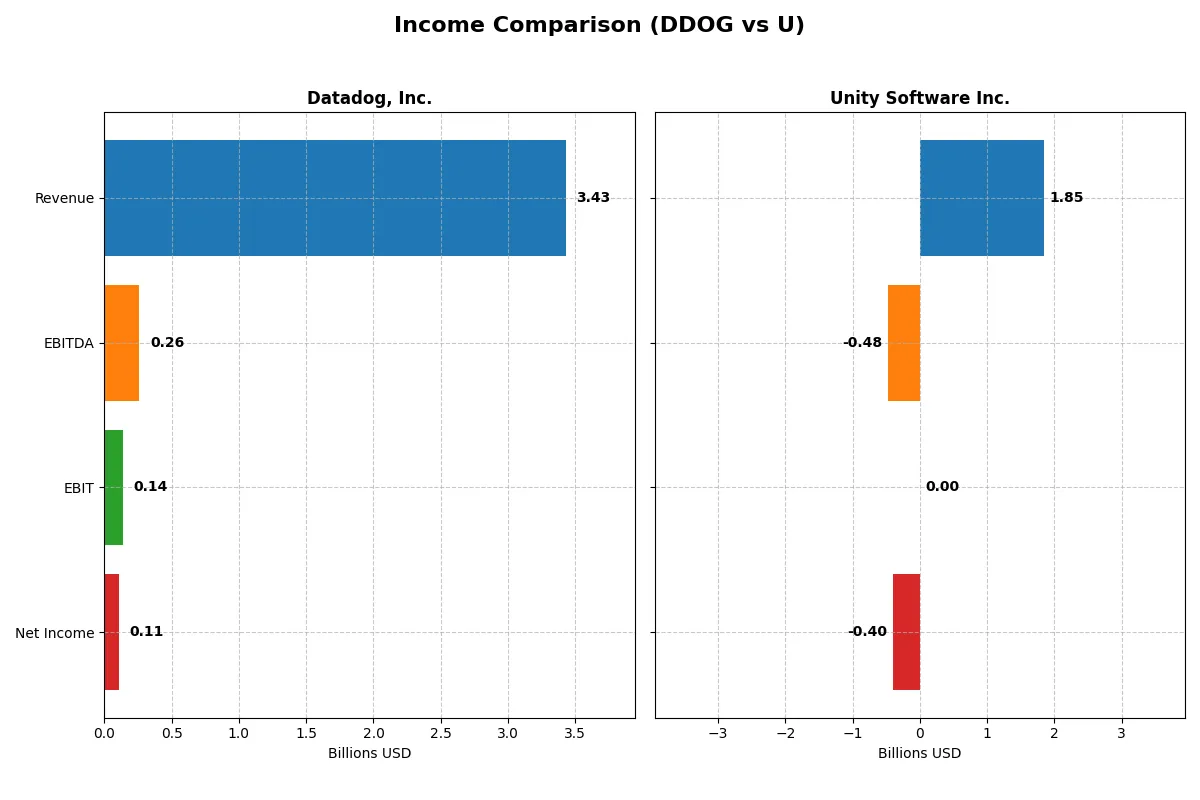
This data dissects the core profitability and scalability of both corporate engines to reveal who dominates the bottom line:
| Metric | Datadog, Inc. (DDOG) | Unity Software Inc. (U) |
|---|---|---|
| Revenue | 3.43B | 1.85B |
| Cost of Revenue | 687M | 478M |
| Operating Expenses | 2.78B | 1.85B |
| Gross Profit | 2.74B | 1.37B |
| EBITDA | 261M | -479M |
| EBIT | 138M | 0 |
| Interest Expense | 11M | -24M |
| Net Income | 108M | -403M |
| EPS | 0.31 | -0.96 |
| Fiscal Year | 2025 | 2025 |
Income Statement Analysis: The Bottom-Line Duel
This income statement comparison reveals which company operates with stronger efficiency and profitability in a competitive market environment.
Datadog, Inc. Analysis
Datadog’s revenue soared from 1B in 2021 to 3.4B in 2025, reflecting robust 233% growth. Net income rose from a loss of 21M in 2021 to a positive 108M in 2025. Its gross margin remains impressively high near 80%, signaling strong cost control. However, net margin dips to 3.14% in 2025, pressured by rising operating expenses, revealing tightening profitability despite top-line momentum.
Unity Software Inc. Analysis
Unity’s revenue grew steadily from 1.1B in 2021 to 1.85B in 2025—a moderate 67% increase. Net income remains deeply negative at -403M in 2025 but shows improvement from prior years. Its gross margin at 74% is solid but trailing Datadog’s. Negative net margins close to -22% highlight ongoing profitability challenges, while operating losses persist despite slight margin gains in recent years.
Margin Strength vs. Revenue Expansion
Datadog outpaces Unity in both revenue scale and net income growth, achieving profitability where Unity still struggles. Datadog’s nearly 80% gross margin and positive net income mark it as the more operationally efficient engine. Unity’s profile appeals more to those prioritizing growth potential but with high risk. Datadog offers a clearer path to sustainable profits.
Financial Ratios Comparison
These vital ratios act as a diagnostic tool to expose the underlying fiscal health, valuation premiums, and capital efficiency of the companies compared below:
| Ratios | Datadog, Inc. (DDOG) | Unity Software Inc. (U) |
|---|---|---|
| ROE | 2.89% | -12.44% |
| ROIC | -0.74% | -8.16% |
| P/E | 438.4x | -46.16x |
| P/B | 12.65x | 5.74x |
| Current Ratio | 3.38 | 1.84 |
| Quick Ratio | 3.38 | 1.84 |
| D/E (Debt-to-Equity) | 0.41 | 0.69 |
| Debt-to-Assets | 23.1% | 32.7% |
| Interest Coverage | -4.01x | 19.95x |
| Asset Turnover | 0.52 | 0.27 |
| Fixed Asset Turnover | 6.20 | 27.09 |
| Payout ratio | 0% | 0% |
| Dividend yield | 0% | 0% |
| Fiscal Year | 2025 | 2025 |
Efficiency & Valuation Duel: The Vital Signs
Financial ratios act as the company’s DNA, revealing hidden risks and operational excellence that shape investor confidence and valuation.
Datadog, Inc.
Datadog shows weak profitability with a 2.89% ROE and slim net margins at 3.14%, while trading at a stretched 438.37 P/E. The stock appears expensive relative to earnings, reflecting high growth expectations. Lack of dividends suggests reinvestment into R&D, fueling innovation but adding risk. Its strong balance sheet and favorable debt metrics support operational stability.
Unity Software Inc.
Unity suffers from deep losses with a -12.44% ROE and negative net margin of -21.78%. The negative P/E reflects ongoing unprofitability, though the lower 5.74 P/B ratio hints at some valuation appeal. Unity’s cash focus extends to R&D over dividends, aiming to build future growth. Its weaker interest coverage and asset turnover ratios pose challenges for operational efficiency.
Premium Valuation vs. Operational Safety
Datadog’s valuation is highly stretched but backed by operational discipline and solid liquidity. Unity presents a riskier profile with poor profitability and operational inefficiencies but trades at a more reasonable price-to-book level. Investors seeking stability may prefer Datadog’s measured approach; those with higher risk tolerance might consider Unity’s growth ambitions.
Which one offers the Superior Shareholder Reward?
Datadog and Unity both pay no dividends, focusing on reinvestment and buybacks for shareholder returns. Datadog yields a stronger free cash flow of 2.9/share in 2025 versus Unity’s 1.0/share, supporting sustainable buybacks. Datadog’s payout ratio is zero, but its buyback program is aggressive and well-covered by cash flow. Unity’s weaker margins, negative net income, and volatile operating cash flows limit buyback capacity. I see Datadog’s distribution model as more sustainable given its solid cash flow and moderate leverage. For 2026, Datadog offers a superior total return profile, blending disciplined buybacks with robust fundamentals, unlike Unity’s riskier, growth-focused approach.
Comparative Score Analysis: The Strategic Profile
The radar chart reveals the fundamental DNA and trade-offs of Datadog, Inc. and Unity Software Inc.:
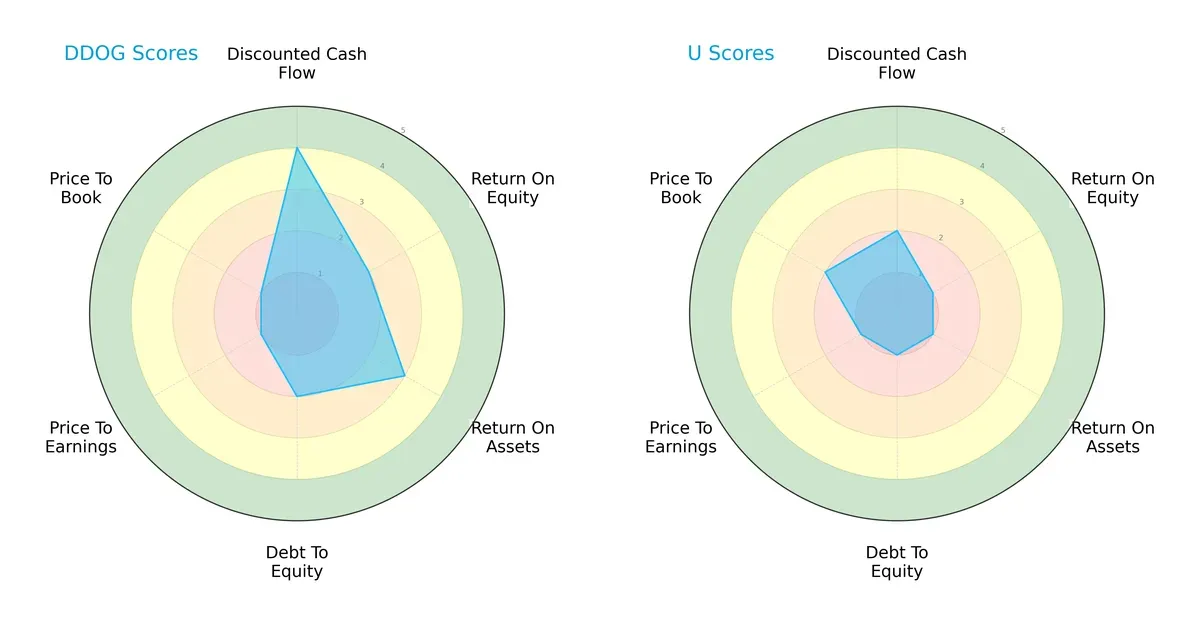
Datadog shows a more balanced profile with a favorable discounted cash flow score (4) and moderate return on assets (3). Unity lags with uniformly low scores, especially in ROE and ROA (both 1). Datadog’s strength lies in cash flow generation, while Unity relies on weaker valuation metrics and higher financial risk. Unity’s price-to-book score (2) slightly edges Datadog’s very unfavorable 1, but overall Datadog dominates on operational efficiency and financial stability.
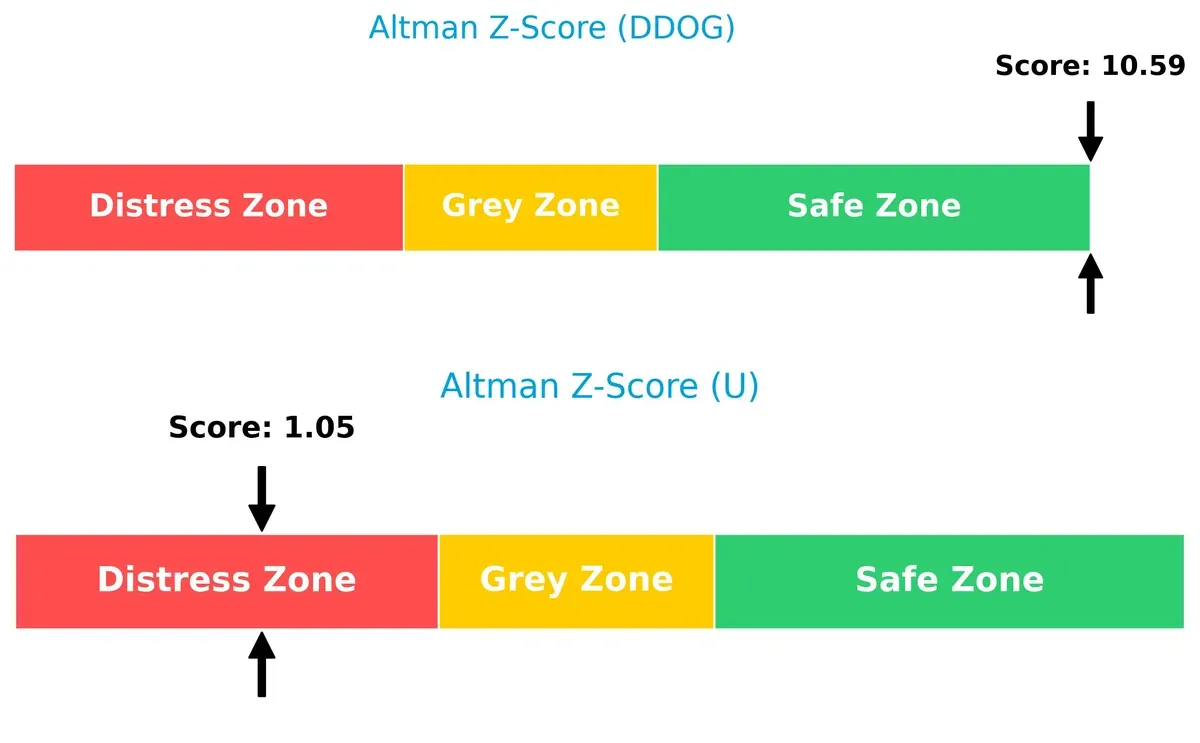
Bankruptcy Risk: Solvency Showdown
Datadog’s Altman Z-Score of 10.6 places it securely in the safe zone, while Unity’s 1.05 signals distress risk. This large delta highlights Datadog’s robust solvency versus Unity’s vulnerability in economic downturns:
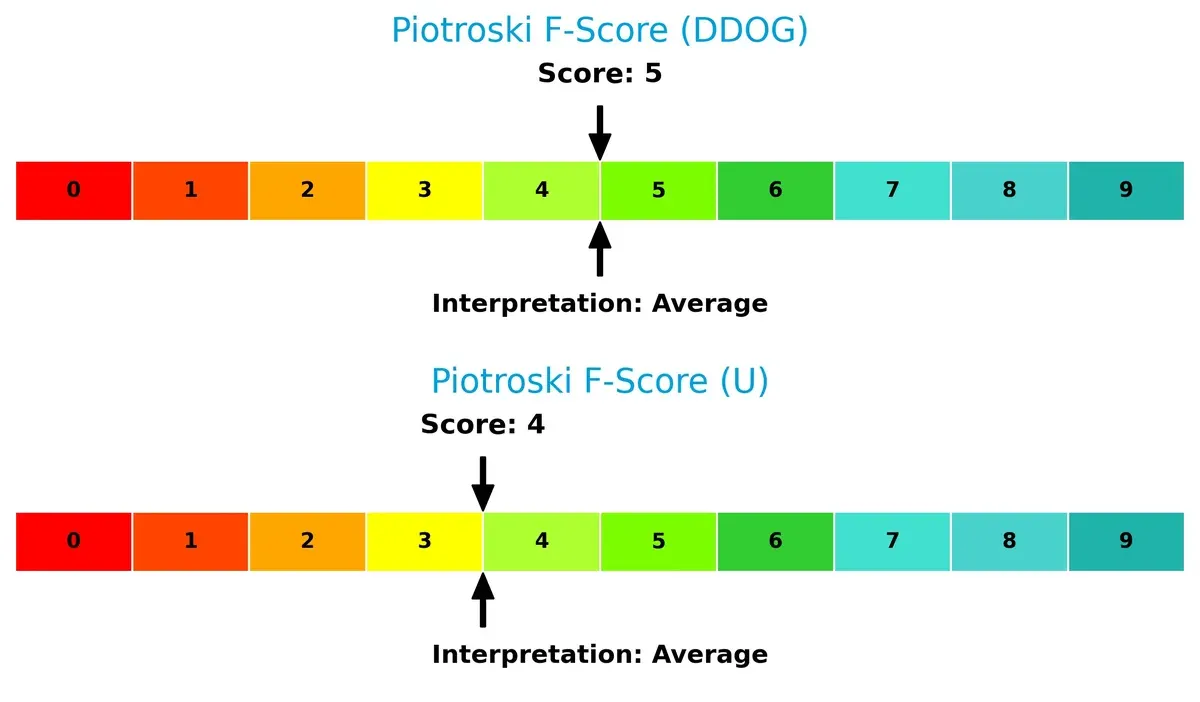
Financial Health: Quality of Operations
Both companies register average Piotroski F-Scores, with Datadog at 5 and Unity at 4, indicating moderate financial health. Neither shows peak strength; however, Unity’s slightly lower score hints at more internal red flags in profitability or liquidity:
How are the two companies positioned?
This section dissects the operational DNA of Datadog and Unity by comparing their revenue distribution and internal dynamics. The goal is to confront their economic moats, revealing which model offers the strongest, most sustainable competitive edge today.
Revenue Segmentation: The Strategic Mix
This visual comparison dissects how Datadog, Inc. and Unity Software Inc. diversify their income streams and where their primary sector bets lie:
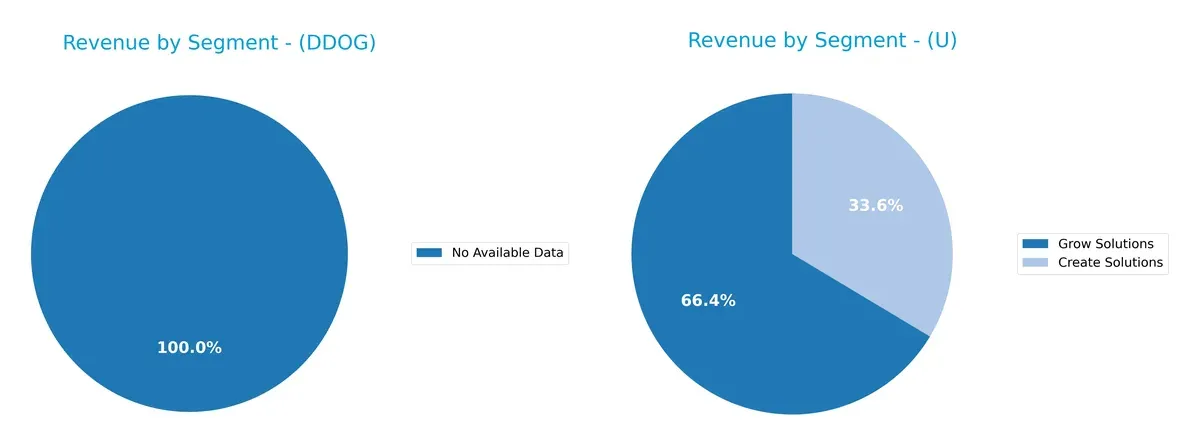
Datadog lacks available segment data, preventing direct comparison. Unity pivots between Create Solutions (~$620M in 2025) and Grow/Operate Solutions (~$1.23B), anchoring revenue in platform expansion. Unity’s dual-segment reliance suggests balanced growth but some concentration risk. Without Datadog’s segmentation, Unity’s mix hints at ecosystem lock-in via integrated content creation and operation tools.
Strengths and Weaknesses Comparison
This table compares the strengths and weaknesses of Datadog, Inc. and Unity Software Inc.:
Datadog Strengths
- Strong international and North American presence
- Favorable quick ratio at 3.38
- Low debt-to-equity ratio at 0.41
- High fixed asset turnover at 6.2
Unity Strengths
- Diversified revenue streams in Create and Grow Solutions
- Favorable fixed asset turnover at 27.09
- Positive price-to-earnings ratio
- Favorable current and quick ratios at 1.84
Datadog Weaknesses
- Unfavorable net margin at 3.14%
- Negative return on invested capital at -0.74%
- High price-to-book ratio at 12.65
- Unfavorable overall financial ratios at 50%
Unity Weaknesses
- Negative net margin at -21.78%
- Negative ROE and ROIC
- Unfavorable interest coverage
- High weighted average cost of capital at 11.27%
Datadog shows strengths in liquidity and asset management but struggles with profitability and valuation metrics. Unity demonstrates product diversification and operational efficiency yet faces significant profitability and capital cost challenges. These contrasting profiles highlight differing strategic priorities and financial health.
The Moat Duel: Analyzing Competitive Defensibility
A structural moat is the only reliable shield protecting long-term profits from relentless competition erosion. Here’s how two software firms stack up:
Datadog, Inc.: Integration-Fueled Switching Costs
Datadog’s moat relies on high switching costs, embedding its monitoring tools deeply into clients’ cloud infrastructure. This strategy yields stable 80% gross margins and growing profitability, despite recent margin pressure. In 2026, expanding AI-driven analytics could deepen its competitive edge.
Unity Software Inc.: Ecosystem Network Effects
Unity’s moat stems from powerful network effects in real-time 3D content creation, attracting developers and monetization partners worldwide. Though suffering negative net margins, it shows improving ROIC trends and revenue diversification across global markets. New AR/VR platforms offer promising expansion avenues.
Verdict: Switching Costs vs. Network Effects
Datadog’s integration creates a wider moat through entrenched client dependence, while Unity’s ecosystem offers depth but faces profitability challenges. Datadog is better positioned to defend market share amid intensifying competition in 2026.
Which stock offers better returns?
The past year reveals contrasting dynamics: Datadog, Inc. edges a mild 1.77% gain with slowing momentum, while Unity Software Inc. suffers a sharp 30.79% decline, both showing seller dominance in recent trading.
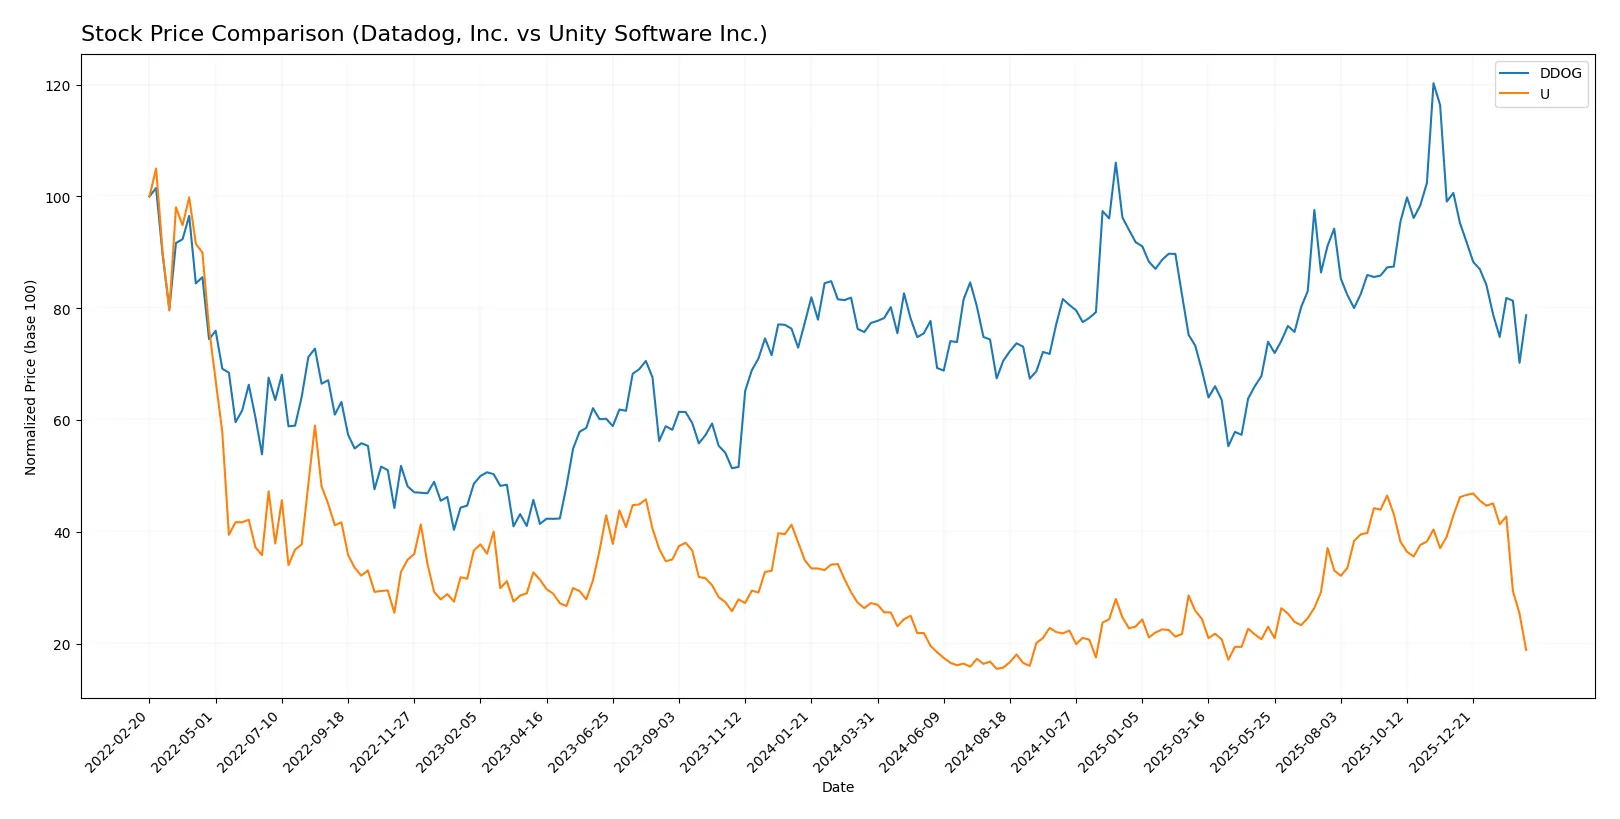
Trend Comparison
Datadog, Inc. posts a 1.77% price increase over 12 months, signaling a bullish yet decelerating trend. Its price ranges from 87.93 to 191.24, with high volatility (18.68 std deviation).
Unity Software Inc. declines 30.79% over the same period, confirming a bearish, decelerating trend. The stock’s price fluctuates between 15.32 and 46.42, with lower volatility (9.2 std deviation).
Datadog delivers the highest market performance, showing resilience despite decelerating gains, while Unity’s sharp losses mark a clear underperformance.
Target Prices
Analysts present a cautious yet optimistic consensus on Datadog and Unity Software targets for 2026.
| Company | Target Low | Target High | Consensus |
|---|---|---|---|
| Datadog, Inc. | 105 | 215 | 175.07 |
| Unity Software Inc. | 26 | 60 | 37.7 |
Datadog’s target consensus at $175.07 implies upside from the current $125.2 price, reflecting confidence in its cloud monitoring moat. Unity’s $37.7 consensus suggests significant growth potential from $18.68, but higher volatility demands careful risk assessment.

Don’t Let Luck Decide Your Entry Point
Optimize your entry points with our advanced ProRealTime indicators. You’ll get efficient buy signals with precise price targets for maximum performance. Start outperforming now!
How do institutions grade them?
Datadog, Inc. Grades
The following table summarizes the most recent grades from established grading companies for Datadog, Inc.:
| Grading Company | Action | New Grade | Date |
|---|---|---|---|
| DA Davidson | Maintain | Buy | 2026-02-11 |
| Macquarie | Maintain | Outperform | 2026-02-11 |
| Barclays | Maintain | Overweight | 2026-02-11 |
| Rosenblatt | Maintain | Buy | 2026-02-11 |
| Raymond James | Maintain | Outperform | 2026-02-11 |
| Scotiabank | Maintain | Sector Outperform | 2026-02-11 |
| RBC Capital | Maintain | Outperform | 2026-02-11 |
| Wedbush | Maintain | Outperform | 2026-02-11 |
| Citizens | Maintain | Market Perform | 2026-02-11 |
| BTIG | Maintain | Buy | 2026-02-10 |
Unity Software Inc. Grades
Below is the most recent grading data from credible sources for Unity Software Inc.:
| Grading Company | Action | New Grade | Date |
|---|---|---|---|
| Goldman Sachs | Maintain | Neutral | 2026-02-12 |
| BTIG | Maintain | Buy | 2026-02-12 |
| Needham | Maintain | Buy | 2026-02-12 |
| Wells Fargo | Maintain | Overweight | 2026-02-12 |
| Wedbush | Maintain | Outperform | 2026-02-12 |
| Macquarie | Maintain | Outperform | 2026-02-12 |
| UBS | Maintain | Neutral | 2026-02-12 |
| Citigroup | Maintain | Buy | 2026-02-12 |
| Barclays | Maintain | Equal Weight | 2026-02-12 |
| Citizens | Maintain | Market Outperform | 2026-02-12 |
Which company has the best grades?
Datadog, Inc. consistently receives top-tier grades such as Buy and Outperform from multiple firms. Unity Software’s ratings are more mixed, including Neutral and Equal Weight grades, though it also has several Buy and Outperform ratings. Investors may interpret Datadog’s stronger consensus grades as a clearer vote of confidence.
Risks specific to each company
The following categories identify the critical pressure points and systemic threats facing both firms in the 2026 market environment:
1. Market & Competition
Datadog, Inc.
- Faces intense competition in cloud monitoring with larger tech firms expanding capabilities.
Unity Software Inc.
- Operates in a crowded real-time 3D content market with rising rivals and rapid innovation demands.
2. Capital Structure & Debt
Datadog, Inc.
- Maintains moderate leverage with a debt-to-equity ratio of 0.41, supporting financial flexibility.
Unity Software Inc.
- Exhibits higher leverage at 0.69 debt-to-equity, increasing financial risk amid weak profitability.
3. Stock Volatility
Datadog, Inc.
- Beta around 1.29 indicates moderate market sensitivity and relatively controlled price swings.
Unity Software Inc.
- Beta above 2.08 shows very high stock volatility, posing greater trading risks.
4. Regulatory & Legal
Datadog, Inc.
- Faces standard regulatory scrutiny for software providers with no major legal exposures reported.
Unity Software Inc.
- Exposed to international regulatory complexities due to diverse global operations.
5. Supply Chain & Operations
Datadog, Inc.
- Relies on cloud infrastructure providers; operational risks tied to service outages or cyber threats.
Unity Software Inc.
- Dependent on third-party hardware and software ecosystems, vulnerable to supply disruptions.
6. ESG & Climate Transition
Datadog, Inc.
- Moderate ESG focus; energy-efficient data center usage is a growing priority.
Unity Software Inc.
- Faces pressure to enhance sustainability in digital content creation and global operations.
7. Geopolitical Exposure
Datadog, Inc.
- Primarily US-based with international customers; moderate geopolitical risk from cross-border data laws.
Unity Software Inc.
- High geopolitical exposure due to extensive presence in multiple countries with varying regulations.
Which company shows a better risk-adjusted profile?
Datadog’s strongest risk is stretched valuation with a PE of 438, risking correction amid modest profitability. Unity’s critical risk lies in financial distress indicated by a low Altman Z-score and negative margins. Datadog’s lower leverage and safer bankruptcy zone reflect a better risk-adjusted profile. Recent data show Unity’s Altman Z-score at 1.05, signaling distress, while Datadog’s 10.6 score confirms solid financial stability.
Final Verdict: Which stock to choose?
Datadog, Inc. excels as a cash-generating engine with robust operational efficiency and a growing return on invested capital. Its high valuation demands caution, and its slightly unfavorable capital efficiency signals a point of vigilance. It suits aggressive growth portfolios willing to tolerate premium pricing for scalability.
Unity Software Inc. commands a strategic moat through its unique platform ecosystem, supported by consistent R&D investment and a recurring revenue model. Despite weaker profitability and higher financial risk, it offers better safety margins relative to its slower growth. Ideal for GARP investors seeking growth with moderate valuation discipline.
If you prioritize scalable operational efficiency and are comfortable with premium valuations, Datadog outshines Unity due to its stronger cash flow profile and improving profitability. However, if you seek exposure to a niche ecosystem with better relative financial safety and growth potential at a more reasonable price, Unity offers superior portfolio diversification. Both carry risks, so align your strategy with your risk tolerance.
Disclaimer: Investment carries a risk of loss of initial capital. The past performance is not a reliable indicator of future results. Be sure to understand risks before making an investment decision.
Go Further
I encourage you to read the complete analyses of Datadog, Inc. and Unity Software Inc. to enhance your investment decisions: