Home > Comparison > Technology > UBER vs DDOG
The strategic rivalry between Uber Technologies, Inc. and Datadog, Inc. defines the evolution of the technology sector today. Uber operates a capital-intensive platform connecting mobility, delivery, and freight services worldwide. Datadog, by contrast, delivers high-margin cloud-based monitoring software, targeting IT operations and developers. This analysis pits asset-heavy scale against SaaS innovation to identify which corporate trajectory offers superior risk-adjusted returns for a diversified portfolio in 2026.
Table of contents
Companies Overview
Uber Technologies, Inc. and Datadog, Inc. are pivotal players reshaping software-driven services across distinct sectors.
Uber Technologies, Inc.: Mobility and Delivery Powerhouse
Uber dominates the mobility-as-a-service market by connecting riders with drivers and consumers with delivery providers globally. Its core revenue streams arise from ride-sharing, food delivery, and freight logistics platforms. In 2026, Uber emphasizes expanding its multi-modal transportation offerings and enhancing platform integration to strengthen its competitive edge in urban mobility.
Datadog, Inc.: Cloud Observability Leader
Datadog commands the cloud monitoring and analytics space with its SaaS platform that delivers real-time infrastructure and application performance insights. It monetizes through subscription-based access to its integrated observability and security tools. The company’s 2026 strategy focuses on broadening its security monitoring capabilities and deepening automation features to capture more enterprise cloud spend.
Strategic Collision: Similarities & Divergences
Both companies leverage software to streamline complex ecosystems but diverge in approach: Uber operates a consumer-facing platform focused on physical services, whereas Datadog delivers a B2B SaaS solution for IT operations. Their primary battleground lies in digital transformation—Uber in urban logistics and Datadog in cloud infrastructure management. This contrast defines their unique investment appeal and risk profiles within the tech sector.
Income Statement Comparison
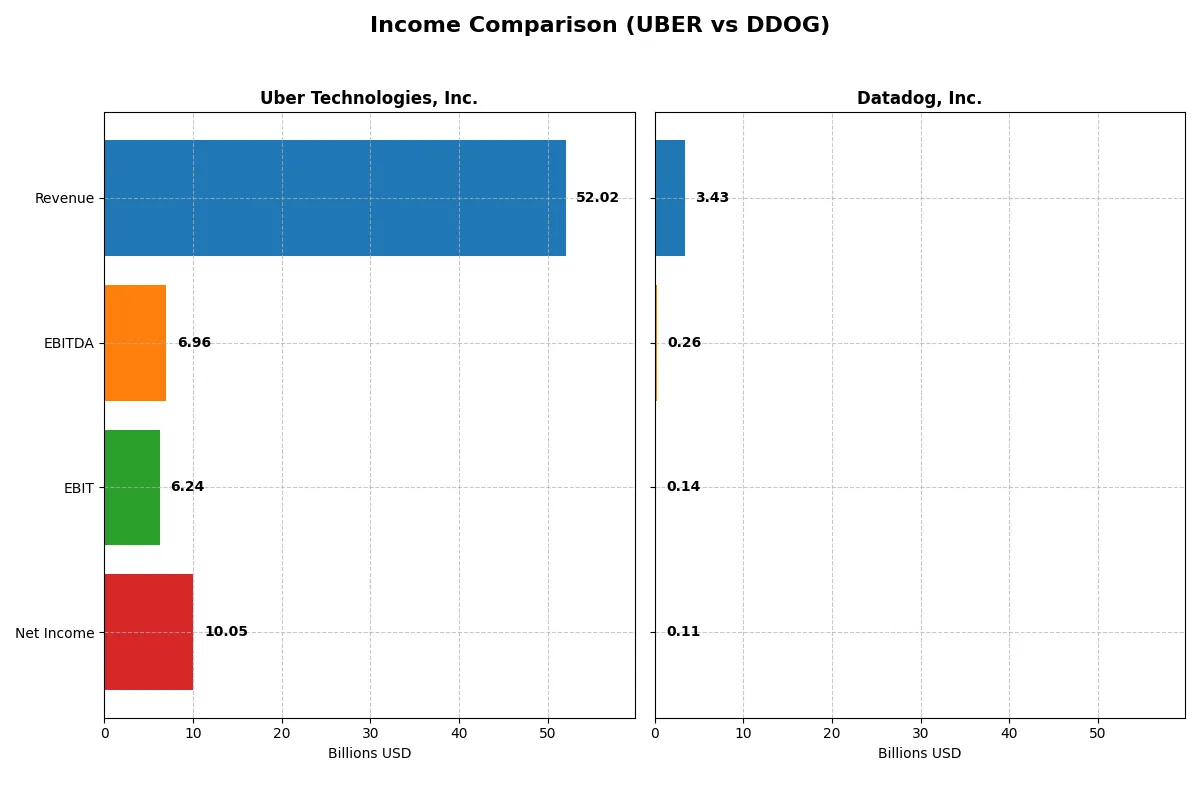
The following data dissects the core profitability and scalability of both corporate engines to reveal who dominates the bottom line:
| Metric | Uber Technologies, Inc. (UBER) | Datadog, Inc. (DDOG) |
|---|---|---|
| Revenue | 52.0B | 3.4B |
| Cost of Revenue | 31.3B | 687M |
| Operating Expenses | 15.1B | 2.8B |
| Gross Profit | 20.7B | 2.7B |
| EBITDA | 6.96B | 261M |
| EBIT | 6.24B | 138M |
| Interest Expense | 440M | 11M |
| Net Income | 10.1B | 108M |
| EPS | 4.82 | 0.31 |
| Fiscal Year | 2025 | 2025 |
Income Statement Analysis: The Bottom-Line Duel
This income statement comparison reveals how efficiently Uber and Datadog convert revenue into profit and sustain growth momentum.
Uber Technologies, Inc. Analysis
Uber’s revenue surged from 17.5B in 2021 to 52B in 2025, showing strong top-line growth. Gross margin improved to 39.75%, reflecting controlled cost of revenue. Operating efficiency soared, with EBIT margin at 12% and net income hitting 10B in 2025. Despite a slight dip in net margin growth last year, Uber’s profit trajectory demonstrates impressive scale and margin expansion.
Datadog, Inc. Analysis
Datadog’s revenue climbed from 1B in 2021 to 3.4B in 2025, outpacing Uber in percentage growth but from a smaller base. Gross margin impresses at nearly 80%, highlighting software’s high profitability. However, EBIT margin remains modest at 4%, and net margin is just 3.14% in 2025. Recent declines in EBIT and net margin growth point to rising operating expenses impacting bottom-line efficiency.
Scale Dominance vs. Margin Purity
Uber dominates with higher absolute profits and healthier EBIT margins, leveraging scale to improve efficiency rapidly. Datadog excels in gross margin purity but struggles to convert it into strong net profits due to elevated operating expenses. For investors seeking robust earnings growth and margin improvement, Uber’s profile currently offers more fundamental strength.
Financial Ratios Comparison
These vital ratios act as a diagnostic tool to expose the underlying fiscal health, valuation premiums, and capital efficiency of the companies analyzed:
| Ratios | Uber Technologies, Inc. (UBER) | Datadog, Inc. (DDOG) |
|---|---|---|
| ROE | 37.18% | 2.89% |
| ROIC | 11.21% | -0.74% |
| P/E | 16.85 | 438.37 |
| P/B | 6.27 | 12.65 |
| Current Ratio | 1.14 | 3.38 |
| Quick Ratio | 1.14 | 3.38 |
| D/E | 0.50 | 0.41 |
| Debt-to-Assets | 21.80% | 23.11% |
| Interest Coverage | 12.65 | -4.01 |
| Asset Turnover | 0.84 | 0.52 |
| Fixed Asset Turnover | 17.28 | 6.20 |
| Payout ratio | 0% | 0% |
| Dividend yield | 0% | 0% |
| Fiscal Year | 2025 | 2025 |
Efficiency & Valuation Duel: The Vital Signs
Ratios serve as a company’s DNA, exposing its hidden risks and operational strengths with sharp clarity.
Uber Technologies, Inc.
Uber delivers strong profitability with a 37.18% ROE and a healthy 19.33% net margin, signaling operational efficiency. Its P/E of 16.85 suggests a fairly valued stock, while a high P/B at 6.27 flags some overvaluation. Uber reinvests profits to fuel growth, with no dividend, focusing on innovation and capital discipline.
Datadog, Inc.
Datadog reports weak profitability: 2.89% ROE and a slim 3.14% net margin, reflecting operational challenges. Its P/E ratio of 438.37 marks the stock as extremely stretched. Despite a solid current ratio of 3.38, Datadog’s capital allocation shows elevated risk, reinvesting heavily in R&D rather than returning cash to shareholders.
Balanced Efficiency vs. Stretched Growth
Uber offers a superior blend of profitability and valuation discipline, presenting a more balanced risk-reward profile. Datadog’s elevated multiples and low returns highlight a growth-at-any-cost approach. Uber fits investors seeking operational strength; Datadog suits those prioritizing aggressive expansion despite higher risks.
Which one offers the Superior Shareholder Reward?
Uber Technologies, Inc. and Datadog, Inc. both avoid dividends, focusing instead on reinvestment and buybacks. Uber’s zero dividend yield contrasts with Datadog’s similar policy. Uber shows a disciplined buyback approach, supported by strong free cash flow of $4.7/share in 2025. Datadog’s free cash flow stands at $2.9/share, but its buyback activity is less aggressive. Uber’s payout sustainability benefits from higher operating margins (~12%) and a robust operating cash flow ratio (~0.82). Datadog’s elevated valuation multiples (P/E ~438) suggest limited near-term return upside despite its strong gross margins (~80%). I conclude Uber offers a more attractive total return profile in 2026, balancing buybacks with sustainable cash flow generation.
Comparative Score Analysis: The Strategic Profile
The radar chart reveals the fundamental DNA and trade-offs of Uber Technologies, Inc. and Datadog, Inc., highlighting their core financial strengths and vulnerabilities:
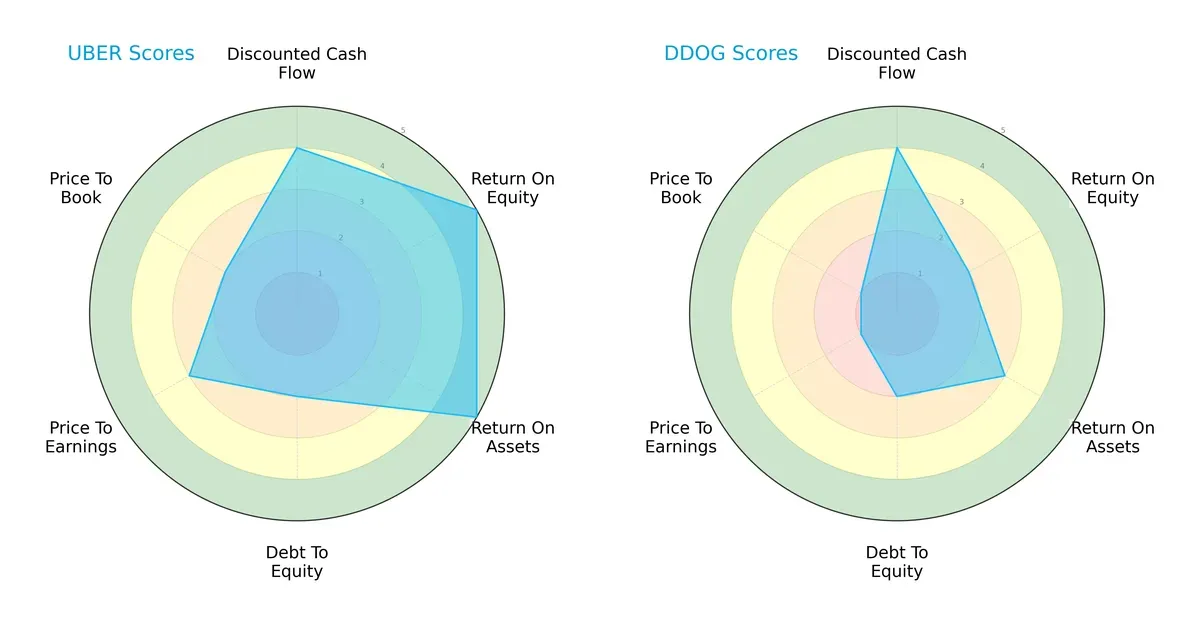
Uber shows a balanced profile with strong returns on equity (5) and assets (5), supported by a solid discounted cash flow score (4). However, it carries financial risk with a low debt-to-equity score (2) and unfavorable price-to-book ratio (2). Datadog relies primarily on its discounted cash flow strength (4) but lags in profitability metrics (ROE 2, ROA 3) and faces valuation challenges with very unfavorable P/E (1) and P/B (1) scores. Uber’s diversified strengths offer better resilience, while Datadog depends on valuation and cash flow appeal.
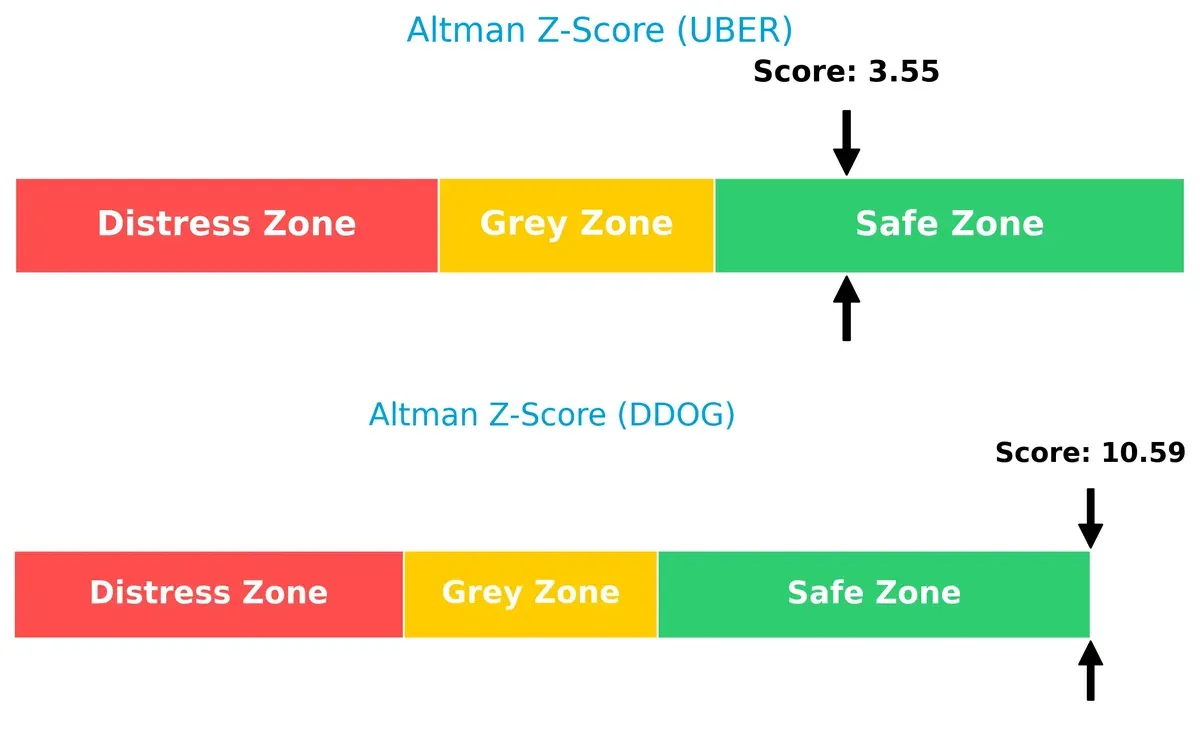
Bankruptcy Risk: Solvency Showdown
Uber’s Altman Z-Score of 3.55 versus Datadog’s 10.59 places both firms safely above distress thresholds, signaling strong solvency and low bankruptcy risk in this cycle:
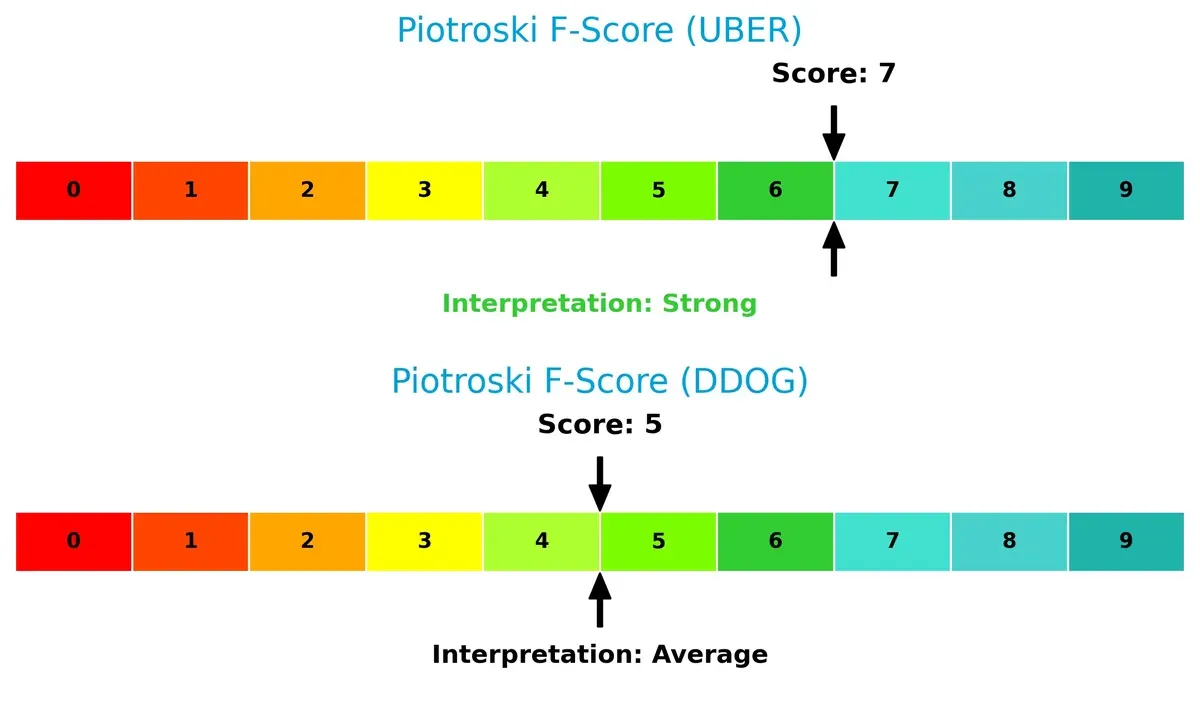
Financial Health: Quality of Operations
Uber’s Piotroski F-Score of 7 indicates strong financial health and operational quality, outperforming Datadog’s average score of 5, which suggests some internal metric weaknesses:
How are the two companies positioned?
This section dissects Uber and Datadog’s operational DNA by comparing their revenue distribution and internal dynamics. The goal is to confront their economic moats to identify which business model offers the most resilient, sustainable competitive advantage today.
Revenue Segmentation: The Strategic Mix
The following visual comparison dissects how Uber Technologies, Inc. and Datadog, Inc. diversify their income streams and where their primary sector bets lie:
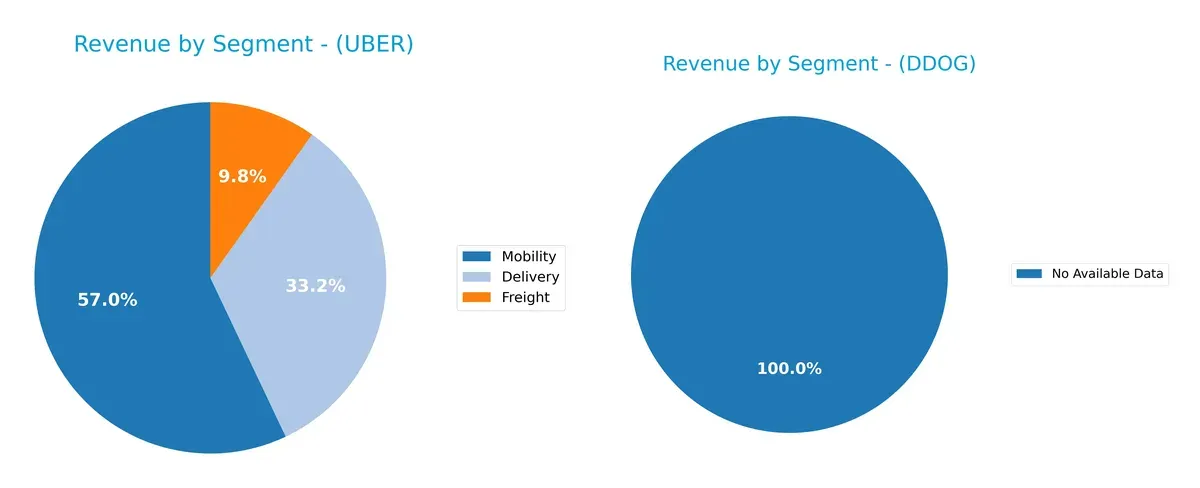
Uber anchors its revenue heavily in Mobility, generating $29.7B in 2025, dwarfing Freight at $5.1B and Delivery at $17.2B. This mix reflects its ecosystem lock-in in ride-hailing while still expanding Delivery. Datadog lacks available segmentation data, preventing direct comparison. Uber’s reliance on Mobility poses concentration risk but also underlines infrastructure dominance in urban transport and logistics.
Strengths and Weaknesses Comparison
This table compares the Strengths and Weaknesses of Uber Technologies, Inc. and Datadog, Inc.:
Uber Strengths
- Diversified revenue streams across Delivery, Mobility, Freight
- Strong profitability with 19.33% net margin and 37.18% ROE
- Favorable leverage metrics and interest coverage
- Significant global presence with $50B+ revenue in US & Canada
- High fixed asset turnover at 17.28
Datadog Strengths
- Favorable debt metrics with low debt-to-assets at 23.11%
- Strong liquidity as indicated by quick ratio of 3.38
- Global expansion shown by increasing international revenue
- Favorable interest coverage at 12.49
- Asset turnover neutrality suggests operational steadiness
Uber Weaknesses
- Price-to-book ratio at 6.27 is unfavorable, indicating premium valuation
- Neutral current ratio suggests limited short-term liquidity buffer
- No dividend yield potentially deterring income investors
- Asset turnover neutral at 0.84 compared to industry leaders
Datadog Weaknesses
- Low profitability with 3.14% net margin and negative ROIC
- Extremely high P/E of 438.37 signals overvaluation risk
- Current ratio unfavorable despite strong quick ratio, indicating potential working capital issues
- No dividend yield limits income appeal
Uber’s strengths lie in robust profitability and diversified global revenue, while Datadog faces profitability and valuation challenges despite strong liquidity. Each company’s financial profile suggests different strategic priorities for sustaining growth and shareholder value.
The Moat Duel: Analyzing Competitive Defensibility
A structural moat is the only thing protecting long-term profits from the erosion of competition. Let’s dissect how Uber and Datadog defend their turf:
Uber Technologies, Inc.: Network Effects and Scale Moat
Uber leverages massive network effects, connecting millions of riders and drivers globally. This yields high ROIC well above WACC, reflecting efficient capital use and margin stability. Expansion in EMEA and Asia Pacific in 2026 could deepen its moat.
Datadog, Inc.: Intangible Assets and Innovation Moat
Datadog’s moat stems from its advanced SaaS analytics platform, driven by strong intangible assets like proprietary technology and customer integration. Despite shedding value overall, its growing ROIC signals improving capital efficiency and potential to disrupt with new cloud services.
Verdict: Network Effects vs. Intangible Innovation
Uber’s wider moat benefits from global scale and network effects, outperforming Datadog’s narrower intangible asset moat. Uber is better equipped to defend market share amid intensifying competition in 2026.
Which stock offers better returns?
Over the past year, Uber Technologies, Inc. and Datadog, Inc. exhibited contrasting price trajectories, with notable shifts in trading volumes and recent downward momentum.
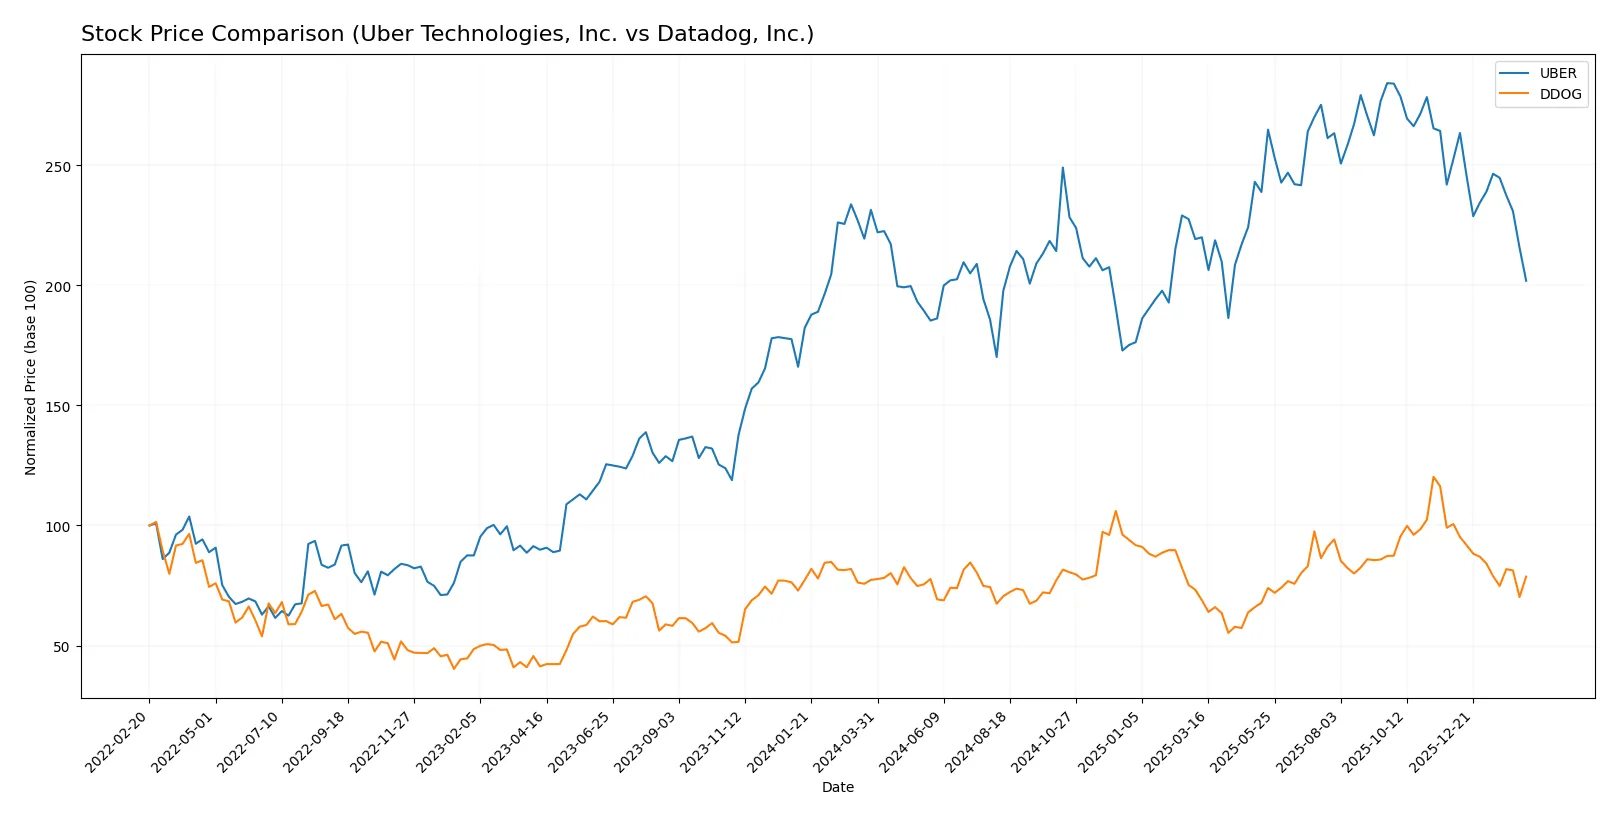
Trend Comparison
Uber’s stock declined 12.76% over the past 12 months, signaling a bearish trend with decelerating losses and a high volatility of 10.33. Its price peaked at 98.51 and bottomed at 58.99.
Datadog’s stock rose 1.77% over the last year, indicating a mild bullish trend but with deceleration. Volatility was higher at 18.68, with a high of 191.24 and a low of 87.93.
Comparing both, Datadog delivered the highest market performance with a slight gain versus Uber’s significant decline during the same period.
Target Prices
Analysts present a bullish consensus for Uber Technologies and Datadog, reflecting strong growth expectations.
| Company | Target Low | Target High | Consensus |
|---|---|---|---|
| Uber Technologies, Inc. | 72 | 140 | 105.76 |
| Datadog, Inc. | 105 | 215 | 175.07 |
Uber’s consensus target price sits 51% above its current price of $69.99, signaling substantial upside. Datadog’s target consensus exceeds its $125.20 market price by 40%, indicating robust analyst optimism.

Don’t Let Luck Decide Your Entry Point
Optimize your entry points with our advanced ProRealTime indicators. You’ll get efficient buy signals with precise price targets for maximum performance. Start outperforming now!
How do institutions grade them?
The following tables summarize the latest institutional grades for Uber Technologies, Inc. and Datadog, Inc.:
Uber Technologies, Inc. Grades
This table lists recent grades from major financial institutions for Uber Technologies, Inc.
| Grading Company | Action | New Grade | Date |
|---|---|---|---|
| Citigroup | Maintain | Buy | 2026-02-06 |
| Morgan Stanley | Maintain | Overweight | 2026-02-05 |
| Wedbush | Maintain | Neutral | 2026-02-05 |
| Benchmark | Maintain | Hold | 2026-02-05 |
| JP Morgan | Maintain | Overweight | 2026-02-05 |
| Citizens | Upgrade | Market Outperform | 2026-02-05 |
| RBC Capital | Maintain | Outperform | 2026-02-05 |
| Wells Fargo | Maintain | Overweight | 2026-02-05 |
| Mizuho | Maintain | Outperform | 2026-02-05 |
| Needham | Maintain | Buy | 2026-02-05 |
Datadog, Inc. Grades
The following table presents current institutional grades for Datadog, Inc.
| Grading Company | Action | New Grade | Date |
|---|---|---|---|
| DA Davidson | Maintain | Buy | 2026-02-11 |
| Macquarie | Maintain | Outperform | 2026-02-11 |
| Barclays | Maintain | Overweight | 2026-02-11 |
| Rosenblatt | Maintain | Buy | 2026-02-11 |
| Raymond James | Maintain | Outperform | 2026-02-11 |
| Scotiabank | Maintain | Sector Outperform | 2026-02-11 |
| RBC Capital | Maintain | Outperform | 2026-02-11 |
| Wedbush | Maintain | Outperform | 2026-02-11 |
| Citizens | Maintain | Market Perform | 2026-02-11 |
| BTIG | Maintain | Buy | 2026-02-10 |
Which company has the best grades?
Datadog, Inc. receives consistently stronger grades, with multiple “Outperform” and “Buy” ratings. Uber’s grades range more broadly from “Hold” to “Buy” and “Outperform.” Investors may view Datadog as having more robust institutional support.
Risks specific to each company
The following categories identify the critical pressure points and systemic threats facing both firms in the 2026 market environment:
1. Market & Competition
Uber Technologies, Inc.
- Faces intense competition in mobility and delivery sectors, requiring constant innovation to maintain market share.
Datadog, Inc.
- Operates in a highly competitive cloud monitoring industry with rapid technology shifts and pressure from larger cloud providers.
2. Capital Structure & Debt
Uber Technologies, Inc.
- Maintains a moderate debt level with favorable coverage ratios, supporting financial stability.
Datadog, Inc.
- Also keeps moderate debt but shows weaker financial ratios, signaling higher risk in capital structure.
3. Stock Volatility
Uber Technologies, Inc.
- Beta of 1.21 indicates moderate volatility, typical for tech firms with diversified operations.
Datadog, Inc.
- Higher beta at 1.29 reflects greater stock price sensitivity to market swings and investor sentiment.
4. Regulatory & Legal
Uber Technologies, Inc.
- Faces ongoing regulatory scrutiny in multiple jurisdictions on labor laws and data privacy.
Datadog, Inc.
- Subject to data security and privacy regulations, with potential risks from evolving compliance demands.
5. Supply Chain & Operations
Uber Technologies, Inc.
- Operational risks include driver availability and delivery logistics in diverse global markets.
Datadog, Inc.
- Relies heavily on cloud infrastructure providers, exposing it to third-party service disruptions.
6. ESG & Climate Transition
Uber Technologies, Inc.
- Pressured to reduce carbon footprint in transportation and improve labor conditions.
Datadog, Inc.
- Faces ESG scrutiny mainly on data center energy use and corporate governance standards.
7. Geopolitical Exposure
Uber Technologies, Inc.
- Broad global footprint exposes Uber to geopolitical instability and regulatory changes worldwide.
Datadog, Inc.
- More concentrated in North America but still exposed to international trade tensions affecting cloud services.
Which company shows a better risk-adjusted profile?
Uber’s strongest risk lies in regulatory and operational complexity across its global mobility and delivery network. Datadog’s primary risk is valuation pressure compounded by weak profitability metrics and competitive cloud market dynamics. Uber’s financial stability and diverse revenue streams give it a better risk-adjusted profile. Datadog’s very high P/E ratio and unfavorable profitability raise caution amid market volatility.
Final Verdict: Which stock to choose?
Uber Technologies, Inc. wields a powerful value creation engine, consistently delivering returns well above its cost of capital. Its superpower lies in efficient capital allocation and improving profitability, signaling a robust economic moat. The main point of vigilance remains its relatively high price-to-book ratio. Uber suits investors seeking aggressive growth with solid fundamentals.
Datadog, Inc. commands a strategic moat through its cloud-native monitoring platform, offering recurring revenue stability. While its profitability lags Uber’s, Datadog presents a safer liquidity profile with a strong current ratio and manageable debt. It fits well in portfolios targeting GARP—growth at a reasonable price—where innovation meets financial prudence.
If you prioritize sustainable economic value and operational efficiency, Uber outshines with superior ROIC and income growth. However, if you seek cloud exposure with better liquidity and a slightly more defensive stance, Datadog offers better stability despite its valuation premium. Both present meaningful scenarios aligned with distinct investor appetites.
Disclaimer: Investment carries a risk of loss of initial capital. The past performance is not a reliable indicator of future results. Be sure to understand risks before making an investment decision.
Go Further
I encourage you to read the complete analyses of Uber Technologies, Inc. and Datadog, Inc. to enhance your investment decisions: