Home > Comparison > Technology > DDOG vs TYL
The strategic rivalry between Datadog, Inc. and Tyler Technologies, Inc. defines the evolving landscape of enterprise software solutions. Datadog excels as a cloud-native monitoring platform, driving real-time observability in dynamic IT environments. Tyler Technologies, by contrast, delivers comprehensive public sector management software with deep vertical integration. This analysis pits Datadog’s growth-centric, scalable SaaS model against Tyler’s stable, niche-focused approach to determine the superior risk-adjusted investment opportunity.
Table of contents
Companies Overview
Datadog and Tyler Technologies play pivotal roles in the software application market with distinct service models.
Datadog, Inc.: Cloud Monitoring Powerhouse
Datadog dominates as a cloud-based monitoring and analytics platform. It generates revenue by offering SaaS tools for real-time observability across IT infrastructure, applications, and security. In 2026, its strategic focus sharpens on expanding cloud security and developer observability, reinforcing its competitive edge in integrated monitoring solutions.
Tyler Technologies, Inc.: Public Sector Software Leader
Tyler Technologies specializes in integrated information management solutions for public sector clients. Revenue stems from software for financial management, judicial systems, tax, and public safety, plus SaaS offerings. In 2026, Tyler emphasizes broadening cloud hosting through AWS collaboration, enhancing public sector digital transformation with a focus on modular, scalable software suites.
Strategic Collision: Similarities & Divergences
Both firms excel in software-as-a-service models but target vastly different customers—Datadog serves cloud-native enterprises, while Tyler focuses on public agencies. Their primary battleground is digital transformation, with Datadog excelling in infrastructure monitoring and Tyler in public sector operations. Their investment profiles diverge: Datadog rides cloud innovation volatility, Tyler offers steady growth tied to government contracts.
Income Statement Comparison
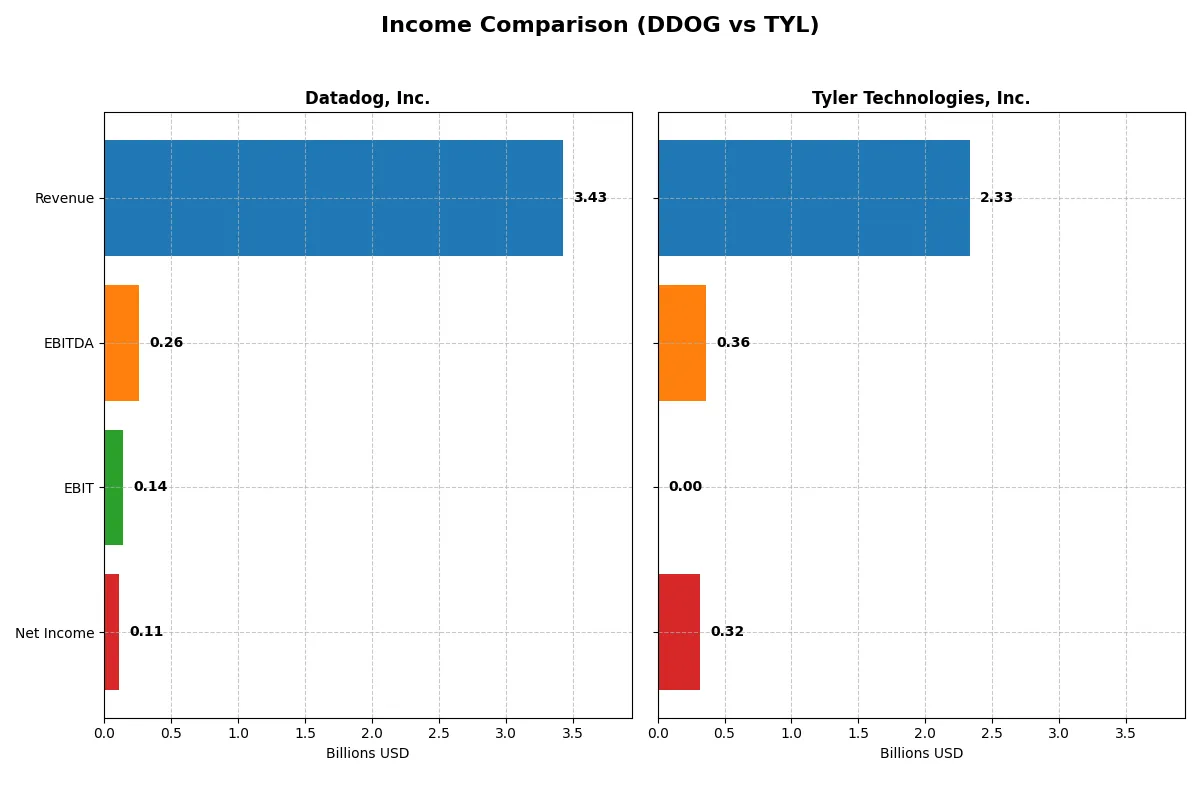
This data dissects the core profitability and scalability of both corporate engines to reveal who dominates the bottom line:
| Metric | Datadog, Inc. (DDOG) | Tyler Technologies, Inc. (TYL) |
|---|---|---|
| Revenue | 3.43B | 2.33B |
| Cost of Revenue | 687M | 1.25B |
| Operating Expenses | 2.78B | 670M |
| Gross Profit | 2.74B | 1.08B |
| EBITDA | 261M | 358M |
| EBIT | 138M | 0 |
| Interest Expense | 11M | -5M |
| Net Income | 108M | 316M |
| EPS | 0.31 | 7.32 |
| Fiscal Year | 2025 | 2025 |
Income Statement Analysis: The Bottom-Line Duel
This income statement comparison reveals which company runs a more efficient and profitable business engine through their revenue and net income performance.
Datadog, Inc. Analysis
Datadog’s revenue surged from 1.03B in 2021 to 3.43B in 2025, reflecting rapid growth. Its gross margin remains strong at nearly 80%, indicating excellent cost control on sales. However, net income shows volatility, with a sharp dip in 2025 to 108M, despite overall margin improvement, signaling pressure on operating expenses.
Tyler Technologies, Inc. Analysis
Tyler’s revenue grew steadily from 1.59B in 2021 to 2.33B in 2025, with a healthy gross margin of 46.5%. The company sustained solid net margin expansion to 13.5%, yielding 316M net income in 2025. Despite flat EBIT margin and slower revenue growth, efficiency gains and consistent profitability stand out.
Margin Strength vs. Growth Trajectory
Datadog excels in revenue scale and gross margin superiority but struggles with operating efficiency and net income consistency. Tyler delivers steadier profit margins and reliable net income growth, though at a moderate revenue pace. For investors prioritizing margin stability, Tyler’s profile appears more attractive, while Datadog suits those chasing rapid top-line expansion with higher risk.
Financial Ratios Comparison
These vital ratios act as a diagnostic tool to expose the underlying fiscal health, valuation premiums, and capital efficiency of these companies:
| Ratios | Datadog, Inc. (DDOG) | Tyler Technologies, Inc. (TYL) |
|---|---|---|
| ROE | 2.89% | N/A |
| ROIC | -0.74% | N/A |
| P/E | 438.4x | 62.0x |
| P/B | 12.65x | N/A |
| Current Ratio | 3.38 | 0 |
| Quick Ratio | 3.38 | 0 |
| D/E | 0.41 | 0 |
| Debt-to-Assets | 23.1% | 0 |
| Interest Coverage | -4.01x | -71.61x |
| Asset Turnover | 0.52 | 0 |
| Fixed Asset Turnover | 6.20 | 0 |
| Payout ratio | 0% | 0% |
| Dividend yield | 0% | 0% |
| Fiscal Year | 2025 | 2025 |
Efficiency & Valuation Duel: The Vital Signs
Financial ratios act as the company’s DNA, uncovering hidden risks and operational strengths that shape investor confidence and valuation.
Datadog, Inc.
Datadog’s profitability metrics show weak ROE at 2.9% and a net margin of 3.1%, signaling operational struggles. Its valuation is stretched with an extreme P/E of 438. The company reinvests heavily in R&D, foregoing dividends to fuel growth, which reflects a long-term expansion strategy despite current profitability challenges.
Tyler Technologies, Inc.
Tyler presents a stronger net margin at 13.5%, yet reports zero ROE and ROIC, indicating mixed operational efficiency. Its P/E of 62 remains high, implying elevated growth expectations. Tyler maintains no dividend, focusing on internal capital deployment. However, several liquidity and asset turnover ratios are unfavorable, suggesting operational constraints.
Premium Valuation vs. Operational Safety
Datadog exhibits stretched valuation but invests aggressively in innovation, while Tyler shows better margin stability but lacks clear return on equity and efficiency. Datadog’s profile suits growth-focused investors; Tyler appeals to those prioritizing margin safety amid operational headwinds.
Which one offers the Superior Shareholder Reward?
Datadog and Tyler Technologies both forgo dividends, focusing on reinvestment and buybacks for shareholder reward. Datadog’s zero dividend yield contrasts with Tyler’s aggressive free cash flow-backed buybacks. Datadog’s payout ratio is zero, while Tyler sustains a buyback program covering nearly all free cash flow (14.8B FCF per share). Tyler’s more moderate P/E (~62 vs. Datadog’s 438) and higher net margin (13.5% vs. 3.1%) signal better profitability. I see Tyler’s steady buybacks and healthier margins as a more sustainable model for long-term value. Datadog’s elevated valuation and lack of distributions increase risk. For 2026 investors, Tyler Technologies offers the superior total return profile, balancing growth and prudent capital allocation.
Comparative Score Analysis: The Strategic Profile
The radar chart reveals the fundamental DNA and trade-offs of Datadog, Inc. and Tyler Technologies, Inc., highlighting their strategic strengths and weaknesses:
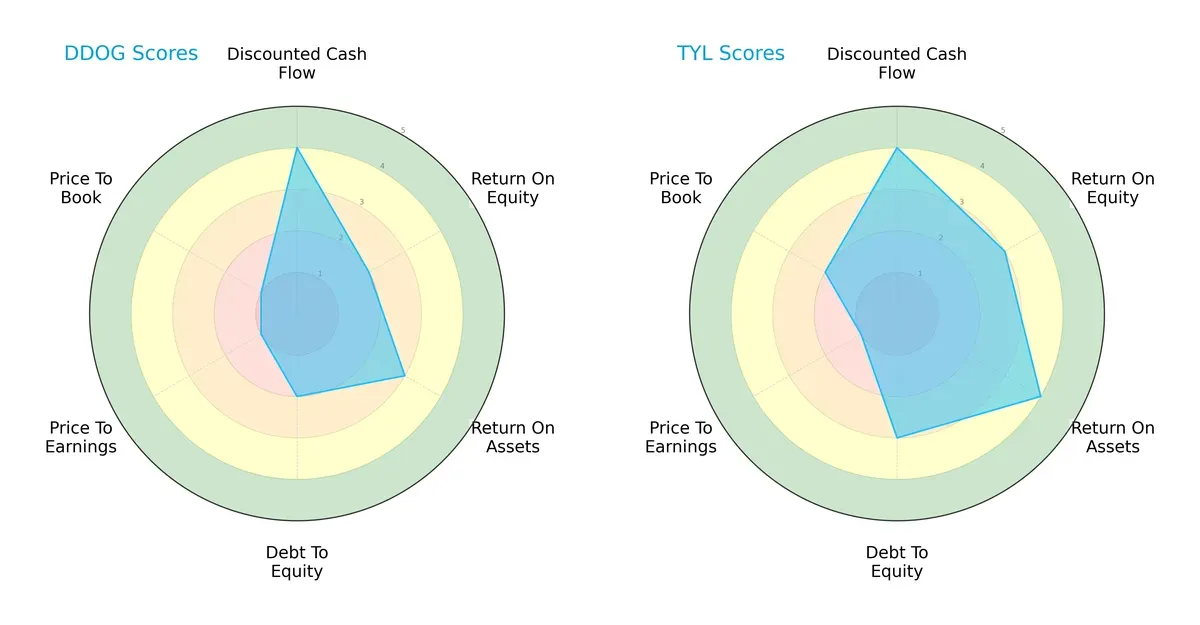
Datadog shows a polarized profile with strong DCF but weak ROE, debt management, and valuation. Tyler boasts a more balanced scorecard, excelling in ROE, ROA, and debt control. Tyler’s diversified strengths suggest steadier fundamentals, while Datadog leans heavily on future cash flow potential.
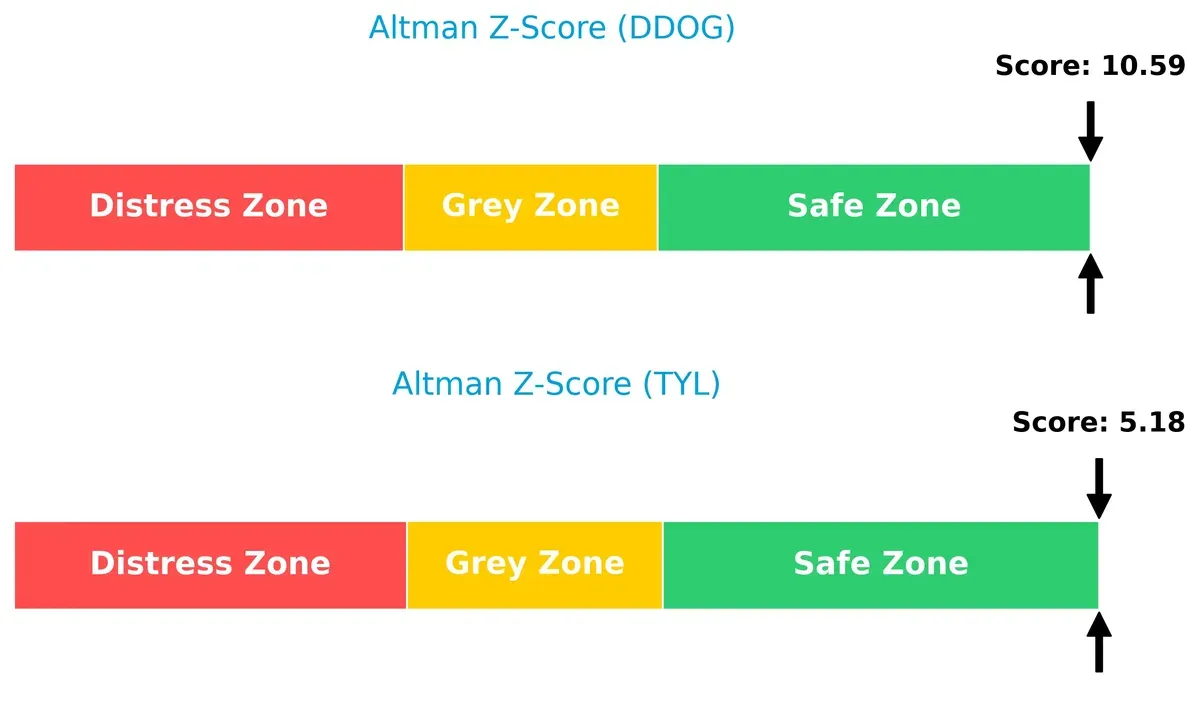
Bankruptcy Risk: Solvency Showdown
Tyler Technologies and Datadog both reside safely above distress thresholds, but Datadog’s Altman Z-Score of 10.6 far exceeds Tyler’s 5.2, signaling a more robust margin against bankruptcy risk in this cycle:
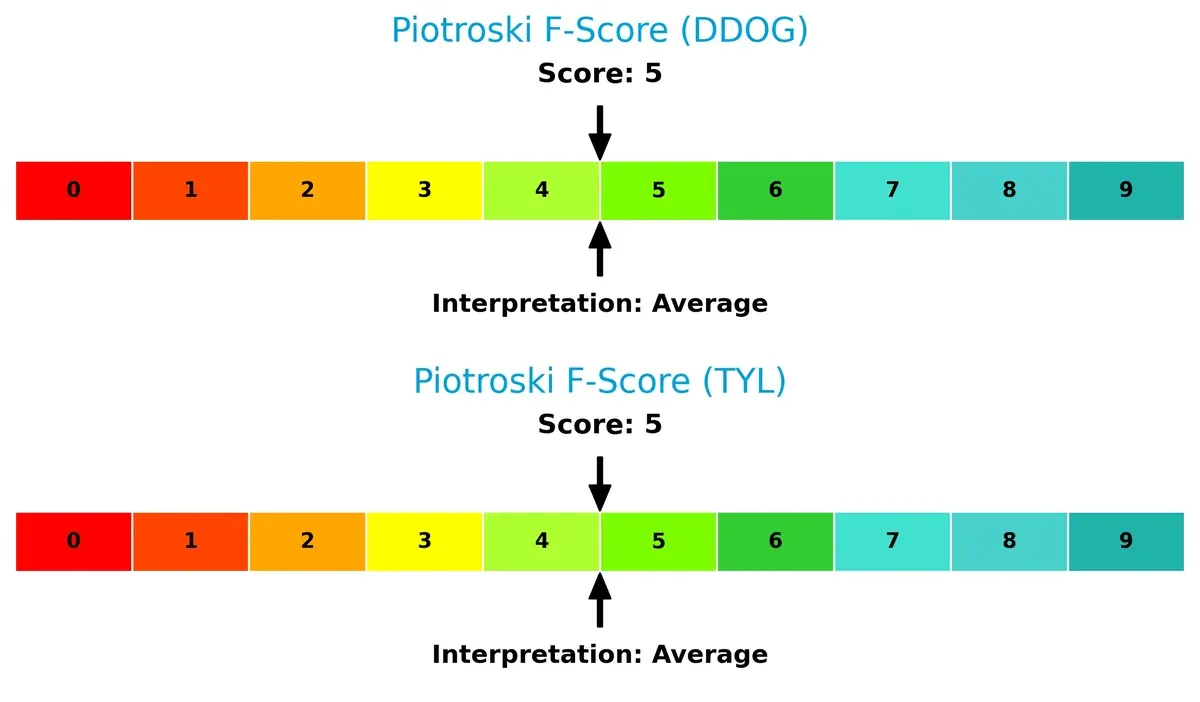
Financial Health: Quality of Operations
Both companies share an average Piotroski F-Score of 5, indicating moderate financial health. Neither shows critical red flags, but neither excels in operational quality either, suggesting room for improvement in internal efficiency:
How are the two companies positioned?
This section dissects the operational DNA of Datadog and Tyler by comparing their revenue distribution and internal dynamics. The goal is to confront their economic moats and identify which model offers the most resilient competitive advantage today.
Revenue Segmentation: The Strategic Mix
This comparison dissects how Datadog, Inc. and Tyler Technologies, Inc. diversify income streams and where their primary sector bets lie:
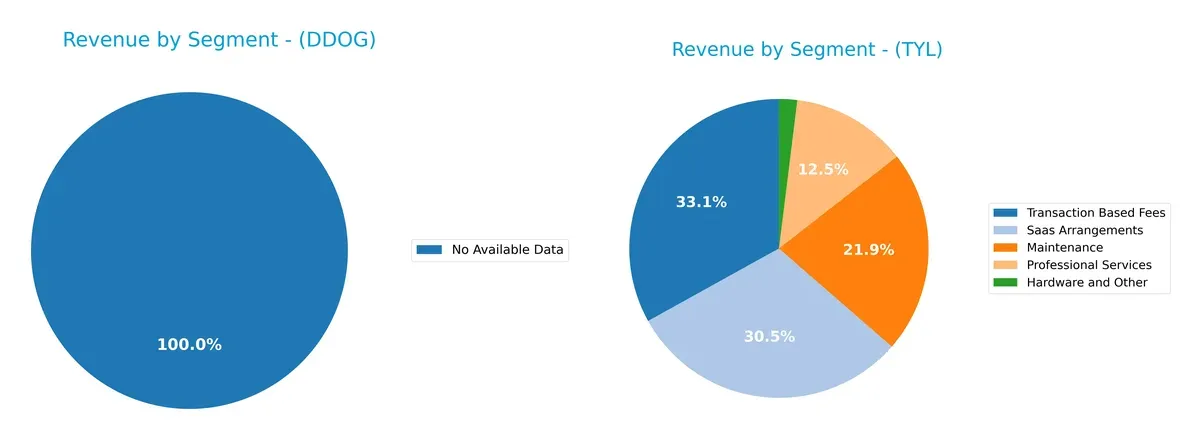
Datadog, Inc. lacks available segmentation data, preventing revenue concentration analysis. Tyler Technologies, Inc. displays a balanced mix with significant revenue from Transaction Based Fees ($698M), SaaS Arrangements ($645M), and Maintenance ($463M). This diversification anchors Tyler’s ecosystem lock-in strategy, reducing concentration risk. Tyler’s varied streams contrast sharply with Datadog’s unknown segmentation, highlighting Tyler’s infrastructure dominance and prudent capital allocation across sectors.
Strengths and Weaknesses Comparison
This table compares the Strengths and Weaknesses of Datadog, Inc. (DDOG) and Tyler Technologies, Inc. (TYL):
DDOG Strengths
- Strong global presence with $1.87B North America and $810M international revenue
- Favorable debt management with low debt-to-assets at 23%
- High quick ratio at 3.38 indicating liquidity
- Efficient fixed asset turnover at 6.2
TYL Strengths
- Diverse product segments including SaaS, professional services, and transaction fees
- Favorable price-to-book ratio at 0
- Strong net margin at 13.53% reflecting profitability
- Favorable debt-to-assets ratio at 0%
DDOG Weaknesses
- Unfavorable profitability ratios: net margin 3.14%, ROE 2.89%, ROIC -0.74%
- High valuation multiples: PE 438.37, PB 12.65
- Slightly unfavorable overall ratio evaluation at 35.7% favorable
TYL Weaknesses
- Unavailable WACC and negative interest coverage raise financial risk concerns
- Zero current and quick ratios indicate liquidity issues
- Unfavorable asset turnover and fixed asset turnover at 0
- Unfavorable PE at 61.99 and zero dividend yield
Both companies demonstrate clear financial and operational contrasts. DDOG shows strength in liquidity and asset efficiency but struggles with profitability and valuation. TYL benefits from product diversification and profitability but faces liquidity and operational efficiency challenges. These factors shape their strategic priorities moving forward.
The Moat Duel: Analyzing Competitive Defensibility
A structural moat is the sole barrier protecting long-term profits from competitors’ relentless pressure and market shifts:
Datadog, Inc.: Network Effects Powerhouse
Datadog’s moat hinges on strong network effects through its integrated SaaS observability platform. This drives high gross margins (~80%) and stable revenue growth (27.7% in 2025). However, negative ROIC vs. WACC signals value erosion despite rising profitability. New cloud security features could deepen this moat in 2026 but competition intensifies.
Tyler Technologies, Inc.: Public Sector Integration Specialist
Tyler’s moat stems from deep entrenchment in public sector software, creating high switching costs. Unlike Datadog, Tyler delivers a robust net margin (13.5%) and consistent revenue growth (9.1%), though ROIC trends show decline. Expansion into judicial and tax systems offers growth, but margin pressure and slowing ROIC pose risks.
Network Effects vs. Switching Costs: The Moat Battle
Datadog’s network effect moat is wider but currently sheds value, while Tyler’s switching cost moat is narrower yet financially steadier. I see Tyler better positioned to defend market share amid economic uncertainty, but Datadog’s innovation pipeline could shift dynamics by 2027.
Which stock offers better returns?
Datadog, Inc. and Tyler Technologies, Inc. showed contrasting price movements over the past year, highlighting distinct trading dynamics and volume trends.
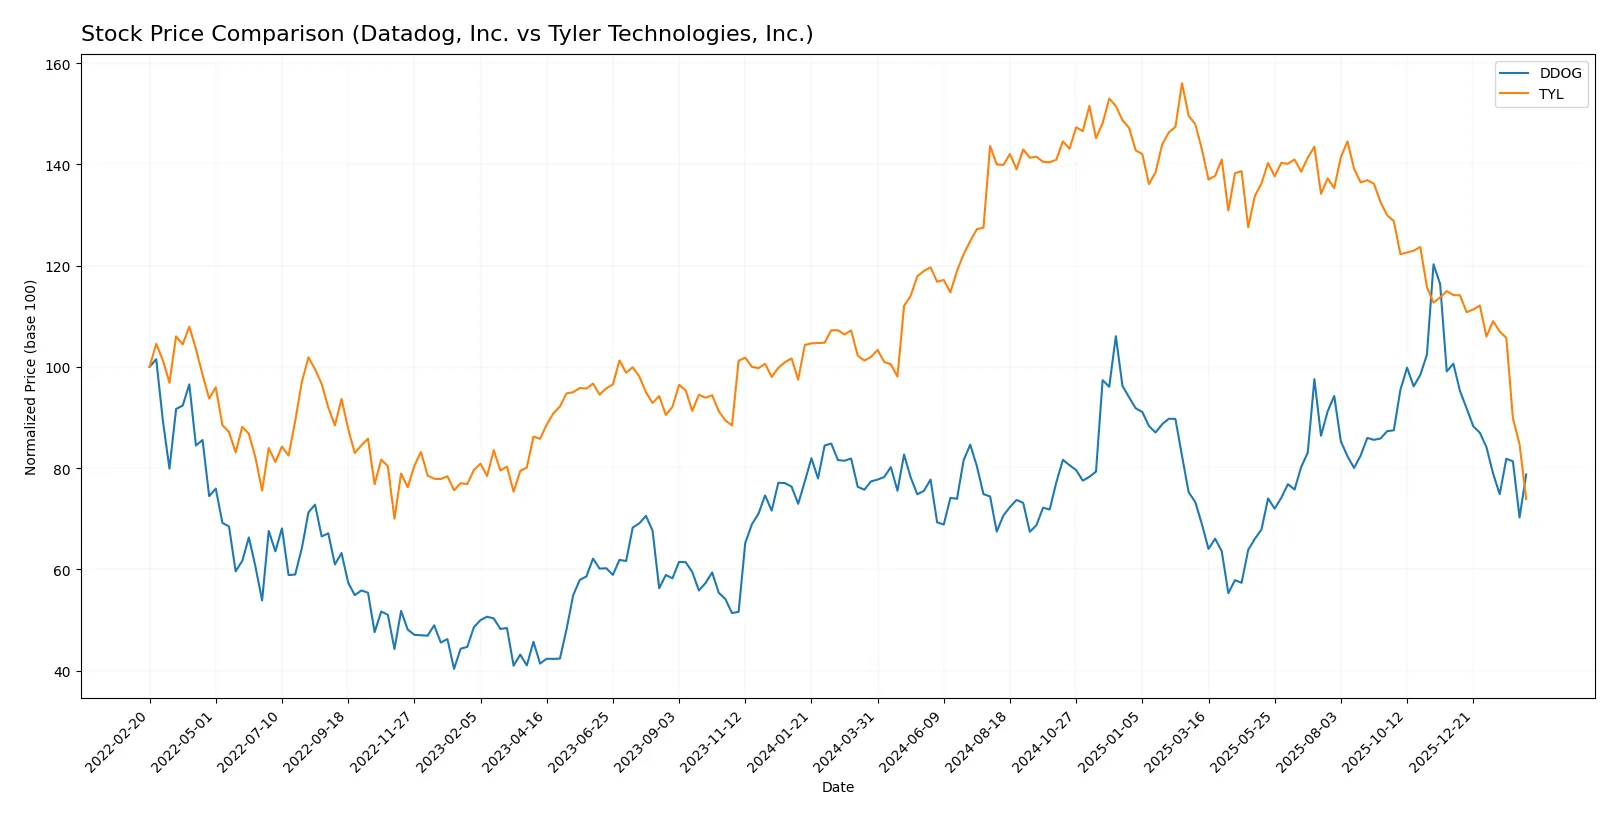
Trend Comparison
Datadog’s stock increased 1.77% over the past 12 months, signaling a mild bullish trend with decelerating momentum. The price ranged from a low of 87.93 to a high of 191.24, with volatility measured by a standard deviation of 18.68.
Tyler Technologies’ stock declined 27.51% over the same period, reflecting a bearish trend with deceleration. It experienced higher volatility, with a standard deviation of 68.01 and price fluctuations between 303.94 and 641.7.
Comparing both, Datadog delivered the highest market performance with a slight positive return, while Tyler Technologies faced significant losses and greater volatility.
Target Prices
Analysts project solid upside potential for both Datadog, Inc. and Tyler Technologies, Inc. based on current consensus targets.
| Company | Target Low | Target High | Consensus |
|---|---|---|---|
| Datadog, Inc. | 105 | 215 | 175.07 |
| Tyler Technologies, Inc. | 325 | 675 | 473.91 |
Datadog’s consensus target of 175.07 suggests a 40% upside from the current 125.2 price, reflecting confidence in its cloud monitoring platform. Tyler Technologies’ target consensus near 474 implies a 56% gain from 303.94, signaling strong growth expectations in public sector software solutions.

Don’t Let Luck Decide Your Entry Point
Optimize your entry points with our advanced ProRealTime indicators. You’ll get efficient buy signals with precise price targets for maximum performance. Start outperforming now!
How do institutions grade them?
Datadog, Inc. Grades
The following table summarizes recent institutional grades for Datadog, Inc.:
| Grading Company | Action | New Grade | Date |
|---|---|---|---|
| DA Davidson | Maintain | Buy | 2026-02-11 |
| Macquarie | Maintain | Outperform | 2026-02-11 |
| Barclays | Maintain | Overweight | 2026-02-11 |
| Rosenblatt | Maintain | Buy | 2026-02-11 |
| Raymond James | Maintain | Outperform | 2026-02-11 |
| Scotiabank | Maintain | Sector Outperform | 2026-02-11 |
| RBC Capital | Maintain | Outperform | 2026-02-11 |
| Wedbush | Maintain | Outperform | 2026-02-11 |
| Citizens | Maintain | Market Perform | 2026-02-11 |
| BTIG | Maintain | Buy | 2026-02-10 |
Tyler Technologies, Inc. Grades
The following table summarizes recent institutional grades for Tyler Technologies, Inc.:
| Grading Company | Action | New Grade | Date |
|---|---|---|---|
| Oppenheimer | Maintain | Outperform | 2026-02-13 |
| Piper Sandler | Maintain | Overweight | 2026-02-13 |
| Needham | Maintain | Buy | 2026-02-13 |
| TD Cowen | Maintain | Buy | 2026-02-13 |
| Evercore ISI Group | Maintain | In Line | 2026-02-13 |
| Wells Fargo | Maintain | Equal Weight | 2026-02-13 |
| Barclays | Maintain | Overweight | 2026-02-13 |
| Stifel | Maintain | Buy | 2026-02-13 |
| DA Davidson | Upgrade | Buy | 2026-02-11 |
| BTIG | Maintain | Buy | 2026-02-09 |
Which company has the best grades?
Datadog receives predominantly “Outperform” and “Buy” ratings from leading firms, indicating strong institutional confidence. Tyler also earns mostly “Buy” and “Overweight” grades but includes some “In Line” and “Equal Weight” ratings, suggesting slightly more cautious views. Investors may interpret Datadog’s grades as reflecting broader enthusiasm and potentially higher growth expectations.
Risks specific to each company
The following categories identify the critical pressure points and systemic threats facing both firms in the 2026 market environment:
1. Market & Competition
Datadog, Inc.
- Faces intense competition in cloud monitoring and SaaS with rapid innovation cycles.
Tyler Technologies, Inc.
- Operates in a niche public sector software market with slower innovation but political dependency risks.
2. Capital Structure & Debt
Datadog, Inc.
- Maintains moderate leverage (D/E 0.41) with favorable interest coverage (12.49x).
Tyler Technologies, Inc.
- Shows no reported debt, indicating a conservative capital structure but possible under-leveraging.
3. Stock Volatility
Datadog, Inc.
- Beta at 1.29 signals above-market volatility, typical for tech growth firms.
Tyler Technologies, Inc.
- Lower beta 0.90 indicates less volatility and defensive stock characteristics.
4. Regulatory & Legal
Datadog, Inc.
- Subject to data privacy and cloud security regulations globally, increasing compliance costs.
Tyler Technologies, Inc.
- Faces regulatory scrutiny on public sector contracting and government budget cycles.
5. Supply Chain & Operations
Datadog, Inc.
- Relies on cloud infrastructure partnerships but benefits from scalable SaaS model.
Tyler Technologies, Inc.
- Dependent on government IT budgets and slower procurement processes.
6. ESG & Climate Transition
Datadog, Inc.
- Under pressure to demonstrate sustainability in cloud energy usage and data center efficiency.
Tyler Technologies, Inc.
- Increasing demands for transparency in public sector ESG reporting and software impact.
7. Geopolitical Exposure
Datadog, Inc.
- Global footprint exposes it to trade tensions and regulatory divergences.
Tyler Technologies, Inc.
- Primarily US-focused, limiting geopolitical risks but increasing domestic policy sensitivity.
Which company shows a better risk-adjusted profile?
Datadog grapples with high valuation multiples and operational risks but benefits from strong liquidity and moderate leverage. Tyler suffers from capital inefficiencies and limited growth visibility yet displays lower stock volatility and a conservative debt profile. Tyler’s stable niche and less volatile stock suggest a better risk-adjusted profile. However, Tyler’s lack of debt and low asset turnover signal potential underutilization of capital. Datadog’s biggest risk is its stretched valuation versus weak profitability. Tyler’s key risk lies in its operational reliance on government budgets, which can tighten unexpectedly. Recent ratio data highlight Datadog’s unfavorable ROIC and high P/E, underscoring valuation dangers. Tyler’s zero debt reduces financial risk but raises concerns about growth capital deployment. Overall, Tyler edges out Datadog on risk metrics amid current market dynamics.
Final Verdict: Which stock to choose?
Datadog’s superpower lies in its rapid revenue growth and expanding profitability, reflecting a strong product-market fit in cloud monitoring. However, its negative return on invested capital signals value destruction, a point of vigilance that may concern value-focused investors. It suits aggressive growth portfolios willing to tolerate near-term inefficiencies for long-term scale.
Tyler Technologies boasts a strategic moat through its niche in government software solutions, offering recurring revenue stability and solid net margins. Relative to Datadog, Tyler presents a safer profile with stronger balance sheet signals, though its declining ROIC trend tempers enthusiasm. It fits well within GARP portfolios seeking steady growth with moderate risk.
If you prioritize high-growth potential and can absorb operational inefficiencies, Datadog outshines as a compelling choice due to its accelerating top-line and improving profitability trends. However, if you seek better stability and recurring revenue predictability, Tyler offers superior risk management despite slower growth. Both demand careful monitoring of their distinct challenges.
Disclaimer: Investment carries a risk of loss of initial capital. The past performance is not a reliable indicator of future results. Be sure to understand risks before making an investment decision.
Go Further
I encourage you to read the complete analyses of Datadog, Inc. and Tyler Technologies, Inc. to enhance your investment decisions: