Home > Comparison > Technology > SHOP vs DDOG
The strategic rivalry between Shopify Inc. and Datadog, Inc. shapes the trajectory of the technology sector. Shopify operates as a commerce platform enabling merchants to sell across multiple channels. Datadog delivers a SaaS monitoring and analytics platform focused on cloud infrastructure and application performance. This analysis pits Shopify’s expansive e-commerce ecosystem against Datadog’s specialized observability tools to determine which offers superior risk-adjusted returns for a diversified portfolio.
Table of contents
Companies Overview
Shopify and Datadog lead critical software sectors, shaping commerce and cloud monitoring markets in 2026.
Shopify Inc.: Commerce Platform Powerhouse
Shopify Inc. dominates e-commerce infrastructure by enabling merchants to manage sales across multiple channels worldwide. Its platform generates revenue through subscription solutions and merchant services, including payments and fulfillment. In 2026, Shopify focuses on expanding merchant tools and financing options to deepen its ecosystem and enhance merchant retention globally.
Datadog, Inc.: Cloud Monitoring Innovator
Datadog, Inc. excels in cloud-based observability and monitoring for IT and development teams. Its SaaS platform drives revenue by integrating infrastructure, application, and security monitoring into a unified service. The company’s 2026 strategy emphasizes real-time analytics and automation to improve incident response and operational efficiency for enterprise clients.
Strategic Collision: Similarities & Divergences
Both firms leverage software-as-a-service models, yet Shopify centers on enabling commerce ecosystems, while Datadog prioritizes cloud infrastructure visibility. Their market battle unfolds in digital transformation—Shopify with merchants, Datadog with IT teams. Investors face distinct profiles: Shopify’s high beta reflects growth volatility; Datadog’s steadier beta signals more measured expansion in enterprise cloud services.
Income Statement Comparison
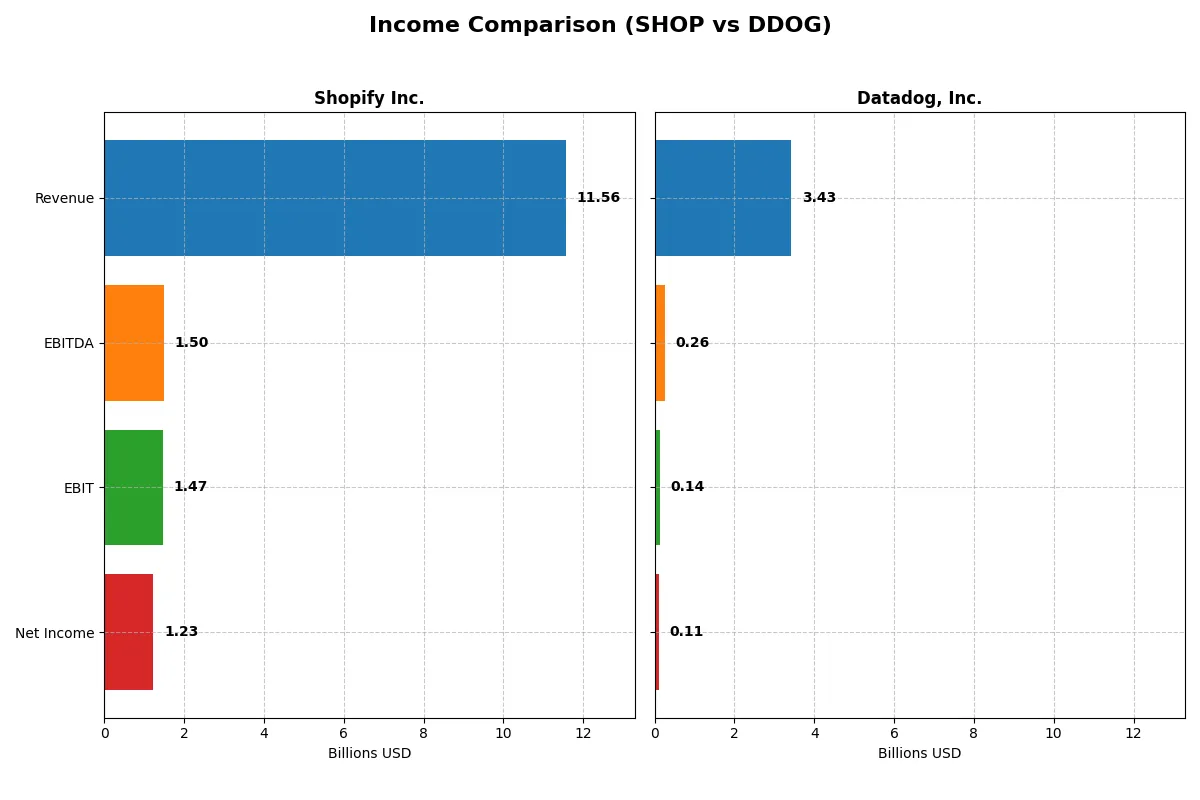
This data dissects the core profitability and scalability of both corporate engines to reveal who dominates the bottom line:
| Metric | Shopify Inc. (SHOP) | Datadog, Inc. (DDOG) |
|---|---|---|
| Revenue | 11.56B | 3.43B |
| Cost of Revenue | 6.00B | 687M |
| Operating Expenses | 4.09B | 2.78B |
| Gross Profit | 5.56B | 2.74B |
| EBITDA | 1.50B | 261M |
| EBIT | 1.47B | 138M |
| Interest Expense | 0 | 11M |
| Net Income | 1.23B | 108M |
| EPS | 0.95 | 0.31 |
| Fiscal Year | 2025 | 2025 |
Income Statement Analysis: The Bottom-Line Duel
This income statement comparison reveals how efficiently Shopify Inc. and Datadog, Inc. convert revenue into profit and sustain margin health in 2025.
Shopify Inc. Analysis
Shopify’s revenue surged to $11.56B in 2025, up 30% from 2024, but net income declined to $1.23B, a 39% drop year-over-year. Its gross margin remains strong at 48%, and the EBIT margin holds at a favorable 12.7%. Despite revenue momentum, net margin contraction signals rising costs or inefficiencies.
Datadog, Inc. Analysis
Datadog posted $3.43B revenue in 2025, growing 28% year-over-year, with net income at $108M, down 41%. The company boasts an impressive 80% gross margin but a modest 4% EBIT margin, reflecting high operating expenses. Net margin remains low at 3.1%, indicating ongoing pressure on profitability despite top-line growth.
Verdict: Margin Power vs. Revenue Scale
Shopify leads in absolute revenue and maintains healthier net and EBIT margins, showcasing scale and operational leverage. Datadog excels in gross margin and shows remarkable net income growth over five years but struggles with profitability this past year. Investors favor Shopify’s blend of scale and margin resilience over Datadog’s growth-at-all-costs profile.
Financial Ratios Comparison
These vital ratios act as a diagnostic tool to expose the underlying fiscal health, valuation premiums, and capital efficiency of the companies analyzed:
| Ratios | Shopify Inc. (SHOP) | Datadog, Inc. (DDOG) |
|---|---|---|
| ROE | 9.14% | 2.89% |
| ROIC | 15.7% | -0.74% |
| P/E | 170 | 438 |
| P/B | 15.5 | 12.7 |
| Current Ratio | 12.9 | 3.38 |
| Quick Ratio | 12.9 | 3.38 |
| D/E | 0.014 | 0.41 |
| Debt-to-Assets | 1.2% | 23.1% |
| Interest Coverage | 0 | -4.0 |
| Asset Turnover | 0.76 | 0.52 |
| Fixed Asset Turnover | 82.0 | 6.2 |
| Payout ratio | 0 | 0 |
| Dividend yield | 0 | 0 |
| Fiscal Year | 2025 | 2025 |
Efficiency & Valuation Duel: The Vital Signs
Financial ratios serve as a company’s DNA, unveiling hidden risks and operational strengths unseen in surface-level metrics.
Shopify Inc.
Shopify posts a solid net margin of 10.65% but a modest ROE of 9.14%, below ideal levels. Its P/E ratio at 170 signals an expensive stock, while a high P/S ratio and unfavorable ROIC versus WACC suggest stretched valuation. Shopify pays no dividend, instead investing heavily in R&D (13.3% of revenue), aiming for long-term growth.
Datadog, Inc.
Datadog’s profitability is weaker, with a 3.14% net margin and 2.89% ROE, indicating limited current returns. The P/E ratio of 438 reflects a highly priced stock relative to earnings. Despite this, Datadog maintains strong interest coverage and reinvests significantly in R&D (45.2% of revenue), foregoing dividends to fuel expansion.
Premium Valuation vs. Operational Safety
Both companies face high valuations and display slightly unfavorable overall ratio profiles. Shopify offers better profitability and operational efficiency but trades at elevated multiples. Datadog shows weaker returns but robust coverage ratios and aggressive reinvestment. Investors seeking operational safety may lean toward Shopify, while growth-oriented profiles might consider Datadog’s reinvestment approach.
Which one offers the Superior Shareholder Reward?
I observe that both Shopify Inc. (SHOP) and Datadog, Inc. (DDOG) do not pay dividends, focusing instead on reinvestment and growth. Shopify’s free cash flow per share stands at $1.55 with zero dividend payout, signaling full reinvestment into R&D and expansion. Datadog also retains all cash, with a free cash flow per share of $2.88, fueling its growth initiatives. Shopify’s payout ratio is zero, with a massive current ratio of 12.9, showing robust liquidity to sustain operations. Datadog’s current ratio is a healthy 3.38 but far lower than Shopify’s, reflecting a more balanced capital structure amid higher leverage (debt to equity 0.41 vs. Shopify’s 0.014). Buyback programs are modest or absent for both, indicating shareholder returns hinge predominantly on capital appreciation from reinvestment. Given Shopify’s superior operating margins (12.7% vs. Datadog’s 4%) and stronger liquidity, it offers a more sustainable model. However, Datadog’s higher free cash flow per share and aggressive reinvestment suggest higher growth potential but with elevated risk. For 2026, I favor Shopify’s stable, margin-rich platform for superior total return, balancing growth and prudence.
Comparative Score Analysis: The Strategic Profile
The radar chart reveals the fundamental DNA and trade-offs of Shopify Inc. and Datadog, Inc., highlighting their core financial strengths and vulnerabilities:
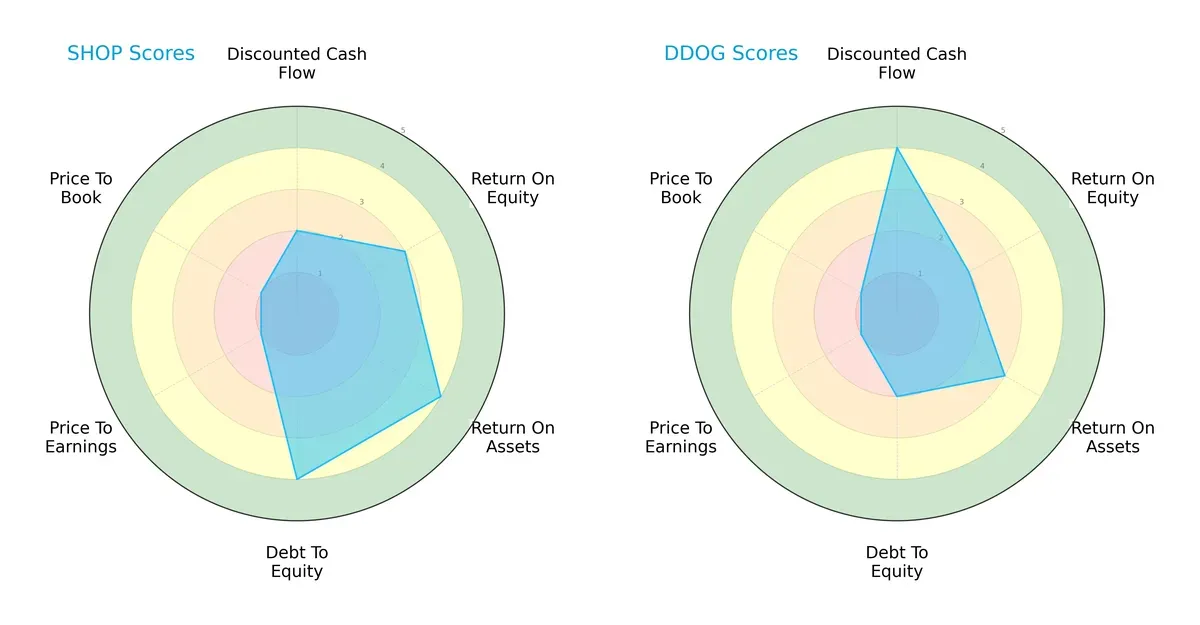
Shopify shows strength in return on assets (ROA) and debt-to-equity, signaling efficient asset use and a solid balance sheet. Datadog excels in discounted cash flow (DCF), suggesting strong future cash generation. Shopify’s higher return on equity (ROE) and more balanced profile contrast with Datadog’s reliance on cash flow projections but weaker leverage and profitability scores. Shopify appears the more stable choice, while Datadog leans on growth potential.
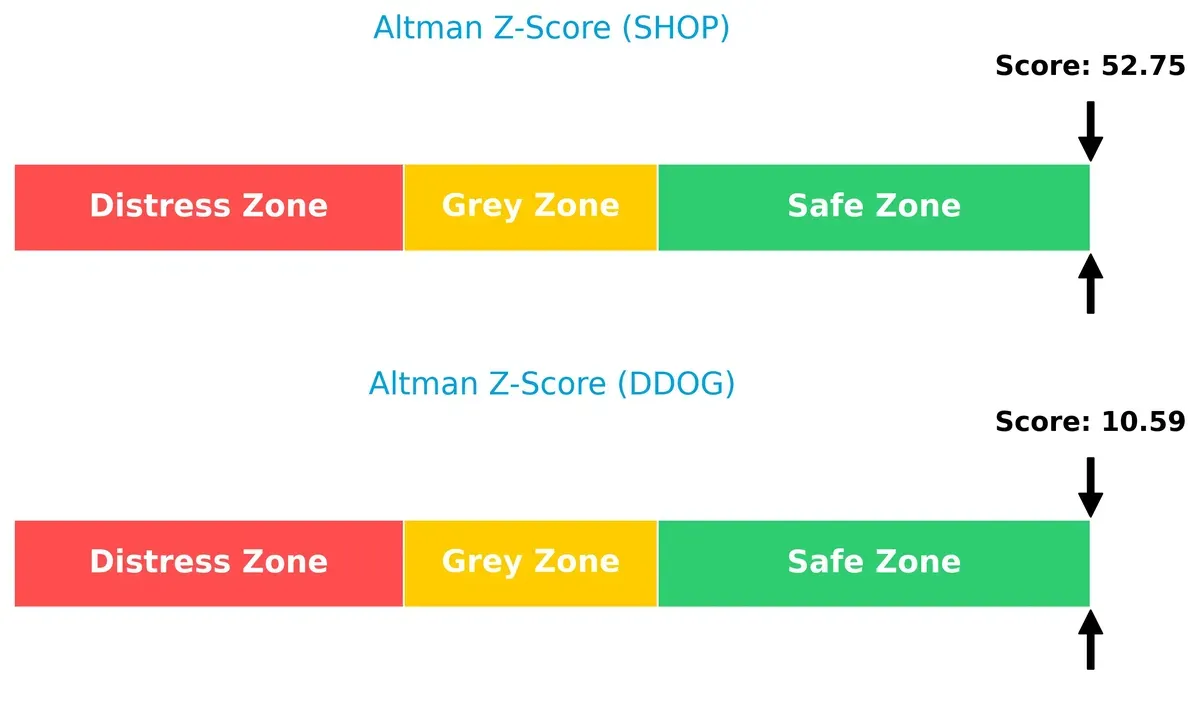
Bankruptcy Risk: Solvency Showdown
Shopify’s Altman Z-Score of 52.75 far surpasses Datadog’s 10.59, signaling a much safer position against bankruptcy risks in today’s volatile cycle:
Financial Health: Quality of Operations
Both firms hold average Piotroski F-Scores—Shopify at 6 and Datadog at 5—indicating moderate financial health without glaring red flags:
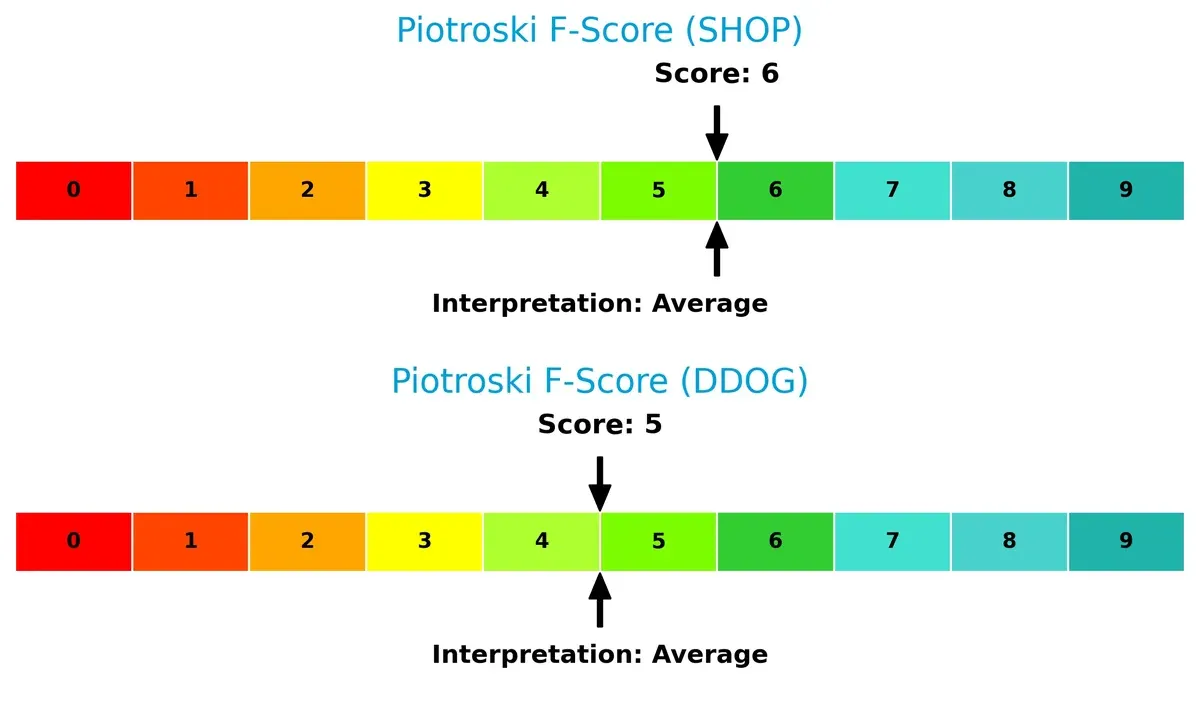
Shopify’s slightly higher score suggests marginally better operational quality, but neither shows severe internal weaknesses. Investors should watch for improvements to confirm durability.
How are the two companies positioned?
This section dissects the operational DNA of Shopify and Datadog by comparing their revenue distribution by segment and internal dynamics. The goal is to confront their economic moats and identify which model offers the most resilient and sustainable competitive advantage today.
Revenue Segmentation: The Strategic Mix
The following visual comparison dissects how both firms diversify their income streams and where their primary sector bets lie:
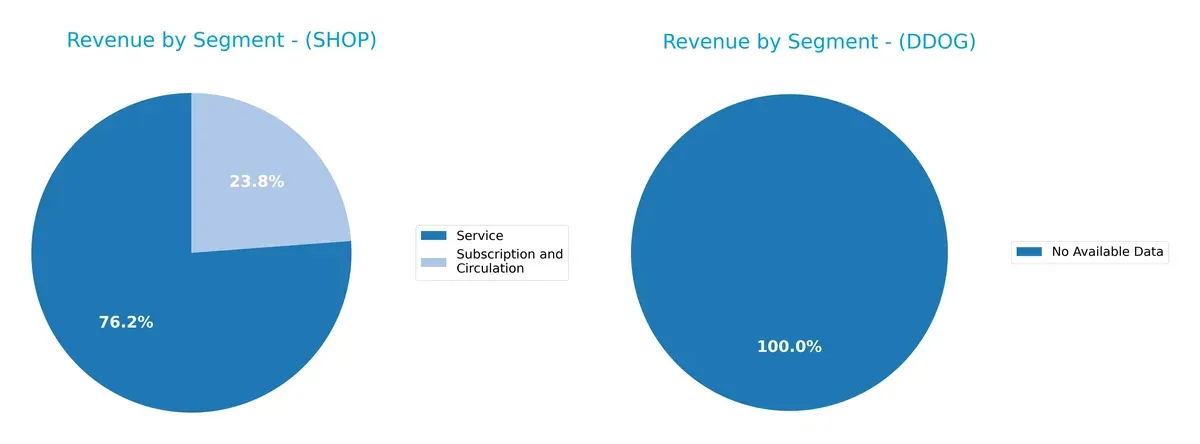
Shopify Inc. anchors its revenue in the Service segment with $8.8B in 2025, dwarfs its Subscription and Circulation at $2.75B. Datadog, Inc. lacks disclosed data, preventing segmentation comparison. Shopify’s heavy reliance on Services signals ecosystem lock-in potential but raises concentration risk. Its diversification into subscriptions offers some stability, yet the dominance of merchant-related services defines its strategic backbone.
Strengths and Weaknesses Comparison
This table compares the strengths and weaknesses of Shopify Inc. and Datadog, Inc.:
Shopify Inc. Strengths
- High net margin at 10.65%
- Extremely low debt-to-equity at 0.01
- Strong fixed asset turnover at 81.96
- Very high current and quick ratios indicating liquidity
- Diverse global revenue with strong US and EMEA presence
Datadog, Inc. Strengths
- Favorable debt metrics with 0.41 debt-to-equity
- Interest coverage at 12.49 supports debt servicing
- Positive fixed asset turnover at 6.2
- Quick ratio at 3.38 indicates good liquidity
- Expanding international and North American revenue
Shopify Inc. Weaknesses
- Return on equity and ROIC below WACC, indicating capital inefficiency
- Extremely high P/E and P/B ratios reflect overvaluation risk
- Current ratio unusually high, may signal asset management issues
- Zero dividend yield offers no income to investors
Datadog, Inc. Weaknesses
- Negative ROIC and low net margin at 3.14%
- Elevated P/E ratio at 438.37 suggests high growth expectations
- Current ratio at 3.38, less robust than Shopify’s liquidity
- Zero dividend yield limits shareholder income
Shopify’s strengths lie in strong profitability and liquidity, but its efficiency and valuation present concerns. Datadog shows solid capital structure and liquidity but faces profitability and valuation challenges. Both companies demonstrate slightly unfavorable financial ratios overall.
The Moat Duel: Analyzing Competitive Defensibility
A structural moat is the only reliable shield safeguarding long-term profits from relentless competitive erosion. Let’s dissect the moats of two tech players:
Shopify Inc.: Platform Power through Network Effects
Shopify’s moat hinges on strong network effects, linking merchants and customers seamlessly. This manifests in stable margins and 48% gross margin in 2025. Expansion into new markets and services could deepen its moat, but rising competition pressures margin growth.
Datadog, Inc.: Data-Driven Intangible Asset Moat
Datadog’s moat arises from its proprietary observability platform and rich data assets, differentiating it from Shopify’s commerce moat. Its 80% gross margin reflects pricing power, though slower EBIT growth signals margin pressure. Continued platform innovation may unlock new enterprise segments in 2026.
Moat Battle: Network Effects vs. Data Intangibles
Both firms are value destroyers relative to WACC but show improving ROIC trends. Shopify’s broader merchant ecosystem gives it a wider moat. Datadog’s moat is deeper in data analytics but narrower in scope. Shopify stands better poised to defend market share long term.
Which stock offers better returns?
Over the past 12 months, Shopify Inc. surged 43.17%, showing a bullish trend with decelerating gains. Datadog, Inc. gained a modest 1.77%, also bullish but near neutral territory.
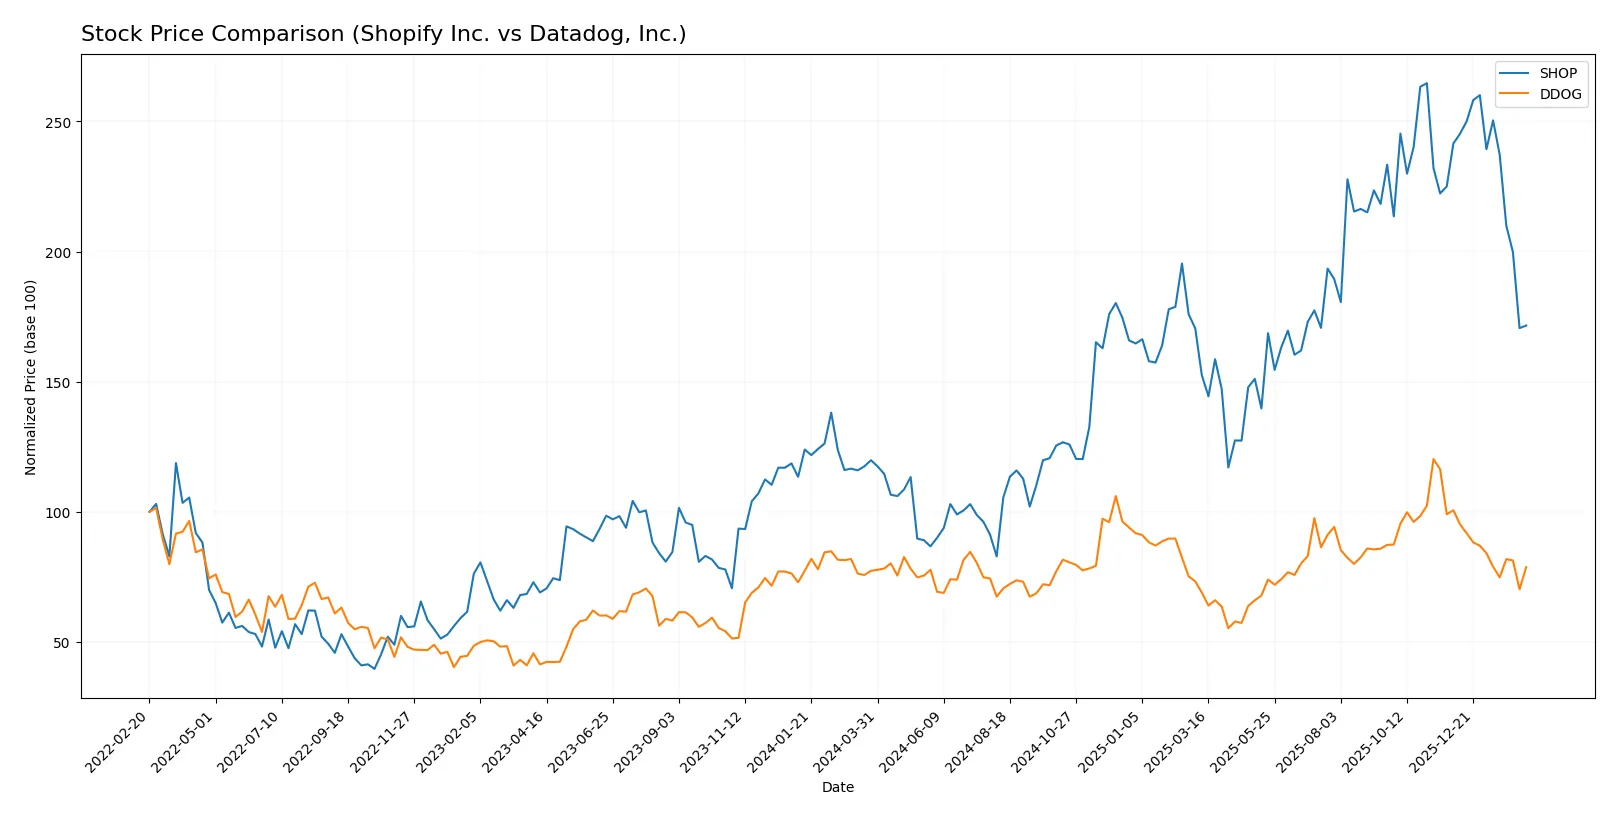
Trend Comparison
Shopify’s stock rose 43.17% over the past year, marking a bullish trend despite recent deceleration and a high volatility of 33.42%. The price ranged between 54.43 and 173.86.
Datadog’s stock increased 1.77% in 12 months, reflecting a neutral trend with deceleration and lower volatility of 18.68%. The price fluctuated between 87.93 and 191.24.
Shopify outperformed Datadog significantly in market gains, delivering higher returns and greater price appreciation over the analyzed period.
Target Prices
Analysts show a bullish outlook on Shopify Inc. and Datadog, Inc. with solid target price ranges.
| Company | Target Low | Target High | Consensus |
|---|---|---|---|
| Shopify Inc. | 115 | 200 | 167.04 |
| Datadog, Inc. | 105 | 215 | 175.07 |
Both stocks trade well below their consensus targets, implying significant upside potential based on analyst projections. Shopify’s current price of 112.7 and Datadog’s 125.2 suggest room for revaluation.

Don’t Let Luck Decide Your Entry Point
Optimize your entry points with our advanced ProRealTime indicators. You’ll get efficient buy signals with precise price targets for maximum performance. Start outperforming now!
How do institutions grade them?
Below is a summary of recent institutional grades for Shopify Inc. and Datadog, Inc.:
Shopify Inc. Grades
This table shows the latest grades from major financial institutions for Shopify Inc.
| Grading Company | Action | New Grade | Date |
|---|---|---|---|
| Citigroup | Maintain | Buy | 2026-02-13 |
| Wells Fargo | Maintain | Overweight | 2026-02-12 |
| Truist Securities | Maintain | Hold | 2026-02-12 |
| UBS | Maintain | Neutral | 2026-02-12 |
| Mizuho | Upgrade | Outperform | 2026-02-12 |
| Citizens | Maintain | Market Outperform | 2026-02-12 |
| RBC Capital | Maintain | Outperform | 2026-02-12 |
| BMO Capital | Maintain | Outperform | 2026-02-12 |
| Cantor Fitzgerald | Maintain | Neutral | 2026-02-12 |
| Barclays | Maintain | Equal Weight | 2026-02-12 |
Datadog, Inc. Grades
This table lists current institutional grades for Datadog, Inc. from reputable sources.
| Grading Company | Action | New Grade | Date |
|---|---|---|---|
| DA Davidson | Maintain | Buy | 2026-02-11 |
| Macquarie | Maintain | Outperform | 2026-02-11 |
| Barclays | Maintain | Overweight | 2026-02-11 |
| Rosenblatt | Maintain | Buy | 2026-02-11 |
| Raymond James | Maintain | Outperform | 2026-02-11 |
| Scotiabank | Maintain | Sector Outperform | 2026-02-11 |
| RBC Capital | Maintain | Outperform | 2026-02-11 |
| Wedbush | Maintain | Outperform | 2026-02-11 |
| Citizens | Maintain | Market Perform | 2026-02-11 |
| BTIG | Maintain | Buy | 2026-02-10 |
Which company has the best grades?
Both companies enjoy strong institutional support with multiple “Buy” and “Outperform” ratings. Shopify has a broader range, including some Neutral and Hold grades, while Datadog’s grades skew more consistently positive. This generally signals higher analyst confidence in Datadog’s near-term prospects, potentially attracting investors seeking stronger consensus momentum.
Risks specific to each company
The following categories identify the critical pressure points and systemic threats facing both firms in the 2026 market environment:
1. Market & Competition
Shopify Inc.
- Faces intense competition in e-commerce with giants like Amazon and emerging platforms.
Datadog, Inc.
- Competes in cloud monitoring against AWS, Microsoft, and new SaaS entrants.
2. Capital Structure & Debt
Shopify Inc.
- Extremely low debt (D/E 0.01), very strong balance sheet, minimal financial risk.
Datadog, Inc.
- Moderate leverage (D/E 0.41), manageable but higher financial risk than Shopify.
3. Stock Volatility
Shopify Inc.
- High beta (2.82) indicates significant stock price swings and market sensitivity.
Datadog, Inc.
- Moderate beta (1.29) suggests more stable stock price movement relative to market.
4. Regulatory & Legal
Shopify Inc.
- Subject to evolving e-commerce regulations globally, including data privacy and consumer protection.
Datadog, Inc.
- Faces regulatory scrutiny on data security and cloud services compliance worldwide.
5. Supply Chain & Operations
Shopify Inc.
- Complex logistics network prone to disruptions in global shipping and fulfillment.
Datadog, Inc.
- Relies on cloud infrastructure providers, vulnerable to outages and third-party risks.
6. ESG & Climate Transition
Shopify Inc.
- Increasing pressure to reduce carbon footprint in logistics and data centers.
Datadog, Inc.
- Needs to align SaaS operations with environmental standards amid investor ESG demands.
7. Geopolitical Exposure
Shopify Inc.
- Broad international presence exposes it to trade tensions and regional economic shocks.
Datadog, Inc.
- US-centric but expanding globally, facing risks from geopolitical tech restrictions.
Which company shows a better risk-adjusted profile?
Shopify’s minimal debt and robust liquidity buffer its high market volatility risk. Datadog’s moderate leverage and lower stock beta imply steadier volatility but expose it to greater financial risk. Shopify’s global supply chain and competitive pressures remain key risks, while Datadog must manage regulatory and geopolitical headwinds carefully. Overall, Shopify presents a stronger risk-adjusted profile due to balance sheet strength and liquidity despite higher stock volatility. The exceptional current ratio of 12.86 for Shopify contrasts with Datadog’s 3.38, underscoring Shopify’s superior short-term financial resilience.
Final Verdict: Which stock to choose?
Shopify Inc. impresses with its superpower of unmatched scalability and a robust cash conversion cycle, driving strong revenue growth. Its point of vigilance remains a high valuation multiple and return on capital just below cost, signaling caution. It suits aggressive growth portfolios willing to tolerate volatility for long-term gains.
Datadog, Inc. offers a strategic moat through its cloud monitoring dominance and resilient recurring revenue base. It presents a safer profile with better cash flow yields and a strong balance sheet relative to Shopify. This makes it appealing for GARP investors seeking growth balanced with financial discipline.
If you prioritize high-growth scalability and market disruption, Shopify stands out due to accelerating revenue and improving profitability trends despite valuation risks. However, if you seek steadier growth with a durable subscription moat and healthier capital efficiency, Datadog offers better stability and margin of safety. Both companies face challenges but fit distinct investor archetypes.
Disclaimer: Investment carries a risk of loss of initial capital. The past performance is not a reliable indicator of future results. Be sure to understand risks before making an investment decision.
Go Further
I encourage you to read the complete analyses of Shopify Inc. and Datadog, Inc. to enhance your investment decisions: