In today’s fast-evolving technology landscape, choosing the right software company to invest in requires careful analysis. Datadog, Inc. and PTC Inc. both operate in the software application industry, yet they target different niches—Datadog focuses on cloud monitoring and analytics, while PTC emphasizes digital transformation and product lifecycle solutions. This article will explore their strategies and market positions to help you identify the most promising investment opportunity.
Table of contents
Companies Overview
I will begin the comparison between Datadog and PTC by providing an overview of these two companies and their main differences.
Datadog Overview
Datadog, Inc. offers a cloud-based monitoring and analytics platform designed for developers, IT operations, and business users. Its SaaS platform integrates infrastructure monitoring, application performance, log management, and security monitoring to deliver real-time observability of technology stacks. Founded in 2010 and headquartered in New York City, Datadog serves customers globally, emphasizing automation and collaboration tools within its platform.
PTC Overview
PTC Inc. operates as a software and services company across the Americas, Europe, and Asia Pacific, focusing on digital transformation solutions. It provides a variety of platforms, including ThingWorx for industrial innovation and Vuforia for augmented reality, alongside product lifecycle management and application lifecycle management software. Established in 1985 and based in Boston, PTC offers both software products and professional services to support enterprise needs.
Key similarities and differences
Both Datadog and PTC operate in the technology sector, offering software solutions that support business operations and innovation. Datadog specializes in cloud monitoring and analytics for IT infrastructure, emphasizing real-time data and automation. In contrast, PTC focuses on digital transformation through product development, lifecycle management, and augmented reality platforms, combining software with professional services. Their business models differ primarily in product scope and target customer applications.
Income Statement Comparison
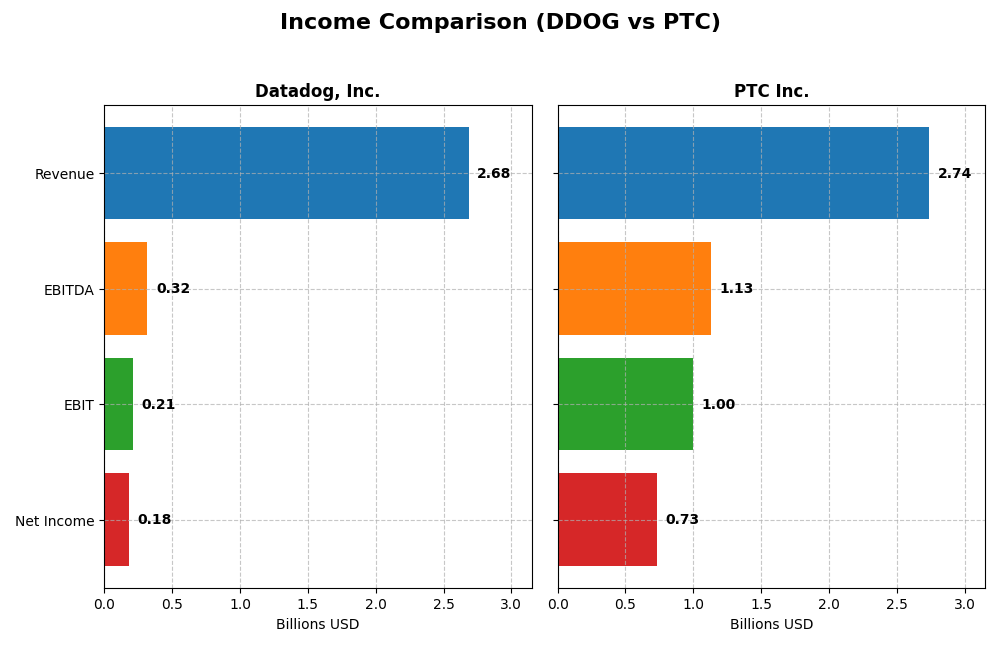
This table presents a side-by-side comparison of the most recent fiscal year income statement figures for Datadog, Inc. and PTC Inc., highlighting key financial metrics.
| Metric | Datadog, Inc. (DDOG) | PTC Inc. (PTC) |
|---|---|---|
| Market Cap | 41.7B | 19.9B |
| Revenue | 2.68B | 2.74B |
| EBITDA | 318M | 1.13B |
| EBIT | 211M | 997M |
| Net Income | 184M | 734M |
| EPS | 0.55 | 6.18 |
| Fiscal Year | 2024 | 2025 |
Income Statement Interpretations
Datadog, Inc.
Datadog’s revenue surged from $603M in 2020 to $2.68B in 2024, showing strong growth with a net income turnaround from a loss of $25M to a positive $184M. Gross margins remained robust around 80.76%, while EBIT margins were moderate at 7.86%. The latest year featured a 26% revenue increase and a near tripling of net margin, signaling accelerating profitability.
PTC Inc.
PTC’s revenue grew steadily from $1.81B in 2021 to $2.74B in 2025, with net income rising from $477M to $734M. Gross margin was high at 83.76%, and EBIT margin notably strong at 36.4%. The most recent year showed a 19% revenue growth and a 64% net margin increase, reflecting solid operational leverage and improved profitability.
Which one has the stronger fundamentals?
Both companies exhibit favorable income statement fundamentals with strong revenue and net income growth. Datadog shows higher overall growth rates and improving margins from a smaller base, while PTC maintains higher absolute margins and earnings. PTC’s superior EBIT and net margins suggest stronger profitability, but Datadog’s rapid margin expansion indicates improving fundamentals.
Financial Ratios Comparison
The table below presents the most recent financial ratios for Datadog, Inc. and PTC Inc., providing a clear numerical comparison of key performance and liquidity metrics as of their latest fiscal years.
| Ratios | Datadog, Inc. (2024) | PTC Inc. (2025) |
|---|---|---|
| ROE | 6.77% | 19.18% |
| ROIC | 1.07% | 14.43% |
| P/E | 261.42 | 33.19 |
| P/B | 17.70 | 6.37 |
| Current Ratio | 2.64 | 1.12 |
| Quick Ratio | 2.64 | 1.12 |
| D/E | 0.68 | 0.36 |
| Debt-to-Assets | 31.84% | 20.70% |
| Interest Coverage | 7.68 | 12.76 |
| Asset Turnover | 0.46 | 0.41 |
| Fixed Asset Turnover | 6.72 | 15.58 |
| Payout Ratio | 0 | 0 |
| Dividend Yield | 0 | 0 |
Interpretation of the Ratios
Datadog, Inc.
Datadog shows a mixed ratio profile with favorable liquidity (current and quick ratios at 2.64) and strong interest coverage (29.85), but unfavorable profitability metrics including ROE at 6.77% and ROIC at 1.07%. Its high PE of 261.42 and PB of 17.7 suggest overvaluation concerns. The company does not pay dividends, likely reflecting a reinvestment or growth strategy.
PTC Inc.
PTC demonstrates stronger profitability with a net margin of 26.8%, ROE at 19.18%, and ROIC at 14.43%, all favorable. Liquidity ratios are average, with a current ratio of 1.12 and a quick ratio deemed favorable. Despite a PE of 33.19 and PB of 6.37 marked unfavorable, the company does not distribute dividends, possibly prioritizing reinvestment in R&D and acquisitions.
Which one has the best ratios?
PTC presents a more favorable ratio balance, with superior profitability and adequate liquidity, while Datadog faces challenges in profitability and valuation. PTC’s higher proportion of favorable ratios (57.14% versus 28.57%) contrasts with Datadog’s slightly unfavorable assessment, indicating relatively stronger financial health for PTC based on these metrics.
Strategic Positioning
This section compares the strategic positioning of Datadog and PTC, including market position, key segments, and exposure to technological disruption:
Datadog
- Positioned in cloud-based monitoring with strong competition in SaaS application software.
- Focuses on cloud monitoring, analytics, security, and observability for developers and IT ops.
- Faces disruption risks from evolving cloud infrastructure and emerging monitoring technologies.
PTC
- Established in software products and professional services with moderate competitive pressure.
- Diverse portfolio including CAD, product lifecycle, AR, and digital transformation software solutions.
- Exposed to disruption via digital transformation platforms and augmented reality innovations.
Datadog vs PTC Positioning
Datadog concentrates on cloud monitoring and analytics, while PTC operates a more diversified software and services portfolio. Datadog’s specialization offers focused innovation, whereas PTC’s breadth supports multiple business drivers but may dilute focus.
Which has the best competitive advantage?
PTC demonstrates a strong, durable competitive advantage with positive ROIC over WACC and growing profitability, while Datadog shows a slightly unfavorable moat despite improving ROIC trends, indicating less efficient capital use.
Stock Comparison
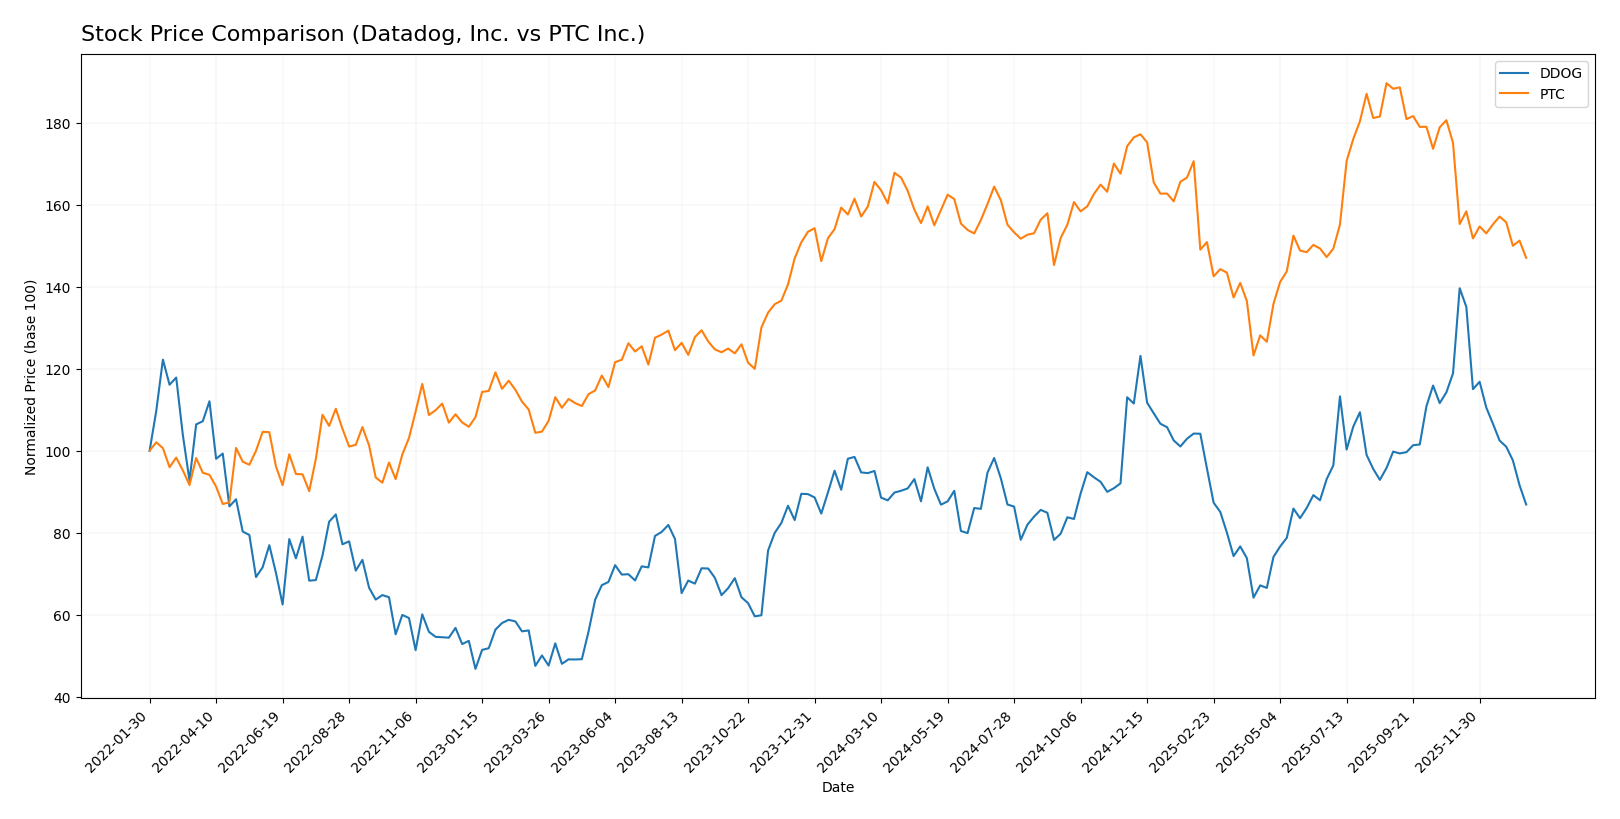
The stock prices of Datadog, Inc. (DDOG) and PTC Inc. (PTC) have both shown bearish trends over the past 12 months, with notable price declines and decelerating momentum. Trading volumes have increased, reflecting active market participation despite downward price pressures.
Trend Analysis
Datadog, Inc. experienced an 8.1% price decline over the past year, indicating a bearish trend with decelerating momentum. The stock showed high volatility, ranging from 87.93 to 191.24, with a recent sharper drop of 26.9%.
PTC Inc. also faced a bearish trend with a 7.84% price decrease, accompanied by deceleration and lower volatility relative to Datadog. The stock price fluctuated between 139.77 and 215.05, with a recent decline of 16.01%.
Comparing both, Datadog’s larger percentage decline and higher volatility suggest weaker market performance relative to PTC, which had a smaller overall loss and steadier price movement.
Target Prices
The analyst consensus for Datadog, Inc. and PTC Inc. reflects optimistic growth potential relative to current market prices.
| Company | Target High | Target Low | Consensus |
|---|---|---|---|
| Datadog, Inc. | 215 | 105 | 177.67 |
| PTC Inc. | 255 | 120 | 213.25 |
Analysts expect Datadog’s stock to appreciate significantly from its current price of $119.02, while PTC’s consensus target of $213.25 suggests strong upside potential from $166.75.
Analyst Opinions Comparison
This section compares analysts’ ratings and grades for Datadog, Inc. and PTC Inc.:
Rating Comparison
Datadog, Inc. Rating
- Rating: C+ with a very favorable status
- Discounted Cash Flow Score: 4, favorable
- ROE Score: 2, moderate
- ROA Score: 3, moderate
- Debt To Equity Score: 2, moderate
- Overall Score: 2, moderate
PTC Inc. Rating
- Rating: B+ with a very favorable status
- Discounted Cash Flow Score: 4, favorable
- ROE Score: 4, favorable
- ROA Score: 5, very favorable
- Debt To Equity Score: 2, moderate
- Overall Score: 3, moderate
Which one is the best rated?
Based strictly on the provided data, PTC Inc. holds a higher rating (B+) and better scores in ROE, ROA, and overall score compared to Datadog’s C+ rating and lower scores. PTC is thus better rated in this comparison.
Scores Comparison
Here is a comparison of the financial health scores for Datadog, Inc. and PTC Inc.:
Datadog, Inc. Scores
- Altman Z-Score: 11.37, indicating a safe zone with low bankruptcy risk.
- Piotroski Score: 6, categorized as average financial strength.
PTC Inc. Scores
- Altman Z-Score: 5.67, indicating a safe zone with low bankruptcy risk.
- Piotroski Score: 8, categorized as very strong financial strength.
Which company has the best scores?
PTC Inc. has a strong Piotroski score of 8 compared to Datadog’s average 6, while both remain in the safe zone for Altman Z-Score. Overall, PTC shows stronger financial health based solely on these scores.
Grades Comparison
Here is a comparison of the latest grades and ratings from reputable grading companies for Datadog, Inc. and PTC Inc.:
Datadog, Inc. Grades
The following table summarizes recent grades from leading financial institutions for Datadog, Inc.:
| Grading Company | Action | New Grade | Date |
|---|---|---|---|
| Barclays | Maintain | Overweight | 2026-01-12 |
| Keybanc | Maintain | Overweight | 2026-01-12 |
| Morgan Stanley | Upgrade | Overweight | 2026-01-12 |
| Truist Securities | Maintain | Hold | 2026-01-07 |
| RBC Capital | Maintain | Outperform | 2026-01-05 |
| Jefferies | Maintain | Buy | 2026-01-05 |
| Piper Sandler | Maintain | Overweight | 2026-01-05 |
| Citigroup | Maintain | Buy | 2025-11-12 |
| Truist Securities | Maintain | Hold | 2025-11-07 |
| DA Davidson | Maintain | Buy | 2025-11-07 |
Datadog’s grades show a strong buy-side consensus with multiple Overweight and Buy ratings maintained or upgraded recently.
PTC Inc. Grades
The following table summarizes recent grades from established grading firms for PTC Inc.:
| Grading Company | Action | New Grade | Date |
|---|---|---|---|
| Piper Sandler | Maintain | Neutral | 2025-11-07 |
| Rosenblatt | Maintain | Buy | 2025-11-06 |
| Rosenblatt | Maintain | Buy | 2025-10-30 |
| Oppenheimer | Maintain | Outperform | 2025-07-31 |
| Rosenblatt | Maintain | Buy | 2025-07-31 |
| Barclays | Maintain | Overweight | 2025-07-31 |
| Stifel | Maintain | Buy | 2025-07-31 |
| Keybanc | Maintain | Overweight | 2025-07-31 |
| RBC Capital | Maintain | Outperform | 2025-07-31 |
| Piper Sandler | Maintain | Neutral | 2025-07-31 |
PTC’s grades indicate a positive outlook with a majority Buy and Outperform ratings, though a few Neutral ratings suggest some caution.
Which company has the best grades?
Datadog, Inc. has received a higher number of recent Overweight and Buy ratings, including an upgrade by Morgan Stanley, compared to PTC Inc.’s mix of Buy, Outperform, and Neutral grades. This suggests a stronger consensus confidence in Datadog’s near-term prospects, potentially impacting investor sentiment positively.
Strengths and Weaknesses
Below is a comparison of key strengths and weaknesses of Datadog, Inc. (DDOG) and PTC Inc. (PTC) based on the most recent financial and strategic data.
| Criterion | Datadog, Inc. (DDOG) | PTC Inc. (PTC) |
|---|---|---|
| Diversification | Focused primarily on cloud monitoring and analytics, limited diversification. | Well-diversified with revenues from License (1.16B), Technology Service (107M), and Support & Cloud Services (1.47B). |
| Profitability | Low net margin (6.85%), ROIC (1.07%) below WACC (9.53%), slightly unfavorable profitability. | Strong profitability with net margin 26.8%, ROIC 14.43% above WACC (8.35%), very favorable. |
| Innovation | Growing ROIC trend indicates improving innovation and operational efficiency. | Consistent innovation reflected in growing ROIC and diverse technology offerings. |
| Global presence | Good global presence as a cloud service provider, but narrower market scope. | Broad global footprint with diverse enterprise software products and services. |
| Market Share | Rapid growth in cloud monitoring but faces intense competition; market share still developing. | Established market leader in CAD and PLM software with durable competitive advantage. |
Key takeaways: PTC demonstrates stronger profitability, diversification, and a durable competitive moat with increasing returns on capital. Datadog shows promising innovation and growth but currently struggles with profitability and value creation. Investors should weigh growth potential against risk and current value destruction in Datadog.
Risk Analysis
Below is a comparative risk table for Datadog, Inc. (DDOG) and PTC Inc. (PTC) based on the most recent data in 2026:
| Metric | Datadog, Inc. (DDOG) | PTC Inc. (PTC) |
|---|---|---|
| Market Risk | Beta 1.26: moderately volatile | Beta 1.01: near market volatility |
| Debt level | Debt/Equity 0.68: moderate leverage | Debt/Equity 0.36: low leverage |
| Regulatory Risk | Moderate, US & international exposure | Moderate, global software compliance |
| Operational Risk | Platform integration complexity | Diverse product portfolio management |
| Environmental Risk | Low direct impact; mostly digital | Low direct impact; mostly digital |
| Geopolitical Risk | Exposure to global cloud markets | Exposure to Americas, Europe, Asia |
Datadog faces higher market volatility and moderate leverage, with operational risks tied to complex cloud integrations. PTC shows stronger financial stability with lower debt and a very strong operational score, reducing its risk profile. Both companies have low environmental risk but remain exposed to geopolitical shifts affecting global software demand.
Which Stock to Choose?
Datadog, Inc. (DDOG) shows strong income growth with a 26.12% revenue increase in 2024 and favorable net margin at 6.85%. Despite decent liquidity and interest coverage, its profitability ratios like ROE (6.77%) and ROIC (1.07%) are unfavorable, and it carries moderate debt. The company’s rating is very favorable (C+), but the overall financial ratios are slightly unfavorable, reflecting some valuation concerns.
PTC Inc. (PTC) demonstrates solid income metrics, with a 19.18% revenue growth in 2025 and a high net margin of 26.8%. It exhibits favorable financial ratios including ROE (19.18%), ROIC (14.43%), and a lower debt level. PTC holds a very favorable rating (B+) with a globally favorable ratio profile, indicating efficient asset use and strong profitability.
For investors, PTC may appear more suitable for those prioritizing stable profitability and efficient capital use, given its very favorable rating and financial ratios. Conversely, DDOG might appeal to investors focused on growth potential despite some valuation and profitability challenges. These interpretations depend on individual risk tolerance and investment strategy.
Disclaimer: Investment carries a risk of loss of initial capital. The past performance is not a reliable indicator of future results. Be sure to understand risks before making an investment decision.
Go Further
I encourage you to read the complete analyses of Datadog, Inc. and PTC Inc. to enhance your investment decisions: