Home > Comparison > Technology > DDOG vs PEGA
The strategic rivalry between Datadog, Inc. and Pegasystems Inc. shapes the evolution of the software application sector. Datadog operates a cloud-native monitoring platform with real-time observability, while Pegasystems delivers enterprise software focused on customer engagement and process automation. This head-to-head pits cutting-edge SaaS innovation against comprehensive digital process solutions. This analysis will clarify which company’s trajectory offers a superior risk-adjusted profile for a diversified technology portfolio.
Table of contents
Companies Overview
Datadog and Pegasystems both hold significant positions in the enterprise software market, each driving innovation in cloud-based solutions.
Datadog, Inc.: Real-Time Cloud Monitoring Leader
Datadog dominates the cloud monitoring and analytics space with its SaaS platform. It generates revenue by integrating infrastructure monitoring, application performance, and security tools for developers and IT teams. In 2026, Datadog’s strategy centers on expanding real-time observability and automation capabilities to sustain its competitive edge.
Pegasystems Inc.: Customer Engagement and Automation Specialist
Pegasystems focuses on enterprise software for digital process automation and customer engagement. It earns revenue from licensing and hosting platforms like Pega Infinity and Customer Decision Hub. The company’s 2026 strategic thrust emphasizes intelligent automation and cloud delivery to enhance customer experience across diverse industries globally.
Strategic Collision: Similarities & Divergences
Both firms leverage cloud platforms but differ in philosophy: Datadog pursues a data observability ecosystem, while Pegasystems builds an integrated customer engagement infrastructure. Their competition unfolds primarily in enterprise IT modernization and automation. Investors face distinct profiles: Datadog’s growth hinges on SaaS innovation; Pegasystems balances legacy platform stability with cloud transformation.
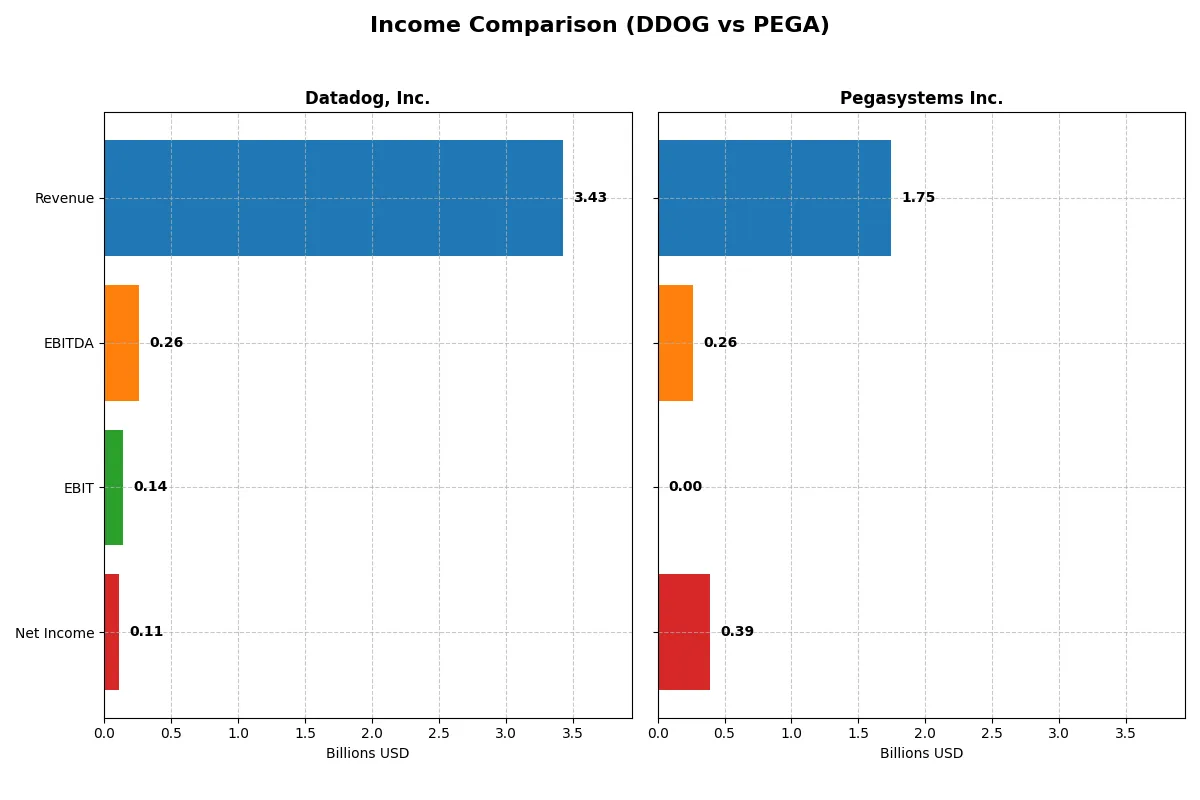
Income Statement Comparison
This data dissects the core profitability and scalability of both corporate engines to reveal who dominates the bottom line:
| Metric | Datadog, Inc. (DDOG) | Pegasystems Inc. (PEGA) |
|---|---|---|
| Revenue | 3.43B | 1.75B |
| Cost of Revenue | 687M | 421M |
| Operating Expenses | 2.78B | 1.04B |
| Gross Profit | 2.74B | 1.32B |
| EBITDA | 261M | 263M |
| EBIT | 138M | 0 |
| Interest Expense | 11M | -1.3M |
| Net Income | 108M | 393M |
| EPS | 0.31 | 2.30 |
| Fiscal Year | 2025 | 2025 |
Income Statement Analysis: The Bottom-Line Duel
This income statement comparison reveals how efficiently each company converts revenue into profit across recent market cycles.
Datadog, Inc. Analysis
Datadog’s revenue surged from 1B in 2021 to 3.4B in 2025, with net income recovering from losses to 108M in 2025. Its gross margin stays strong near 80%, but net margin remains slim at 3.1%. Despite 27.7% top-line growth in 2025, margin compression and declining EPS signal rising operating expenses.
Pegasystems Inc. Analysis
Pegasystems grew revenue steadily from 1.2B in 2021 to 1.75B in 2025, with net income rebounding sharply to 393M. Gross margin holds at 75.9%, while a robust 22.5% net margin reflects disciplined cost control. Strong EPS growth and favorable operating leverage underpin positive momentum despite flat EBIT in 2025.
Margin Discipline vs. Growth Scale
Pegasystems commands a clear edge with superior net margin and sharper EPS growth, reflecting efficient capital allocation. Datadog impresses with rapid revenue expansion but struggles to maintain profitability amid rising costs. Investors favor Pegasystems’ balanced profit profile over Datadog’s high-growth yet margin-pressured trajectory.
Financial Ratios Comparison
These vital ratios act as a diagnostic tool to expose the underlying fiscal health, valuation premiums, and capital efficiency of the companies compared below:
| Ratios | Datadog, Inc. (DDOG) | Pegasystems Inc. (PEGA) |
|---|---|---|
| ROE | 2.89% | 49.97% |
| ROIC | -0.74% | 29.43% |
| P/E | 438.4x | 25.9x |
| P/B | 12.65x | 12.95x |
| Current Ratio | 3.38 | 1.33 |
| Quick Ratio | 3.38 | 1.33 |
| D/E | 0.41 | 0.08 |
| Debt-to-Assets | 23.1% | 3.7% |
| Interest Coverage | -4.01x | -204.7x |
| Asset Turnover | 0.52 | 1.07 |
| Fixed Asset Turnover | 6.20 | 0 |
| Payout Ratio | 0% | 3.9% |
| Dividend Yield | 0% | 0.15% |
| Fiscal Year | 2025 | 2025 |
Efficiency & Valuation Duel: The Vital Signs
Financial ratios act as a company’s DNA, revealing hidden risks and operational excellence vital for informed investment decisions.
Datadog, Inc.
Datadog shows weak profitability with a 2.89% ROE and a stretched P/E of 438.37, signaling an expensive stock. Despite a high current ratio of 3.38, its net margin remains low at 3.14%. The company pays no dividends, focusing capital heavily on R&D to fuel long-term growth.
Pegasystems Inc.
Pegasystems delivers strong profitability, boasting a 49.97% ROE and a solid net margin of 22.54%. Its P/E of 25.92 is more reasonable but still slightly stretched. The company offers a modest 0.15% dividend yield while maintaining a balanced reinvestment strategy to sustain operational efficiency and growth.
Premium Valuation vs. Operational Safety
Pegasystems offers a better balance of profitability and valuation, with stronger returns and manageable risk metrics. Datadog’s high valuation and weak returns create elevated risk. Investors seeking operational safety and consistent profitability will find Pegasystems’ profile more fitting.
Which one offers the Superior Shareholder Reward?
Datadog (DDOG) and Pegasystems (PEGA) pursue starkly different shareholder reward strategies. DDOG pays no dividends, reinvesting heavily in growth and R&D, with zero payout ratio and no dividend yield. Its free cash flow per share stands at $2.88, while operating cash flow coverage remains robust, signaling strong capacity to fuel expansion. DDOG’s buyback program is minimal or non-existent, indicating a focus on capital allocation toward growth rather than direct shareholder returns. In contrast, PEGA offers a modest dividend yield of 0.15%, with a low payout ratio around 4%, signaling a conservative but steady income stream. PEGA’s free cash flow per share is $2.96, supported by consistent buyback activity that complements its dividend, enhancing total shareholder return. PEGA’s distribution model balances returning cash to shareholders and sustaining growth, reflected in its strong operating margins and manageable leverage. Considering sustainability and total return, I find PEGA’s mixed dividend and buyback approach superior for investors in 2026, offering both income and capital appreciation potential, while DDOG’s all-growth reinvestment strategy entails higher risk with uncertain near-term shareholder rewards.
Comparative Score Analysis: The Strategic Profile
The radar chart reveals the fundamental DNA and trade-offs of both firms, highlighting differences in financial efficiency and valuation metrics:
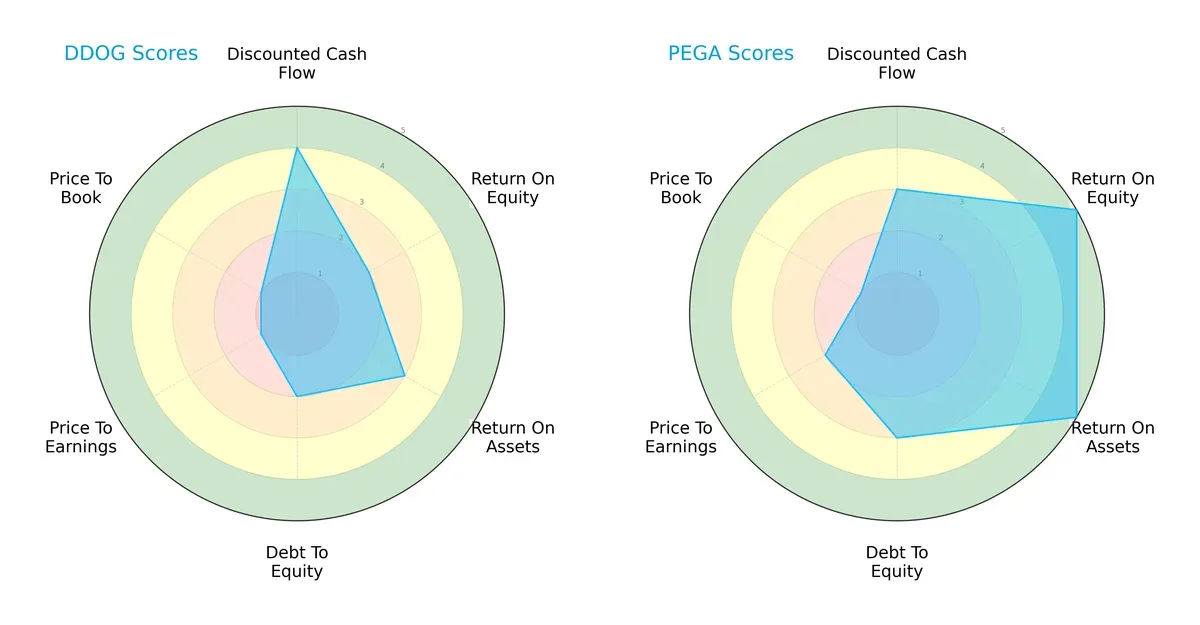
Pegasystems Inc. (PEGA) shows strength in profitability with superior ROE (5) and ROA (5) scores compared to Datadog, Inc. (DDOG), which lags behind at 2 and 3 respectively. PEGA maintains a more balanced debt-to-equity score (3) versus DDOG’s weaker score (2), indicating lower financial risk. DDOG’s discounted cash flow score (4) slightly outperforms PEGA’s (3), suggesting better cash flow valuation. However, DDOG’s valuation metrics (P/E and P/B at 1 each) are very unfavorable, signaling potential overvaluation or market skepticism. PEGA’s overall profile is more balanced, leveraging operational efficiency and moderate leverage, while DDOG relies heavily on cash flow strength despite valuation concerns.
Bankruptcy Risk: Solvency Showdown
The Altman Z-Score gap underscores both companies’ strong solvency, yet reveals differing margins of safety:
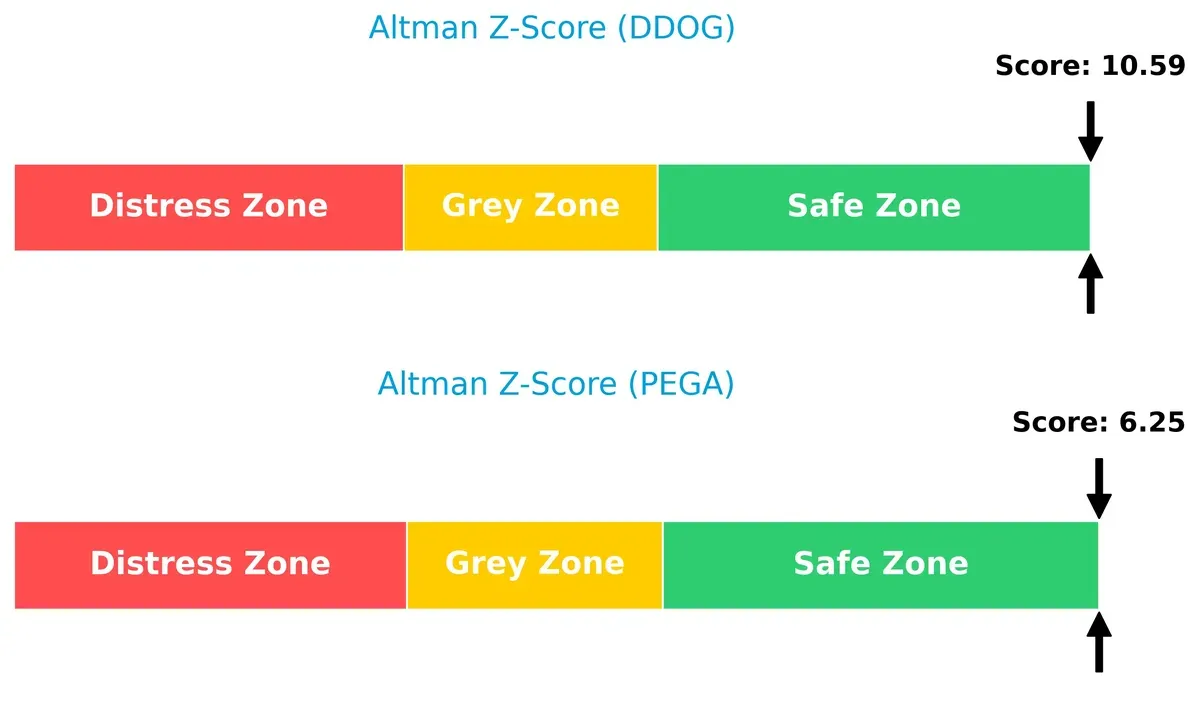
Datadog’s exceptionally high Z-Score of 10.6 places it firmly in the safe zone with minimal bankruptcy risk, reflecting robust financial stability. Pegasystems, while also safe with a score of 6.3, shows a lower buffer, suggesting relatively higher—but still manageable—long-term risk in this late-cycle environment.
Financial Health: Quality of Operations
Piotroski F-Scores highlight contrasting operational quality and internal financial health:
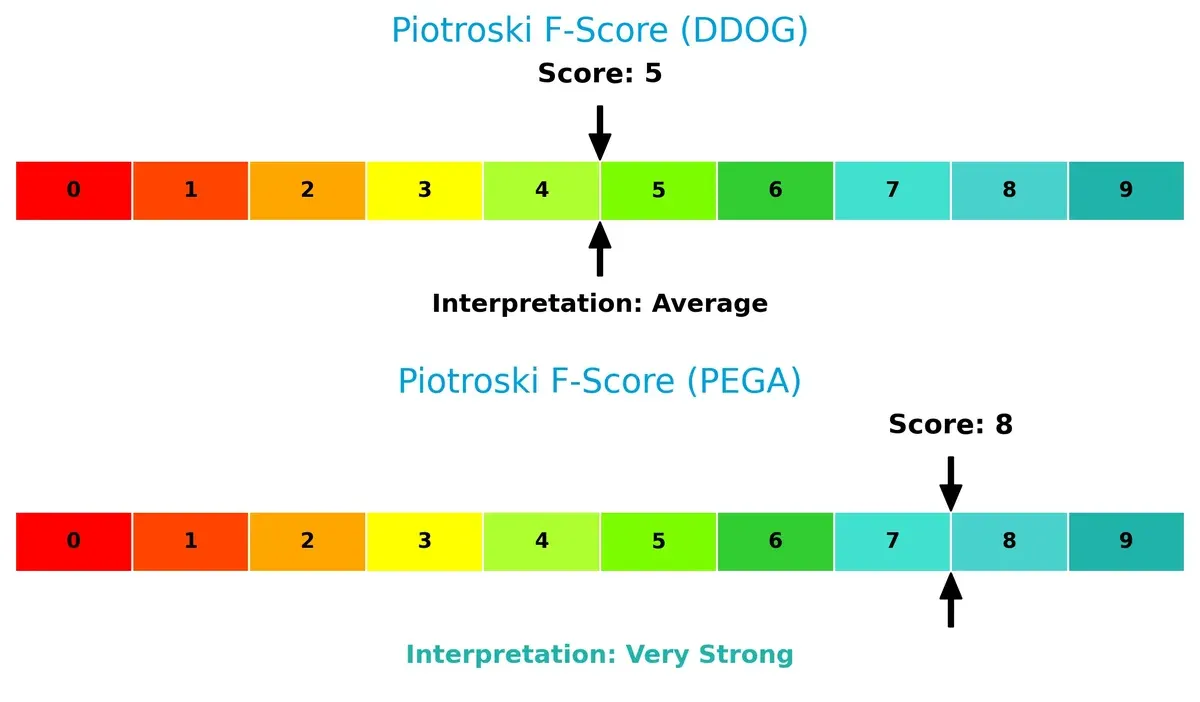
Pegasystems stands out with a very strong Piotroski score of 8, signaling excellent profitability, liquidity, and efficiency metrics. Datadog’s average score of 5 suggests moderate financial health but flags potential internal weaknesses. Investors should monitor DDOG’s internal metrics for any deterioration relative to PEGA’s robust operational quality.
How are the two companies positioned?
This section dissects the operational DNA of Datadog and Pegasystems by comparing their revenue distribution and internal strengths and weaknesses. The goal is to confront their economic moats to identify which model offers the most resilient, sustainable competitive advantage today.
Revenue Segmentation: The Strategic Mix
This visual comparison dissects how Datadog, Inc. and Pegasystems Inc. diversify their income streams and highlights their primary sector bets:

Datadog lacks segment data, so I cannot assess its revenue mix. Pegasystems anchors revenue in Pega Cloud with $1.54B in 2025, dwarfing Consulting ($228M) and Maintenance ($393M). Pegasystems pivots on cloud dominance but maintains diversification through subscriptions and consulting, reducing concentration risk. Without Datadog’s data, only Pegasystems’ strategy shows a strong ecosystem lock-in via cloud infrastructure.
Strengths and Weaknesses Comparison
This table compares the Strengths and Weaknesses of Datadog, Inc. and Pegasystems Inc.:
Datadog Strengths
- Strong quick ratio at 3.38 indicating good liquidity
- Low debt-to-equity at 0.41 supports financial stability
- High interest coverage at 12.49 reduces default risk
- Favorable fixed asset turnover at 6.2 shows efficient asset use
- Significant North America and International revenue diversification
Pegasystems Strengths
- High net margin at 22.54% signals strong profitability
- ROE of 49.97% and ROIC of 29.43% well above WACC indicate value creation
- Favorable quick ratio and low debt-to-equity at 0.08 enhance balance sheet strength
- Good asset turnover at 1.07 reflects efficient operations
- Diversified revenue streams with strong growth in Pega Cloud segment
- Global presence across Asia Pacific, EMEA, Americas, and US markets
Datadog Weaknesses
- Negative ROIC (-0.74%) below WACC suggests poor capital efficiency
- Unfavorable net margin and ROE indicate profitability challenges
- High P/E of 438.37 and P/B of 12.65 imply valuation concerns
- Current ratio considered unfavorable despite high quick ratio
- No dividend yield limits income appeal
- Limited product segmentation data restricts diversification insights
Pegasystems Weaknesses
- Unfavorable P/E at 25.92 and high P/B at 12.95 raise valuation questions
- Interest coverage near zero signals potential financial risk
- Fixed asset turnover at zero suggests asset underutilization
- Low dividend yield at 0.15% offers limited shareholder returns
Overall, Datadog shows liquidity strength and asset efficiency but struggles with profitability and valuation. Pegasystems delivers robust profitability and diversified revenues but faces concerns over asset utilization and interest coverage. These contrasts highlight differing strategic focuses and risk profiles for each company.
The Moat Duel: Analyzing Competitive Defensibility
A structural moat shields long-term profits from relentless competitive pressure. Without it, profits erode rapidly. Let’s analyze the core moats of two software firms:
Datadog, Inc.: Integrated Observability Platform with Switching Costs
Datadog’s moat stems from high switching costs embedded in its all-in-one cloud monitoring platform. Its financials show margin stability but currently shed value with ROIC below WACC. Expansion in security monitoring may deepen this moat by 2026.
Pegasystems Inc.: Enterprise Automation with Intangible Assets
Pegasystems leverages proprietary AI-driven automation and customer engagement software, differentiating it via intangible assets. Its ROIC comfortably exceeds WACC, signaling strong value creation. Global market expansion and platform unification will likely amplify its moat.
Verdict: Switching Costs vs. Intangible Assets — The Moat Depth Battle
Pegasystems holds a deeper, more sustainable moat, demonstrated by a 21% ROIC premium over WACC and accelerating profitability. Datadog’s switching cost moat is promising but currently weaker, leaving Pegasystems better positioned to defend market share in 2026.
Which stock offers better returns?
The past year’s stock prices reveal contrasting dynamics: Datadog’s modest gain shows decelerating momentum, while Pegasystems achieves strong appreciation despite recent pullbacks.
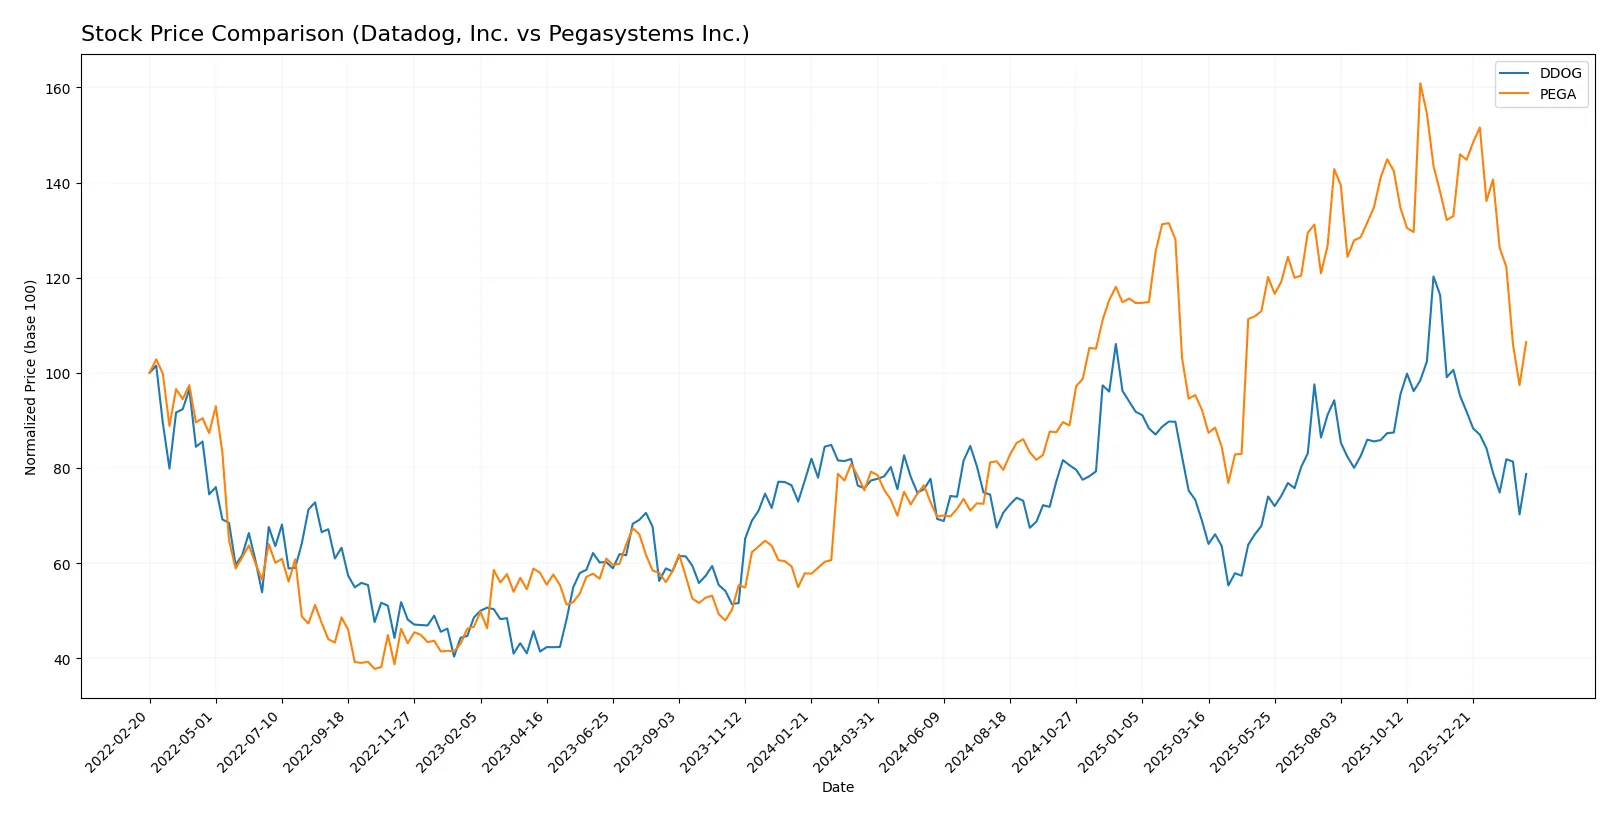
Trend Comparison
Datadog’s stock rose 1.77% over twelve months, indicating a neutral to slightly bullish trend with decelerating price gains and a high volatility level of 18.68%. The recent period shows a sharp 21.75% decline.
Pegasystems delivered a robust 34.39% gain over the same period, confirming a bullish trend with deceleration and lower volatility at 10.53%. It also faced a near 20% drop recently but with less steep slope decline.
Pegasystems outperformed Datadog over the past year with significantly higher total returns, despite both stocks experiencing notable recent sell-offs.
Target Prices
Analysts present a cautiously optimistic consensus for Datadog and Pegasystems, with target prices well above current levels.
| Company | Target Low | Target High | Consensus |
|---|---|---|---|
| Datadog, Inc. | 105 | 215 | 175.07 |
| Pegasystems Inc. | 48 | 65 | 58.25 |
Datadog’s consensus target price of $175 implies a significant upside from its current $125 price. Pegasystems shows a similar pattern, with targets suggesting upside from $44 to nearly $60.

Don’t Let Luck Decide Your Entry Point
Optimize your entry points with our advanced ProRealTime indicators. You’ll get efficient buy signals with precise price targets for maximum performance. Start outperforming now!
How do institutions grade them?
Datadog, Inc. Grades
The following table summarizes recent grades from reputable financial institutions for Datadog, Inc.:
| Grading Company | Action | New Grade | Date |
|---|---|---|---|
| DA Davidson | Maintain | Buy | 2026-02-11 |
| Macquarie | Maintain | Outperform | 2026-02-11 |
| Barclays | Maintain | Overweight | 2026-02-11 |
| Rosenblatt | Maintain | Buy | 2026-02-11 |
| Raymond James | Maintain | Outperform | 2026-02-11 |
| Scotiabank | Maintain | Sector Outperform | 2026-02-11 |
| RBC Capital | Maintain | Outperform | 2026-02-11 |
| Wedbush | Maintain | Outperform | 2026-02-11 |
| Citizens | Maintain | Market Perform | 2026-02-11 |
| BTIG | Maintain | Buy | 2026-02-10 |
Pegasystems Inc. Grades
Below is a summary of recent grades from verified grading firms for Pegasystems Inc.:
| Grading Company | Action | New Grade | Date |
|---|---|---|---|
| Rosenblatt | Maintain | Buy | 2026-02-12 |
| RBC Capital | Maintain | Outperform | 2026-02-12 |
| Citizens | Maintain | Market Outperform | 2026-02-12 |
| Barclays | Upgrade | Overweight | 2026-02-12 |
| Wedbush | Maintain | Outperform | 2026-02-12 |
| Citigroup | Maintain | Buy | 2026-02-12 |
| Rosenblatt | Maintain | Buy | 2026-02-06 |
| JP Morgan | Maintain | Overweight | 2025-12-05 |
| RBC Capital | Maintain | Outperform | 2025-10-23 |
| Wedbush | Maintain | Outperform | 2025-10-23 |
Which company has the best grades?
Datadog receives consistently strong buy and outperform ratings from major firms, reflecting broad institutional confidence. Pegasystems also earns solid grades but shows slightly more variation, including upgrades. Investors may view Datadog’s uniform positive outlook as a sign of stronger market conviction.
Risks specific to each company
In 2026’s volatile tech landscape, these categories reveal critical pressure points and systemic threats facing Datadog, Inc. and Pegasystems Inc.:
1. Market & Competition
Datadog, Inc.
- Faces intense rivalry from cloud-native monitoring providers; high P/E signals growth expectations pressure.
Pegasystems Inc.
- Competes in mature enterprise software space; strong ROE and margins support competitive resilience.
2. Capital Structure & Debt
Datadog, Inc.
- Moderate leverage (D/E 0.41) with solid interest coverage (12.49x) reduces refinancing risks.
Pegasystems Inc.
- Very low leverage (D/E 0.08) but weak interest coverage raises concerns about earnings volatility.
3. Stock Volatility
Datadog, Inc.
- Higher beta (1.29) indicates greater sensitivity to market swings.
Pegasystems Inc.
- Lower beta (1.07) suggests more stable stock price behavior.
4. Regulatory & Legal
Datadog, Inc.
- Operates globally, exposed to complex data privacy and cloud compliance regulations.
Pegasystems Inc.
- Broad international footprint increases exposure to diverse regulatory regimes and compliance costs.
5. Supply Chain & Operations
Datadog, Inc.
- SaaS model minimizes physical supply chain risks; operational scalability is a strength.
Pegasystems Inc.
- Relies on software development and cloud hosting; potential risks from platform integration complexity.
6. ESG & Climate Transition
Datadog, Inc.
- Limited disclosure; technology sector faces rising investor pressure on sustainability practices.
Pegasystems Inc.
- Slight ESG risk from global operations; improving corporate governance could mitigate concerns.
7. Geopolitical Exposure
Datadog, Inc.
- Significant North American and international presence; vulnerable to US-China tech tensions.
Pegasystems Inc.
- Diverse geographic reach increases exposure to geopolitical instability in Europe and Asia-Pacific.
Which company shows a better risk-adjusted profile?
Pegasystems’ strong profitability, conservative leverage, and very strong Piotroski score highlight superior financial health. Datadog’s elevated valuation multiples and weaker returns on capital raise caution despite solid liquidity and operational scalability. The most impactful risk for Datadog is its stretched valuation, which could amplify downside in market corrections. For Pegasystems, exposure to regulatory complexity and geopolitical risks in multiple regions stands out. Overall, Pegasystems offers a more balanced and risk-adjusted investment profile supported by robust profitability and financial strength trends in 2025.
Final Verdict: Which stock to choose?
Datadog’s superpower lies in its rapid revenue growth and robust cash flow generation, reflecting strong market adoption. However, its persistent value destruction and high valuation multiples warrant caution as a point of vigilance. It suits aggressive growth investors willing to tolerate volatility and execution risks.
Pegasystems commands a durable moat with impressive returns on invested capital well above its cost of capital. Its solid profitability and healthier financial stability make it relatively safer than Datadog. It fits well in a GARP portfolio seeking quality growth at a reasonable price.
If you prioritize high-growth potential despite profitability challenges, Datadog offers an appealing scenario with accelerating revenues but elevated risk. However, if you seek sustainable value creation and stronger financial health, Pegasystems outshines as a more stable option that commands a justified premium.
Disclaimer: Investment carries a risk of loss of initial capital. The past performance is not a reliable indicator of future results. Be sure to understand risks before making an investment decision.
Go Further
I encourage you to read the complete analyses of Datadog, Inc. and Pegasystems Inc. to enhance your investment decisions: