Home > Comparison > Technology > DDOG vs PAYC
The strategic rivalry between Datadog, Inc. and Paycom Software, Inc. shapes the technology sector’s software application landscape. Datadog operates a cloud-native monitoring platform emphasizing real-time observability, while Paycom delivers a comprehensive cloud-based human capital management solution. This head-to-head contrasts infrastructure-centric innovation with end-to-end workforce management. This analysis will identify which company’s trajectory offers superior risk-adjusted returns for a diversified portfolio in today’s dynamic tech environment.
Table of contents
Companies Overview
Datadog and Paycom shape critical segments of the software application market, commanding substantial investor attention in 2026.
Datadog, Inc.: Cloud Monitoring Powerhouse
Datadog leads as a real-time observability platform for developers and IT operations worldwide. It monetizes through its SaaS model, integrating infrastructure, application performance, and security monitoring. In 2026, Datadog focuses on expanding automation and enhancing analytics capabilities to deepen its competitive edge in cloud-native environments.
Paycom Software, Inc.: Human Capital Management Specialist
Paycom stands out in the cloud-based HCM software niche, serving U.S. small to mid-sized businesses. It generates revenue by offering comprehensive lifecycle management tools—from recruitment to payroll. The company prioritizes improving user experience and data analytics in 2026, aiming to streamline workforce management with advanced, integrated solutions.
Strategic Collision: Similarities & Divergences
Both firms provide SaaS-driven software applications, but Datadog targets cloud infrastructure monitoring, while Paycom specializes in human capital management. They compete indirectly but share emphasis on data analytics and automation. Datadog’s growth hinges on tech infrastructure innovation; Paycom’s strength lies in workforce operational efficiency. Their distinct market focus creates unique investment profiles with varied risk and growth dynamics.
Income Statement Comparison
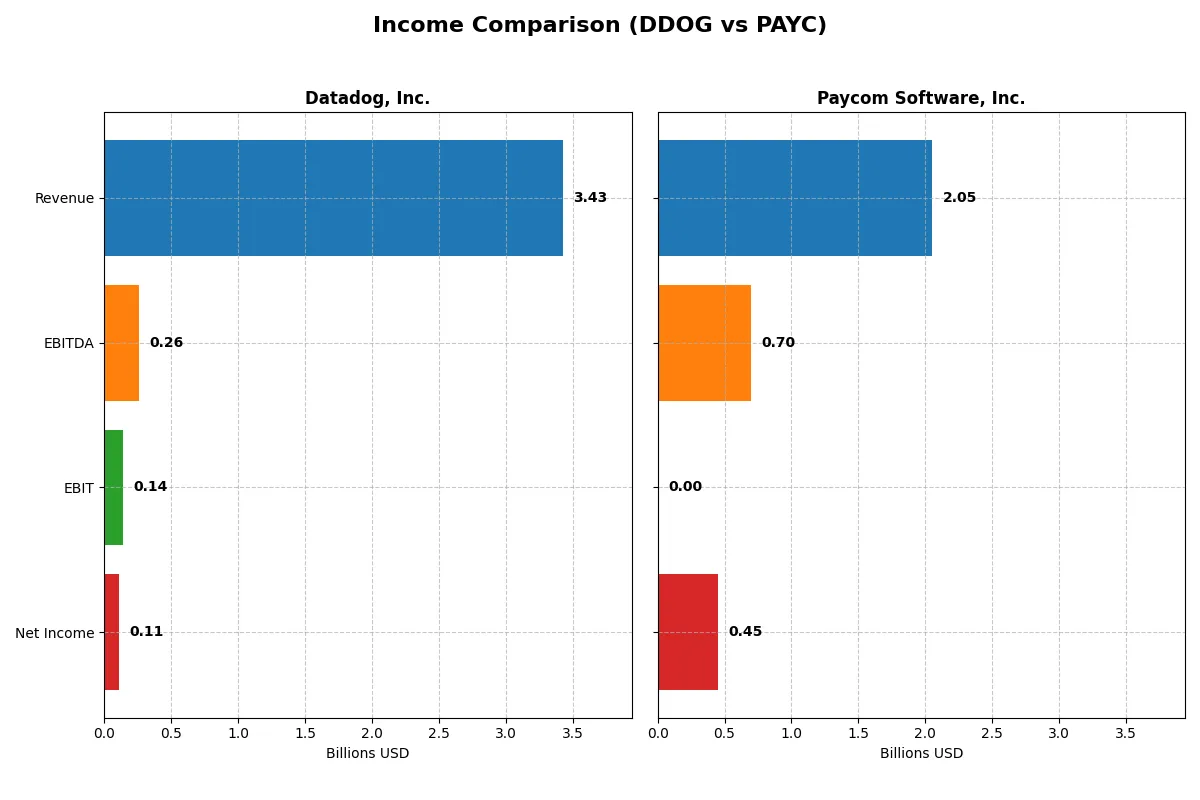
The following data dissects the core profitability and scalability of both corporate engines to reveal who dominates the bottom line:
| Metric | Datadog, Inc. (DDOG) | Paycom Software, Inc. (PAYC) |
|---|---|---|
| Revenue | 3.43B | 2.05B |
| Cost of Revenue | 687M | 345M |
| Operating Expenses | 2.78B | 1.05B |
| Gross Profit | 2.74B | 1.71B |
| EBITDA | 261M | 698M |
| EBIT | 138M | 0 |
| Interest Expense | 11M | -3.4M |
| Net Income | 108M | 453M |
| EPS | 0.31 | 8.13 |
| Fiscal Year | 2025 | 2025 |
Income Statement Analysis: The Bottom-Line Duel
This income statement comparison reveals how efficiently Datadog and Paycom convert revenue into profits and sustain margin strength over time.
Datadog, Inc. Analysis
Datadog’s revenue surged from 1B in 2021 to 3.4B in 2025, with net income climbing from a loss to 108M in 2025. Its gross margin holds strong near 80%, reflecting solid core profitability. However, net margin and EBIT fell sharply in 2025, signaling rising expenses outpacing operating gains despite revenue momentum.
Paycom Software, Inc. Analysis
Paycom’s revenue expanded steadily from 1.1B in 2021 to 2.1B in 2025, with net income growing to 453M. Gross margin peaked above 83%, showcasing operational efficiency. Yet, EBIT dropped to zero in 2025, indicating a sharp decline in operating income, while net margin remains robust above 22%, reflecting effective cost controls and tax management.
Margin Resilience vs. Scale Expansion
Datadog exhibits rapid top-line growth but struggles with margin compression and operating losses in the latest year. Paycom maintains superior net margins and consistent profitability despite slower revenue growth. For investors, Datadog’s profile suits growth seekers tolerating volatility, whereas Paycom appeals to those valuing steady, high-margin earnings.
Financial Ratios Comparison
These vital ratios act as a diagnostic tool to expose the underlying fiscal health, valuation premiums, and capital efficiency of the companies analyzed:
| Ratios | Datadog, Inc. (DDOG) | Paycom Software, Inc. (PAYC) |
|---|---|---|
| ROE | 2.89% | 0% |
| ROIC | -0.74% | 0% |
| P/E | 438.4x | 19.6x |
| P/B | 12.65x | N/A |
| Current Ratio | 3.38 | 0 |
| Quick Ratio | 3.38 | 0 |
| D/E | 0.41 | 0 |
| Debt-to-Assets | 23.1% | 0% |
| Interest Coverage | -4.01x | -166.8x |
| Asset Turnover | 0.52 | 0 |
| Fixed Asset Turnover | 6.20 | 0 |
| Payout Ratio | 0% | 18.7% |
| Dividend Yield | 0% | 0.95% |
| Fiscal Year | 2025 | 2025 |
Efficiency & Valuation Duel: The Vital Signs
Financial ratios act as a company’s DNA, revealing hidden risks and operational strengths beyond headline figures.
Datadog, Inc.
Datadog posts a low ROE of 2.89% and thin net margins at 3.14%, signaling weak profitability. Its sky-high P/E ratio of 438.37 marks the stock as extremely expensive. Although it lacks dividends, Datadog invests heavily in R&D, aiming for growth despite its stretched valuation and slight operational inefficiencies.
Paycom Software, Inc.
Paycom shows a strong net margin of 22.1%, reflecting solid profitability, but reports zero ROE and ROIC, likely due to data gaps. Its P/E ratio of 19.61 is reasonable, suggesting fair valuation. The company pays a modest 0.95% dividend but faces challenges with liquidity and coverage ratios, indicating some financial constraints.
Premium Valuation vs. Operational Safety
Datadog’s sky-high valuation contrasts with Paycom’s more moderate multiples and superior margin profile. Paycom offers better operational profitability but shows financial weaknesses in liquidity and interest coverage. Investors seeking growth might lean toward Datadog’s reinvestment strategy, while those valuing margin strength and valuation stability may prefer Paycom’s profile.
Which one offers the Superior Shareholder Reward?
Datadog (DDOG) pays no dividends but reinvests heavily in growth, reflected by zero payout ratio and negative free cash flow yield. Paycom (PAYC) offers a modest 0.95% dividend yield with a sustainable 18.7% payout ratio and steady buybacks. PAYC’s free cash flow per share of 7.3 supports its distributions, while DDOG’s reinvestment faces profitability volatility. I see PAYC’s balanced dividend and buyback strategy as a superior, more sustainable shareholder reward in 2026.
Comparative Score Analysis: The Strategic Profile
The radar chart reveals the fundamental DNA and trade-offs of Datadog, Inc. and Paycom Software, Inc., highlighting core financial strengths and valuation nuances:
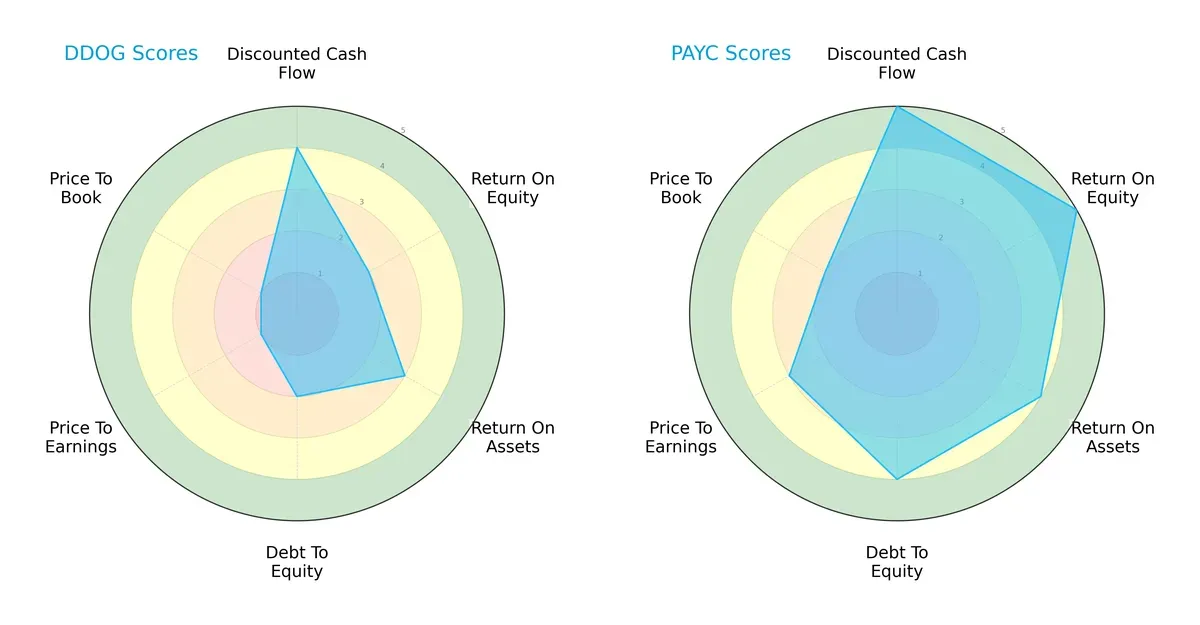
Paycom exhibits a more balanced and robust profile, leading in DCF (5 vs. 4), ROE (5 vs. 2), ROA (4 vs. 3), and Debt/Equity (4 vs. 2) scores. Datadog’s strength lies mainly in its moderate DCF score but suffers from very unfavorable valuation metrics (PE and PB at 1 each), signaling potential overvaluation. Paycom’s diversified advantage across profitability and leverage metrics suggests superior capital allocation and financial discipline.
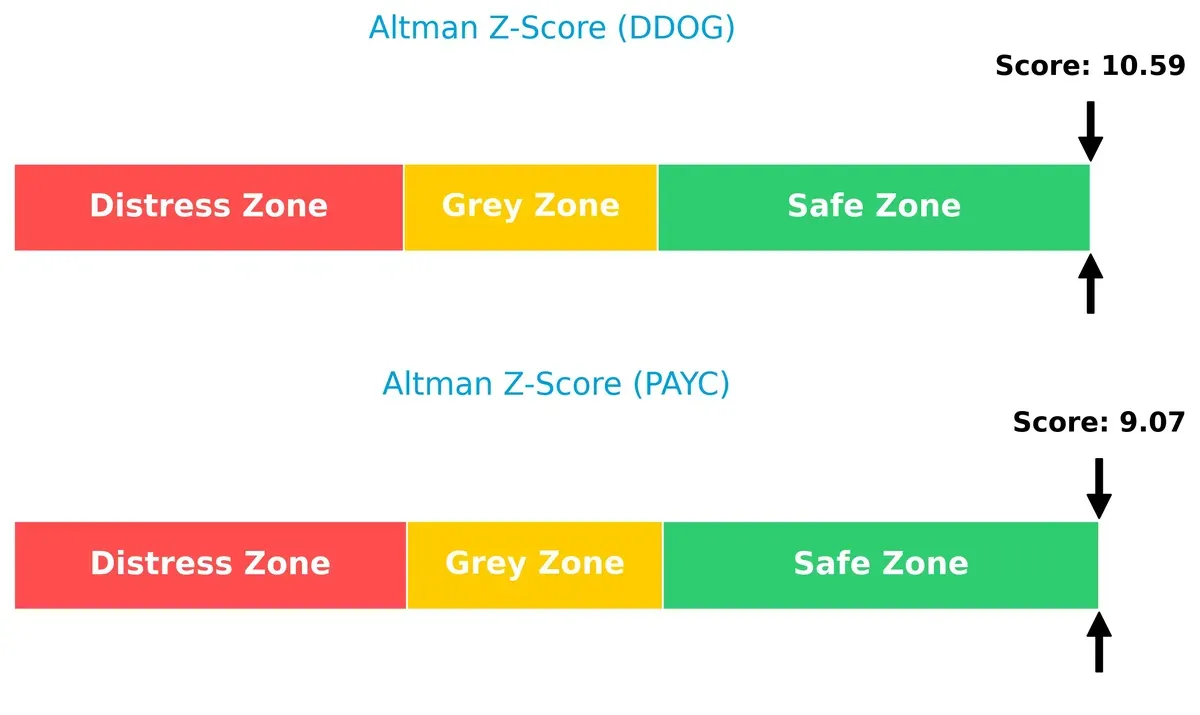
Bankruptcy Risk: Solvency Showdown
Paycom and Datadog both reside in Altman’s safe zone, but Paycom’s score (9.07) trails Datadog’s stronger 10.59, indicating a slightly safer financial footing for Datadog in this late-cycle environment:
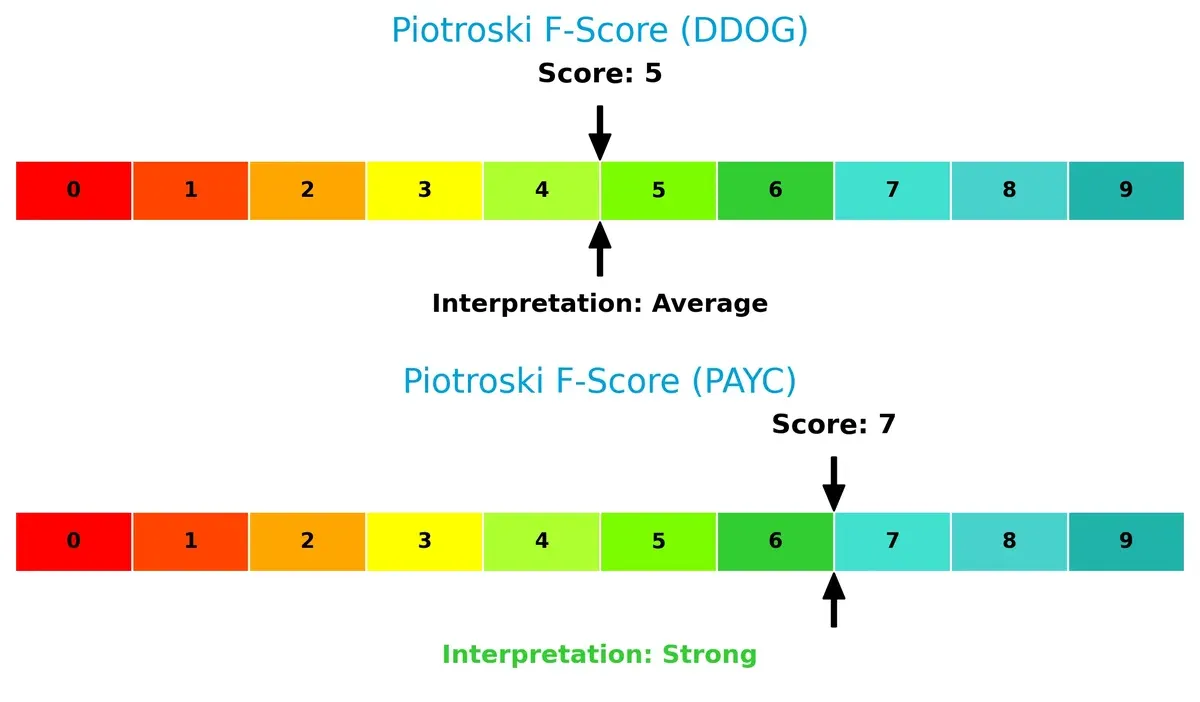
Financial Health: Quality of Operations
Paycom’s Piotroski F-Score of 7 signals strong internal financial health, outperforming Datadog’s average score of 5. This gap highlights Paycom’s superior operational quality and absence of red flags in key financial metrics:
How are the two companies positioned?
This section dissects Datadog and Paycom’s operational DNA by comparing revenue distribution and internal strengths and weaknesses. The goal is to confront their economic moats and identify which model offers the most resilient competitive advantage today.
Revenue Segmentation: The Strategic Mix
This comparison dissects how Datadog, Inc. and Paycom Software, Inc. diversify their income streams and where their primary sector bets lie:
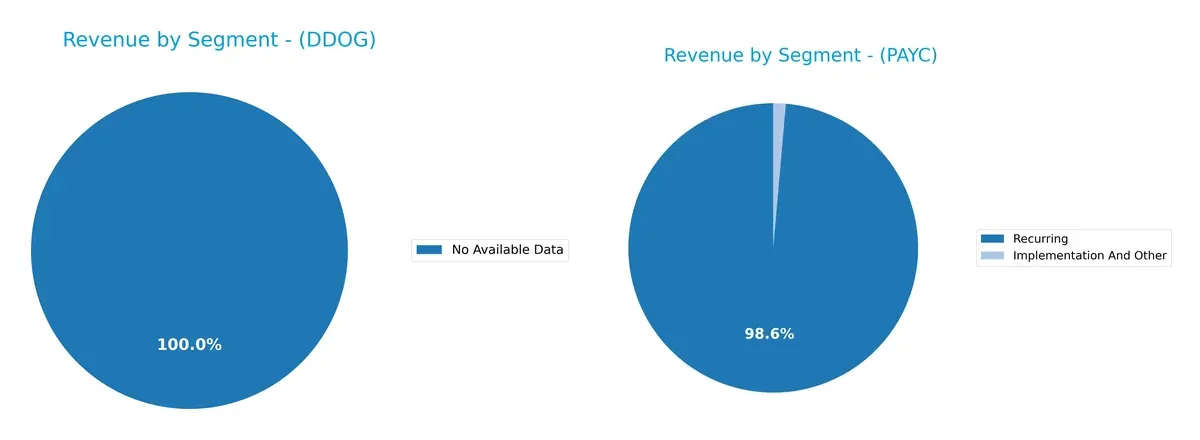
Datadog, Inc. lacks available segment data, limiting direct comparison. Paycom anchors 1.73B in recurring revenue, dwarfing its 24M implementation income. Paycom’s heavy concentration in recurring streams signals strong customer retention but a potential risk if market demand shifts. This focus contrasts with typical SaaS firms that diversify more broadly to hedge cyclical pressure. Paycom’s strategy pivots on ecosystem lock-in through subscription services.
Strengths and Weaknesses Comparison
This table compares the Strengths and Weaknesses of Datadog and Paycom based on key financial and operational metrics:
Datadog Strengths
- Strong quick ratio at 3.38 supports liquidity
- Low debt-to-equity of 0.41 indicates conservative leverage
- High interest coverage of 12.49 ensures debt service ability
- Notable fixed asset turnover at 6.2 shows efficient asset use
- Significant global revenue presence with 809M international sales
Paycom Strengths
- Robust net margin at 22.1% indicates strong profitability
- Favorable price-to-book ratio at 0 signals undervaluation
- Zero debt-to-equity ratio supports financial stability
- Recurring revenue of 1.73B ensures predictable cash flows
- Consistent revenue growth in recurring segment from 2018 to 2024
Datadog Weaknesses
- Negative ROIC at -0.74% shows capital inefficiency
- High P/E ratio at 438.37 suggests overvaluation risk
- Net margin low at 3.14% reflects weak profitability
- Unfavorable current ratio despite high value indicates potential working capital issues
- No dividend yield limits income prospects
Paycom Weaknesses
- Zero ROE and ROIC highlight profitability challenges
- Unavailable WACC obscures cost of capital analysis
- Negative interest coverage signals possible solvency risks
- Poor asset turnover metrics suggest operational inefficiency
- Unfavorable quick and current ratios raise liquidity concerns
Datadog’s strengths lie in liquidity, leverage, and international reach, but its profitability and valuation raise caution. Paycom demonstrates strong profitability and stable recurring revenue, yet financial ratios signal operational and liquidity risks. Both companies face distinct challenges that impact their financial resilience and strategic options.
The Moat Duel: Analyzing Competitive Defensibility
A structural moat protects long-term profits from competition’s relentless erosion. Without it, market leadership quickly dissolves:
Datadog, Inc.: Expanding Network Effects
Datadog’s moat lies in its integrated cloud monitoring platform, creating strong switching costs. Its growing ROIC trend signals improving efficiency despite current value destruction. New product launches in security monitoring could deepen its moat by 2026.
Paycom Software, Inc.: Intangible Asset Dominance
Paycom’s moat stems from proprietary HCM software with embedded data analytics, fostering customer stickiness. Unlike Datadog, its ROIC trend declines, raising concerns about sustaining returns. Expansion into AI-driven workforce management may offer future growth opportunities.
Network Effects vs. Intangible Assets: The Competitive Moat Showdown
Datadog’s improving ROIC trend gives it a deeper moat compared to Paycom’s weakening capital returns. I see Datadog better positioned to protect market share amid intensifying SaaS competition.
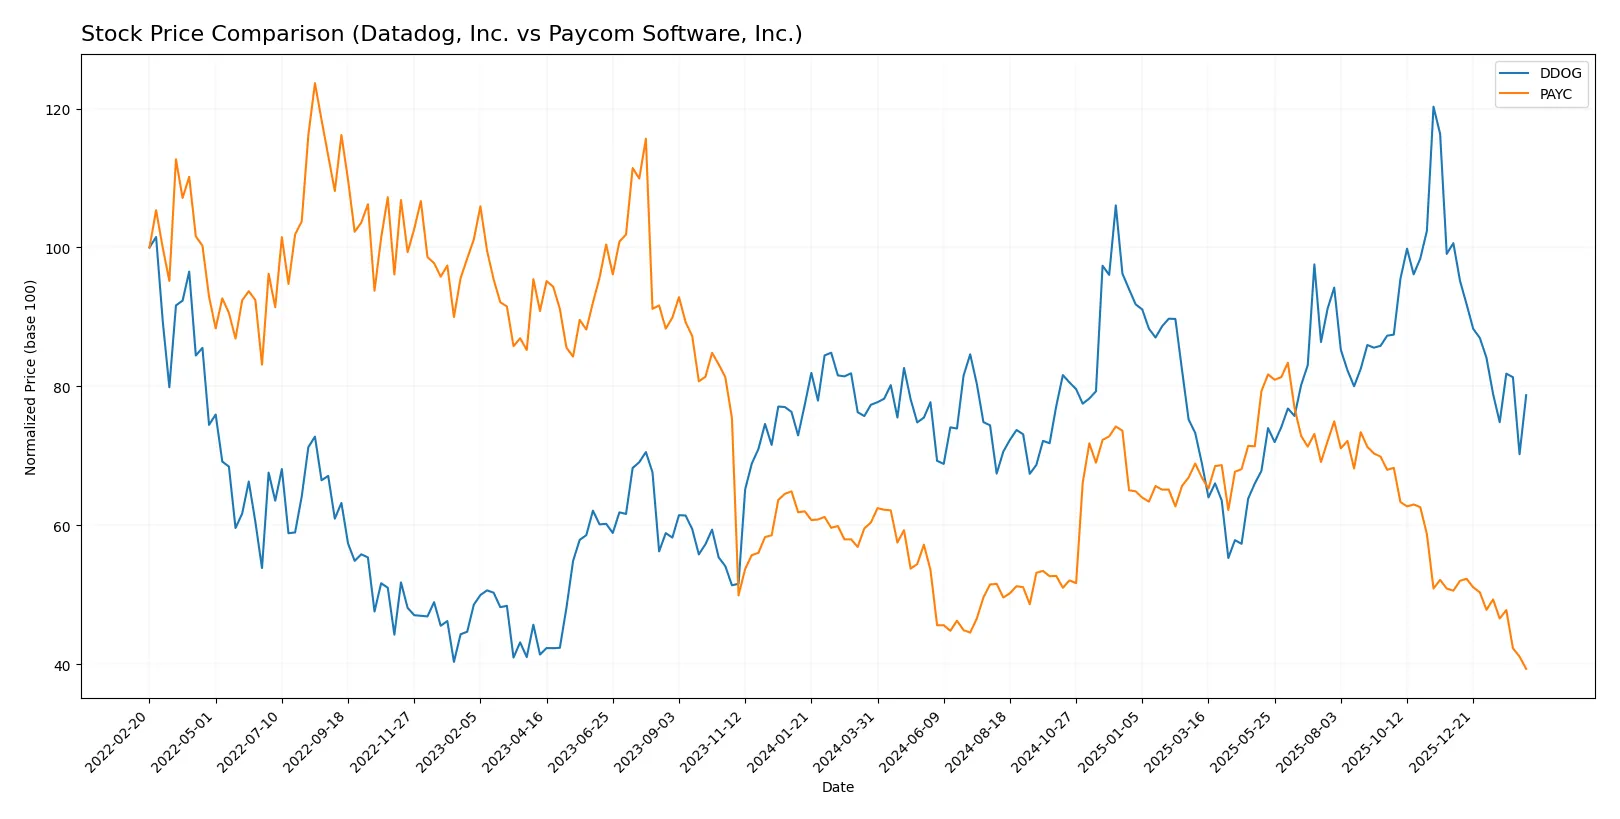
Which stock offers better returns?
Over the past 12 months, both Datadog and Paycom exhibited significant price shifts with contrasting overall trends and intensified selling pressure in recent months.
Trend Comparison
Datadog’s stock price rose 1.77% over the past year, signaling a mild bullish trend with decelerating momentum. The price ranged from a low of 87.93 to a high of 191.24.
Paycom’s stock declined 34.89% over the same period, confirming a strong bearish trend with deceleration. Its price fluctuated between 125.31 and 265.71, showing higher volatility than Datadog.
Datadog outperformed Paycom, delivering a modest positive return versus Paycom’s steep losses over the last year.
Target Prices
Analysts present a mixed but generally optimistic target price outlook for these software companies.
| Company | Target Low | Target High | Consensus |
|---|---|---|---|
| Datadog, Inc. | 105 | 215 | 175.07 |
| Paycom Software, Inc. | 115 | 210 | 151.82 |
Datadog’s target consensus stands significantly above its current price of $125, signaling upside potential. Paycom also shows room to grow, with consensus targets well above its $125 price, reflecting positive analyst expectations.

Don’t Let Luck Decide Your Entry Point
Optimize your entry points with our advanced ProRealTime indicators. You’ll get efficient buy signals with precise price targets for maximum performance. Start outperforming now!
How do institutions grade them?
Datadog, Inc. Grades
The following table summarizes recent institutional grades for Datadog, Inc.:
| Grading Company | Action | New Grade | Date |
|---|---|---|---|
| DA Davidson | Maintain | Buy | 2026-02-11 |
| Macquarie | Maintain | Outperform | 2026-02-11 |
| Barclays | Maintain | Overweight | 2026-02-11 |
| Rosenblatt | Maintain | Buy | 2026-02-11 |
| Raymond James | Maintain | Outperform | 2026-02-11 |
| Scotiabank | Maintain | Sector Outperform | 2026-02-11 |
| RBC Capital | Maintain | Outperform | 2026-02-11 |
| Wedbush | Maintain | Outperform | 2026-02-11 |
| Citizens | Maintain | Market Perform | 2026-02-11 |
| BTIG | Maintain | Buy | 2026-02-10 |
Paycom Software, Inc. Grades
The following table summarizes recent institutional grades for Paycom Software, Inc.:
| Grading Company | Action | New Grade | Date |
|---|---|---|---|
| Citigroup | Maintain | Neutral | 2026-02-13 |
| BMO Capital | Maintain | Market Perform | 2026-02-12 |
| Guggenheim | Maintain | Buy | 2026-02-12 |
| Keybanc | Maintain | Overweight | 2026-02-12 |
| Mizuho | Maintain | Neutral | 2026-02-12 |
| BTIG | Maintain | Buy | 2026-02-12 |
| Barclays | Maintain | Equal Weight | 2026-02-12 |
| Jefferies | Maintain | Hold | 2026-02-12 |
| Cantor Fitzgerald | Maintain | Neutral | 2026-02-12 |
| Cantor Fitzgerald | Maintain | Neutral | 2026-01-29 |
Which company has the best grades?
Datadog, Inc. consistently receives higher grades such as Buy and Outperform across multiple firms. Paycom Software, Inc. shows a mixed profile with more Neutral and Market Perform ratings. This suggests Datadog holds stronger institutional confidence, which may influence investor sentiment and valuation.
Risks specific to each company
The following categories identify the critical pressure points and systemic threats facing both firms in the 2026 market environment:
1. Market & Competition
Datadog, Inc.
- Faces intense competition in cloud monitoring with high product innovation demands.
Paycom Software, Inc.
- Competes in crowded HCM SaaS market, relying heavily on U.S. SMB segment growth.
2. Capital Structure & Debt
Datadog, Inc.
- Maintains moderate debt with favorable interest coverage, signaling controlled leverage risk.
Paycom Software, Inc.
- Shows minimal debt, indicating strong balance sheet but potential underutilization of leverage.
3. Stock Volatility
Datadog, Inc.
- Exhibits higher beta (1.29), reflecting greater price sensitivity to market swings.
Paycom Software, Inc.
- Lower beta (0.79) suggests more stable stock performance amid market fluctuations.
4. Regulatory & Legal
Datadog, Inc.
- Must navigate data privacy and cloud security regulations globally.
Paycom Software, Inc.
- Faces complex U.S. labor and payroll compliance requirements, raising regulatory risks.
5. Supply Chain & Operations
Datadog, Inc.
- Relies on global cloud infrastructure providers; exposure to outages or cost hikes.
Paycom Software, Inc.
- Dependent on stable U.S.-based data centers and software delivery channels.
6. ESG & Climate Transition
Datadog, Inc.
- Pressure to reduce cloud data center carbon footprint amid growing ESG scrutiny.
Paycom Software, Inc.
- ESG risk lower but needs to address social governance due to workforce management focus.
7. Geopolitical Exposure
Datadog, Inc.
- Global operations expose it to trade tensions and international data laws.
Paycom Software, Inc.
- Primarily U.S.-focused, limiting geopolitical risk but increasing domestic regulatory dependency.
Which company shows a better risk-adjusted profile?
The most impactful risk for Datadog is its high market volatility compounded by stiff global competition. Paycom’s key risk lies in its regulatory dependence on U.S. labor laws. Paycom shows a better risk-adjusted profile with lower stock volatility and a stronger balance sheet. Datadog’s soaring P/E ratio and beta highlight investor caution around growth sustainability.
Final Verdict: Which stock to choose?
Datadog, Inc. excels as a high-innovation growth engine with unmatched efficiency in cloud monitoring. Its rising profitability trend signals improving fundamentals. The main point of vigilance remains its current struggle to generate positive returns on invested capital. Datadog suits aggressive growth portfolios willing to tolerate valuation premiums.
Paycom Software, Inc. offers a durable strategic moat through its strong recurring revenue model and payroll software dominance. It presents a safer profile with solid cash flow generation and a stable balance sheet compared to Datadog. Paycom fits well within GARP portfolios seeking steady growth with reasonable valuation discipline.
If you prioritize rapid innovation and market expansion, Datadog is the compelling choice due to its accelerating revenue growth and improving profitability. However, if you seek a more stable cash flow and solid moat in enterprise software, Paycom offers better stability and a proven recurring revenue base. Both carry risks: Datadog’s high valuation and capital inefficiency, Paycom’s slowing ROIC trend.
Disclaimer: Investment carries a risk of loss of initial capital. The past performance is not a reliable indicator of future results. Be sure to understand risks before making an investment decision.
Go Further
I encourage you to read the complete analyses of Datadog, Inc. and Paycom Software, Inc. to enhance your investment decisions: