Home > Comparison > Technology > DDOG vs MTCH
The strategic rivalry between Datadog, Inc. and Match Group, Inc. shapes the current trajectory of the technology sector. Datadog operates as a capital-intensive SaaS platform delivering cloud infrastructure monitoring, while Match Group focuses on high-margin consumer-facing dating applications. This comparison highlights a contrast between enterprise-focused growth and consumer engagement value. This analysis will clarify which company’s corporate strategy offers superior risk-adjusted returns for a diversified portfolio in 2026.
Table of contents
Companies Overview
Datadog and Match Group hold pivotal roles in the evolving technology software landscape.
Datadog, Inc.: Cloud Monitoring Powerhouse
Datadog dominates the cloud monitoring and analytics sector. Its SaaS platform generates revenue by offering integrated infrastructure monitoring, application performance management, and security services globally. In 2026, the company sharpens its strategic focus on expanding real-time observability and incident management capabilities to deepen customer integration.
Match Group, Inc.: Global Dating Ecosystem Leader
Match Group commands the online dating industry with a diverse portfolio including Tinder and Hinge. It earns primarily through subscription fees and in-app purchases across its global user base. The firm’s 2026 strategy prioritizes enhancing user engagement and expanding brand reach to maintain its leadership in a competitive market.
Strategic Collision: Similarities & Divergences
Both companies thrive on software-as-a-service models but diverge sharply in target markets—Datadog serves enterprise IT operations; Match Group targets consumer social connections. Their primary battleground lies in user retention and platform scalability. Datadog appeals as a tech infrastructure play, while Match Group presents a consumer-driven growth profile with distinct monetization strategies.
Income Statement Comparison
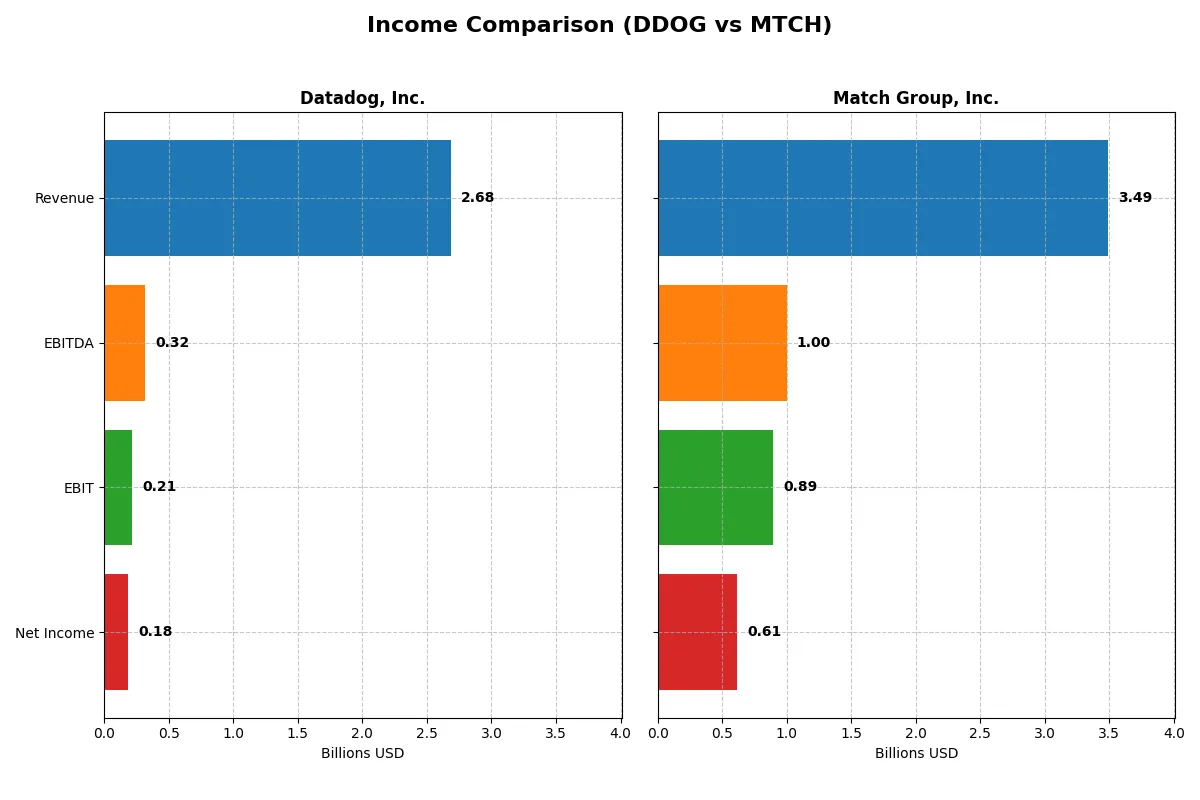
The following data dissects the core profitability and scalability of both corporate engines to reveal who dominates the bottom line:
| Metric | Datadog, Inc. (DDOG) | Match Group, Inc. (MTCH) |
|---|---|---|
| Revenue | 2.68B | 3.49B |
| Cost of Revenue | 516M | 948M |
| Operating Expenses | 2.11B | 1.67B |
| Gross Profit | 2.17B | 2.49B |
| EBITDA | 318M | 999M |
| EBIT | 211M | 894M |
| Interest Expense | 7M | 148M |
| Net Income | 184M | 613M |
| EPS | 0.55 | 2.12 |
| Fiscal Year | 2024 | 2025 |
Income Statement Analysis: The Bottom-Line Duel
This income statement comparison reveals which company drives efficiency and profitability through its core business operations.
Datadog, Inc. Analysis
Datadog’s revenue surged from 603M in 2020 to 2.68B in 2024, with net income turning positive after multi-year losses. Its gross margin holds strong at 80.8%, reflecting tight cost control. The 2024 net margin of 6.85% and a 217% EBIT growth indicate accelerating profitability and operational leverage.
Match Group, Inc. Analysis
Match Group’s revenue grew steadily from 3.0B in 2021 to 3.49B in 2025, with net income rising to 613M. Gross margin stands at a healthy 72.8%, while net margin reached 17.6%, showcasing robust profitability. Despite a flat 0.2% revenue growth last year, EBIT and net margin expansions signal operational resilience.
Verdict: Growth Velocity vs. Margin Strength
Datadog excels in rapid revenue and profit growth, achieving a lean 6.9% net margin from a high gross margin base. Match Group, meanwhile, boasts superior net margins above 17%, sustained by consistent revenue and profit gains. For investors seeking high growth momentum, Datadog’s profile is compelling; those prioritizing margin stability may prefer Match Group’s steady earnings power.
Financial Ratios Comparison
These vital ratios act as a diagnostic tool to expose the underlying fiscal health, valuation premiums, and capital efficiency of each company:
| Ratios | Datadog, Inc. (DDOG) | Match Group, Inc. (MTCH) |
|---|---|---|
| ROE | 6.77% | -8.66% |
| ROIC | 1.07% | 16.38% |
| P/E | 261.42x | 15.44x |
| P/B | 17.70x | -133.75x |
| Current Ratio | 2.64 | 2.54 |
| Quick Ratio | 2.64 | 2.54 |
| D/E | 0.68 | -62.09 |
| Debt-to-Assets | 31.8% | 88.5% |
| Interest Coverage | 7.68x | 5.14x |
| Asset Turnover | 0.46 | 0.78 |
| Fixed Asset Turnover | 6.72 | 22.00 |
| Payout ratio | 0% | 30.36% |
| Dividend yield | 0% | 2.38% |
| Fiscal Year | 2024 | 2024 |
Efficiency & Valuation Duel: The Vital Signs
Financial ratios form the company’s DNA, exposing hidden risks and revealing operational excellence that raw numbers alone cannot convey.
Datadog, Inc.
Datadog shows moderate profitability with a 6.77% ROE and a neutral 6.85% net margin. Its valuation is stretched, marked by an extreme P/E of 261.4 and a high P/B of 17.7. The company pays no dividend, opting to reinvest heavily in R&D, which accounts for over 40% of revenue, aiming for long-term growth despite current profitability challenges.
Match Group, Inc.
Match Group delivers strong operational efficiency with a 22.5% ROIC and a healthy 17.6% net margin. Its valuation is attractive, featuring a modest P/E of 12.8 and a favorable dividend yield of 2.38%. The company balances shareholder returns through dividends and maintains solid interest coverage, though a high debt-to-assets ratio at 89% signals leveraged risk.
Premium Valuation vs. Operational Safety
Datadog’s premium valuation reflects growth aspirations but carries elevated risk due to weak returns and high multiples. Match Group offers a better risk-reward balance with efficient capital use, steady margins, and shareholder-friendly dividends. Growth-oriented investors may favor Datadog’s profile; income and stability seekers might prefer Match’s operational safety.
Which one offers the Superior Shareholder Reward?
Datadog (DDOG) pays no dividends and focuses on reinvestment, boasting a free cash flow per share of $2.49 and nearly 96% FCF coverage, with no buyback activity reported. Match Group (MTCH) offers a 2.38% dividend yield, a 30% payout ratio, and substantial buybacks, generating $4.22 in free cash flow per share. I see MTCH’s blend of dividends and active buybacks as a more balanced, sustainable shareholder reward in 2026. DDOG’s reinvestment strategy suits growth-focused investors but lacks immediate returns. MTCH’s distribution model delivers superior total return potential, combining income and capital return efficiently.
Comparative Score Analysis: The Strategic Profile
The radar chart reveals the fundamental DNA and trade-offs of Datadog, Inc. and Match Group, Inc., highlighting their core financial strengths and weaknesses:
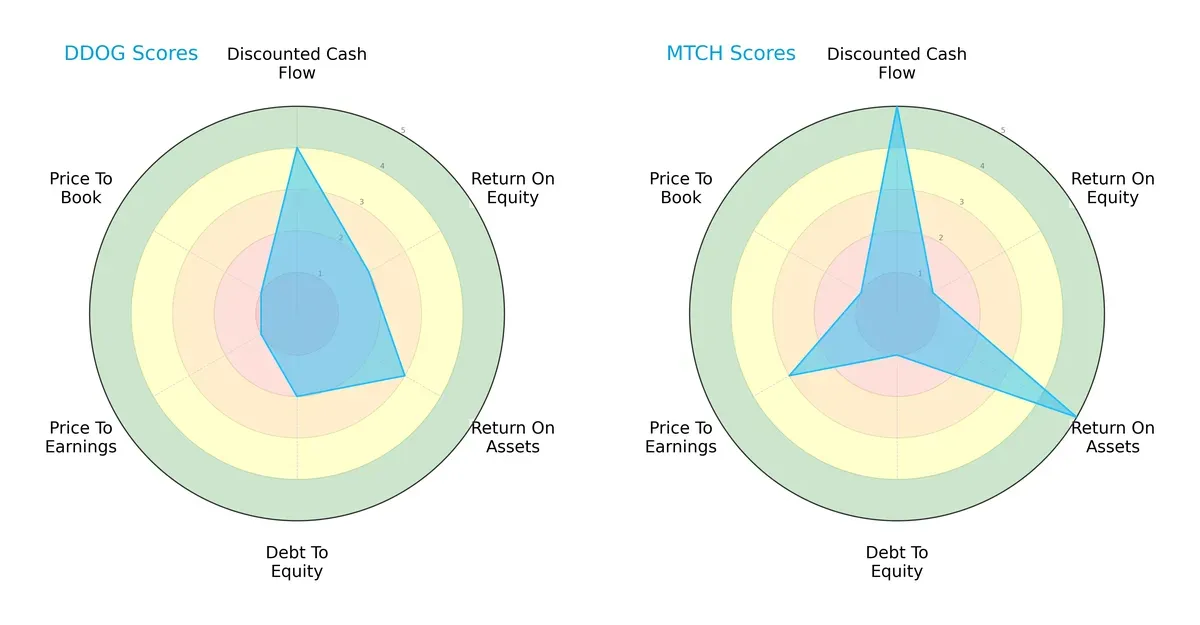
Datadog shows strength in discounted cash flow (4) and moderate asset returns (3) but struggles with equity returns (2) and carries a higher debt burden (2). Its valuation metrics (PE/PB at 1) appear very unfavorable. Match Group excels in discounted cash flow (5) and asset efficiency (5) but has poor equity returns (1) and a weak debt profile (1). Match’s valuation is moderately better priced on PE (3) but equally challenged on PB (1). Match Group’s profile is more polarized, relying heavily on asset utilization and cash flow, while Datadog presents a somewhat more balanced but generally weaker score set.
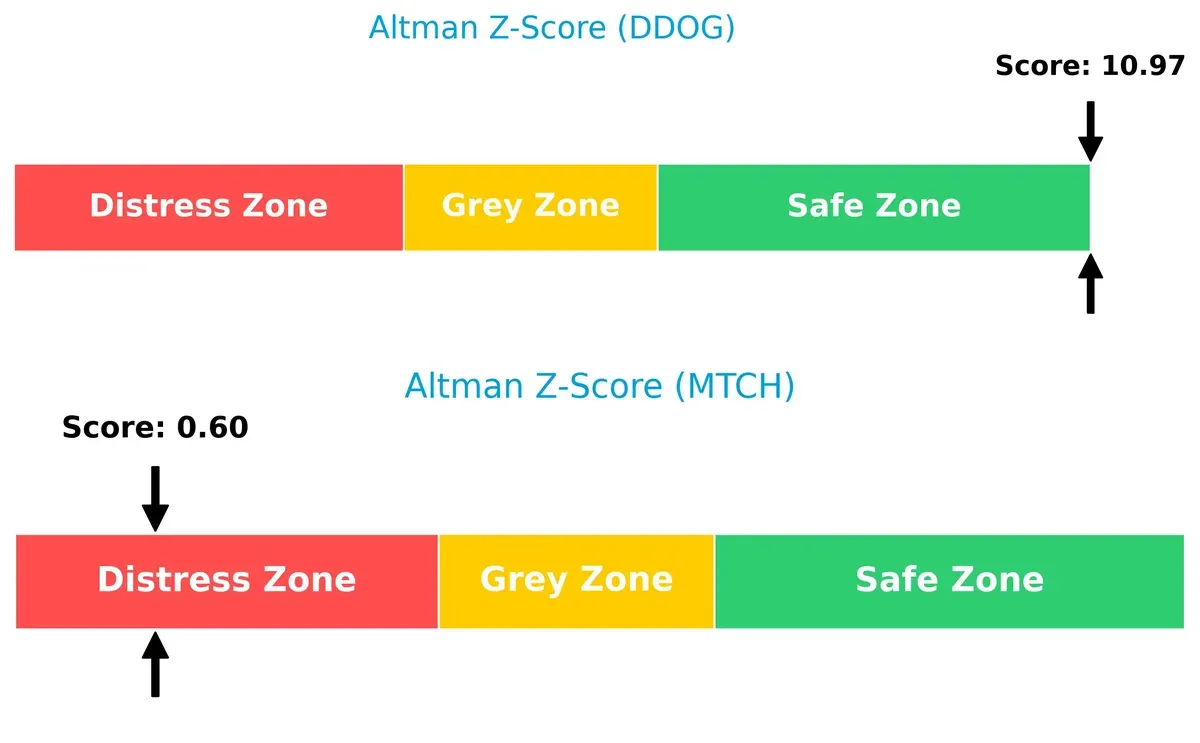
Bankruptcy Risk: Solvency Showdown
Datadog’s Altman Z-Score at 10.97 signifies a very safe zone, indicating strong long-term survival prospects. Match Group’s score of 0.60 places it in distress zone, signaling high bankruptcy risk in this cycle:
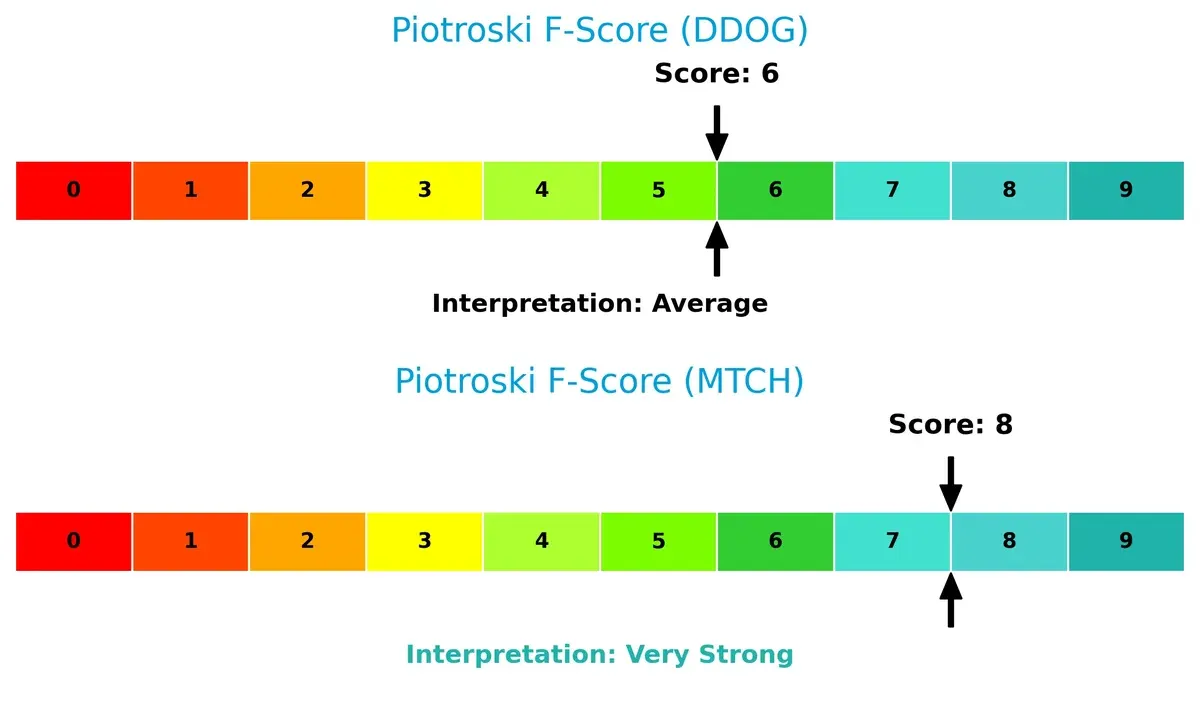
Financial Health: Quality of Operations
Match Group scores an 8 on the Piotroski F-Score, showing very strong operational health and internal financial quality. Datadog’s score of 6 is average, suggesting some internal metrics need improvement to match Match’s robustness:
How are the two companies positioned?
This section dissects the operational DNA of Datadog and Match Group by comparing their revenue distribution and internal strengths and weaknesses. The goal is to confront their economic moats and identify which business model offers the most resilient competitive advantage in today’s market.
Revenue Segmentation: The Strategic Mix
The following visual comparison dissects how Datadog, Inc. and Match Group, Inc. diversify their income streams and where their primary sector bets lie:
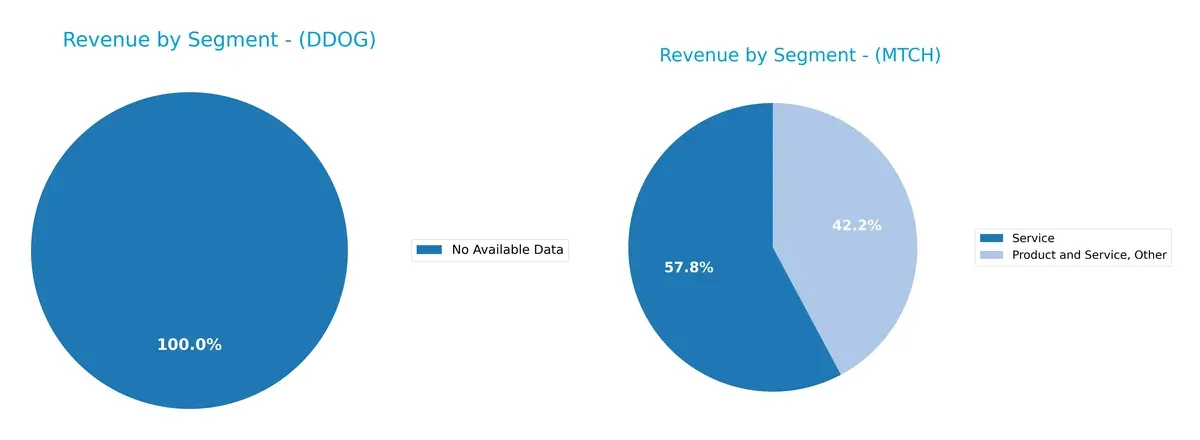
Datadog lacks available segment data, so I cannot assess its revenue diversification. Match Group pivots heavily on its “Match Group” segment with $2B in 2019, anchoring its revenue. Other segments like “Emerging & Other” remain minor, indicating concentration risk. This focus suggests Match Group relies on ecosystem lock-in within online dating, exposing it to shifts in consumer preferences without broader diversification buffers.
Strengths and Weaknesses Comparison
This table compares the strengths and weaknesses of Datadog, Inc. and Match Group, Inc.:
Datadog Strengths
- Strong liquidity with current and quick ratios at 2.64
- Favorable interest coverage at 29.85
- Global presence growing with $810M international revenue
- High fixed asset turnover at 6.72
Match Group Strengths
- Higher profitability with 17.59% net margin
- Strong ROIC at 22.5% exceeding WACC of 7.81%
- Diverse product and service revenue streams
- Favorable valuation with PE of 12.77
- Solid global footprint with $1.59B U.S. and $1.89B non-U.S. sales
Datadog Weaknesses
- Low ROIC at 1.07% below WACC of 9.55%
- Unfavorable ROE at 6.77%
- High PE (261.42) and PB (17.7) ratios suggest overvaluation
- Asset turnover low at 0.46
Match Group Weaknesses
- Negative ROE at -241.99% signals poor equity returns
- High debt-to-assets ratio at 89.06% indicates leverage risk
- Net margin and asset turnover show mixed signals
- Negative PB ratio unusual, indicating accounting or market concerns
Datadog displays solid liquidity and operational efficiency but struggles with profitability and valuation metrics. Match Group shows robust profitability and diversified revenue but faces risks from high leverage and negative equity returns. These contrasts highlight differing strategic challenges for each company.
The Moat Duel: Analyzing Competitive Defensibility
A structural moat is the only safeguard that protects long-term profits from relentless competition and market pressures:
Datadog, Inc.: Intangible Asset Moat via Platform Integration
Datadog’s core advantage lies in its integrated SaaS monitoring platform, delivering strong margin stability and rapid revenue growth. Its expanding cloud observability tools deepen this moat in 2026.
Match Group, Inc.: Network Effects from Brand Portfolio
Match Group leverages powerful network effects across its dating brands, maintaining high EBIT margins and steady net income growth. Its diverse user base supports resilience and expansion opportunities.
Platform Integration vs. Network Effects: Which Moat Holds Stronger?
Match Group’s moat is wider and more value-creative, with ROIC exceeding WACC by 15%, signaling sustainable competitive advantage. Datadog shows rising profitability but still destroys value, making Match Group better positioned to defend market share.
Which stock offers better returns?
Over the past 12 months, both Datadog, Inc. and Match Group, Inc. experienced downward price trends with notable fluctuations and differing volatility levels.
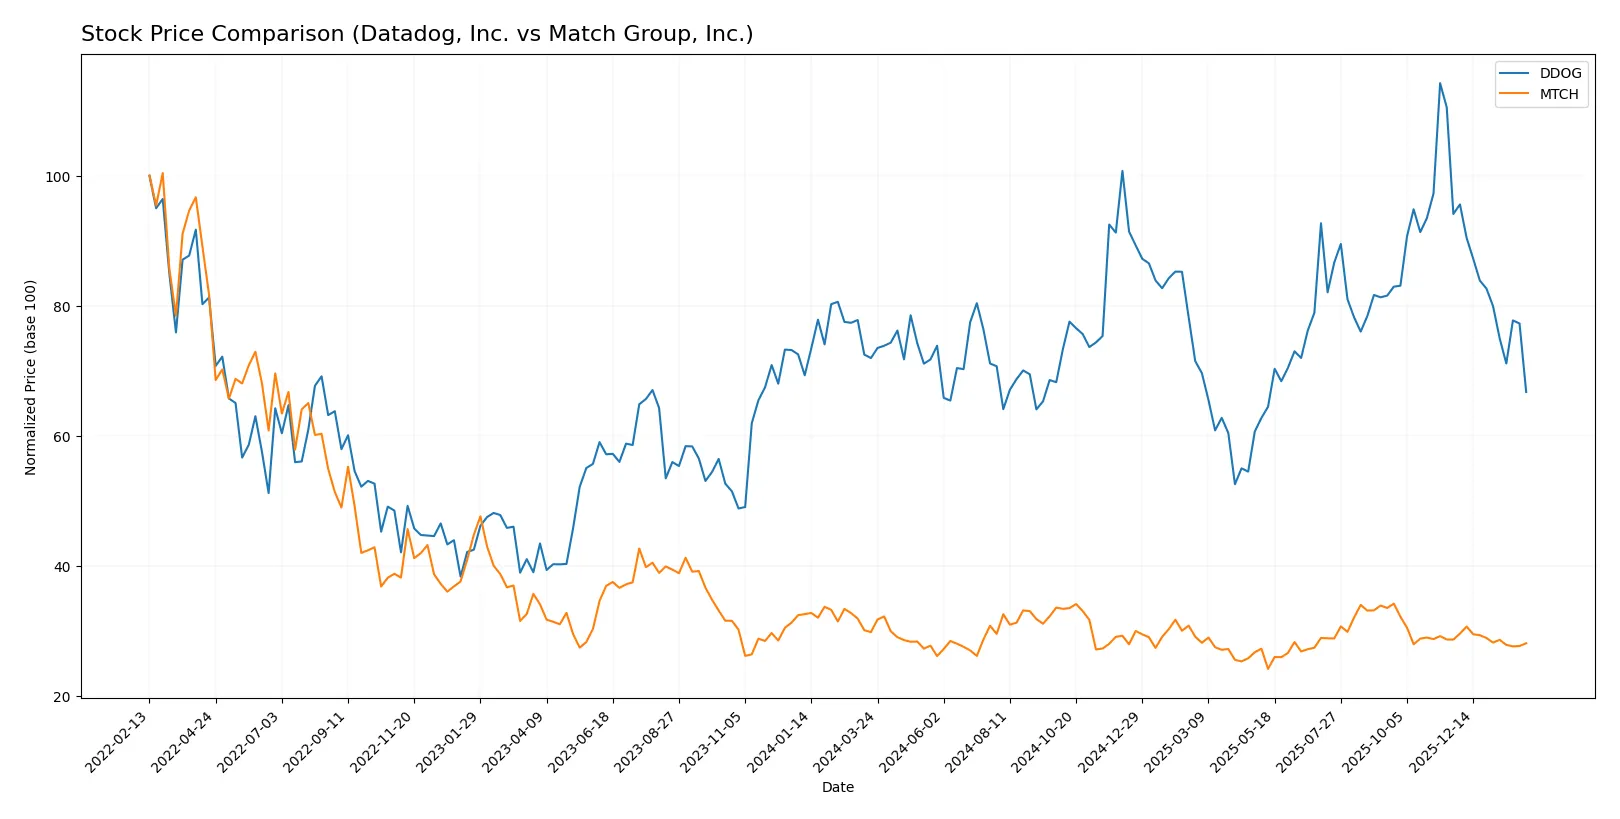
Trend Comparison
Datadog, Inc. shows a bearish trend with a -7.25% price decline over the past year, decelerating from a high of 191.24 to a low of 87.93, amid high volatility (18.7 std deviation).
Match Group, Inc. also exhibits a bearish trend with a -5.72% price drop over the past year, decelerating steadily between 38.51 and 27.18, supported by low volatility (2.61 std deviation).
Datadog’s larger price decline and higher volatility contrast with Match Group’s milder losses and steadier trend, placing Match Group ahead in market performance.
Target Prices
Analysts present a cautiously optimistic consensus for Datadog, Inc. and Match Group, Inc.
| Company | Target Low | Target High | Consensus |
|---|---|---|---|
| Datadog, Inc. | 105 | 215 | 176 |
| Match Group, Inc. | 33 | 43 | 36 |
Datadog’s target consensus at 176 suggests significant upside from its 111.69 price, reflecting strong growth expectations. Match Group’s 36 target consensus indicates moderate upside versus its 31.63 price, signaling steady market confidence.

Don’t Let Luck Decide Your Entry Point
Optimize your entry points with our advanced ProRealTime indicators. You’ll get efficient buy signals with precise price targets for maximum performance. Start outperforming now!
How do institutions grade them?
Datadog, Inc. Grades
Here are the recent institutional grades for Datadog, Inc.:
| Grading Company | Action | New Grade | Date |
|---|---|---|---|
| Cantor Fitzgerald | Maintain | Overweight | 2026-02-06 |
| Keybanc | Maintain | Overweight | 2026-02-04 |
| Evercore ISI Group | Maintain | Outperform | 2026-02-02 |
| DA Davidson | Maintain | Buy | 2026-02-02 |
| Rosenblatt | Maintain | Buy | 2026-01-30 |
| Scotiabank | Maintain | Sector Outperform | 2026-01-27 |
| Stifel | Upgrade | Buy | 2026-01-22 |
| TD Cowen | Maintain | Buy | 2026-01-21 |
| Mizuho | Maintain | Outperform | 2026-01-21 |
| Citigroup | Maintain | Buy | 2026-01-16 |
Match Group, Inc. Grades
Here are the recent institutional grades for Match Group, Inc.:
| Grading Company | Action | New Grade | Date |
|---|---|---|---|
| TD Cowen | Maintain | Buy | 2026-02-05 |
| JP Morgan | Maintain | Neutral | 2026-02-04 |
| Truist Securities | Maintain | Hold | 2026-02-04 |
| Morgan Stanley | Maintain | Equal Weight | 2026-01-13 |
| Truist Securities | Maintain | Hold | 2025-11-05 |
| Evercore ISI Group | Maintain | In Line | 2025-11-05 |
| Wells Fargo | Maintain | Equal Weight | 2025-11-05 |
| Morgan Stanley | Maintain | Equal Weight | 2025-10-20 |
| Susquehanna | Maintain | Positive | 2025-08-07 |
| JP Morgan | Maintain | Neutral | 2025-08-06 |
Which company has the best grades?
Datadog holds consistently stronger grades, including multiple Buy and Outperform ratings. Match Group’s ratings mostly cluster around Hold and Equal Weight, suggesting more cautious sentiment. Investors may interpret Datadog’s grades as reflecting greater confidence in growth prospects.
Risks specific to each company
The following categories identify critical pressure points and systemic threats facing both Datadog, Inc. and Match Group, Inc. in the 2026 market environment:
1. Market & Competition
Datadog, Inc.
- Faces intense SaaS competition in cloud monitoring and observability with high innovation demands.
Match Group, Inc.
- Operates in a saturated dating market with major brand rivalry and shifting user preferences.
2. Capital Structure & Debt
Datadog, Inc.
- Maintains moderate leverage (D/E 0.68) with strong interest coverage (29.85), signaling stable debt management.
Match Group, Inc.
- Shows high debt-to-assets (89%) and negative debt-to-equity, indicating financial risk despite adequate interest coverage.
3. Stock Volatility
Datadog, Inc.
- Beta at 1.29 suggests higher sensitivity to market swings, typical for growth tech stocks.
Match Group, Inc.
- Beta at 1.32 implies slightly higher volatility, reflecting market uncertainties and competitive pressures.
4. Regulatory & Legal
Datadog, Inc.
- Exposure to data privacy and cybersecurity regulations affecting cloud software providers globally.
Match Group, Inc.
- Faces legal scrutiny over user data protection and compliance in multiple jurisdictions worldwide.
5. Supply Chain & Operations
Datadog, Inc.
- Relies on cloud infrastructure partnerships, vulnerable to service disruptions or cost increases.
Match Group, Inc.
- Operations depend on continuous digital platform availability and content moderation, with risks from platform outages.
6. ESG & Climate Transition
Datadog, Inc.
- Pressure to enhance energy efficiency in data centers and reduce carbon footprint.
Match Group, Inc.
- Faces growing expectations on social responsibility and data ethics in user interactions and content.
7. Geopolitical Exposure
Datadog, Inc.
- Global footprint exposes it to geopolitical tensions affecting cloud data regulations and market access.
Match Group, Inc.
- International operations face risks from regional restrictions on dating services and digital censorship.
Which company shows a better risk-adjusted profile?
Match Group’s highest risk is its elevated financial leverage, threatening stability despite solid profitability and operational efficiency. Datadog struggles primarily with market competition and valuation concerns amid moderate financial leverage. Despite Match Group’s distress-level Altman Z-score, its favorable operating metrics and Piotroski score suggest stronger resilience. Datadog’s better liquidity and interest coverage are offset by weaker returns and expensive valuation multiples. The recent surge in Match’s fixed asset turnover and net margin signals operational strength, but its debt burden remains a red flag. I conclude Match Group offers a superior risk-adjusted profile due to higher profitability and efficiency, balanced against financial risk.
Final Verdict: Which stock to choose?
Datadog, Inc. wields a superpower in its rapid revenue and earnings growth, signaling a dynamic expansion phase. Its increasing profitability hints at improving capital efficiency despite current value destruction, marking a point of vigilance. It suits investors embracing aggressive growth and volatility.
Match Group, Inc. benefits from a strategic moat rooted in recurring revenue and strong free cash flow generation. Its robust ROIC above WACC and favorable valuation metrics suggest value creation and stability relative to Datadog. It fits well within a Growth at a Reasonable Price (GARP) portfolio.
If you prioritize rapid growth and can tolerate valuation risks, Datadog offers compelling upside through its accelerating profitability. However, if you seek a company with a sustainable competitive moat and better financial stability, Match Group outshines with stronger capital efficiency and a more compelling margin of safety. Each scenario caters to distinct investor profiles with different risk appetites.
Disclaimer: Investment carries a risk of loss of initial capital. The past performance is not a reliable indicator of future results. Be sure to understand risks before making an investment decision.
Go Further
I encourage you to read the complete analyses of Datadog, Inc. and Match Group, Inc. to enhance your investment decisions: