In the fast-evolving software industry, Intuit Inc. and Datadog, Inc. stand out as leaders with distinct yet overlapping market focuses. Intuit excels in financial management solutions for small businesses and consumers, while Datadog specializes in cloud infrastructure monitoring and analytics. Both companies emphasize innovation to capture growing digital demands. This article will help you navigate their strengths and uncover which presents the most compelling investment opportunity in 2026.
Table of contents
Companies Overview
I will begin the comparison between Intuit and Datadog by providing an overview of these two companies and their main differences.
Intuit Overview
Intuit Inc. focuses on financial management and compliance products for consumers, small businesses, self-employed individuals, and accounting professionals across the US, Canada, and internationally. Its offerings include QuickBooks for business accounting, TurboTax for tax preparation, Credit Karma for personal finance, and ProConnect for professional tax software. Founded in 1983, Intuit is a prominent player in the software application industry with a market cap of $152B.
Datadog Overview
Datadog, Inc. delivers a cloud-based SaaS platform that provides monitoring and analytics for developers, IT operations, and business users worldwide. Its services encompass infrastructure monitoring, application performance, log management, security, and real-time observability of technology stacks. Established in 2010 and headquartered in New York, Datadog operates in the software application sector with a market cap of $41.5B.
Key similarities and differences
Both Intuit and Datadog operate within the software application industry and serve a global customer base with cloud-based solutions. While Intuit focuses on financial management and compliance products targeting individual and business financial needs, Datadog specializes in technology monitoring and analytics for IT and development teams. Intuit’s product portfolio spans multiple financial services, whereas Datadog concentrates on real-time observability and security monitoring within cloud environments.
Income Statement Comparison
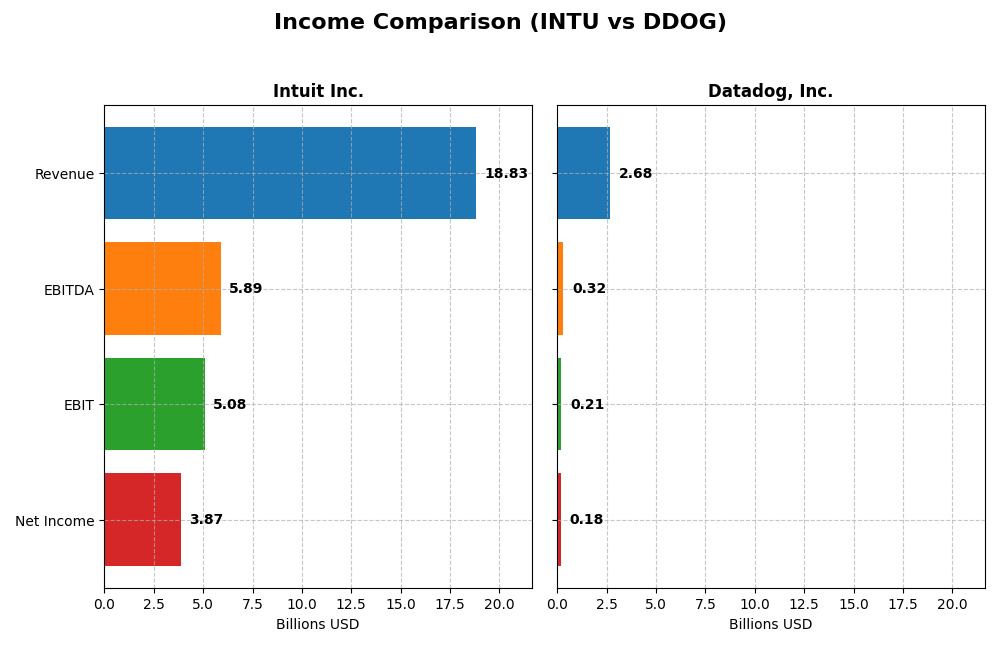
The following table presents a side-by-side comparison of key income statement metrics for Intuit Inc. and Datadog, Inc. based on their most recent fiscal year results.
| Metric | Intuit Inc. (INTU) | Datadog, Inc. (DDOG) |
|---|---|---|
| Market Cap | 152B | 41.5B |
| Revenue | 18.8B | 2.68B |
| EBITDA | 5.89B | 318M |
| EBIT | 5.08B | 211M |
| Net Income | 3.87B | 184M |
| EPS | 13.82 | 0.55 |
| Fiscal Year | 2025 | 2024 |
Income Statement Interpretations
Intuit Inc.
Intuit exhibited strong revenue growth from $9.63B in 2021 to $18.83B in 2025, with net income rising from $2.06B to $3.87B over the same period, reflecting solid profitability expansion. Margins remained robust, with a gross margin of 80.76% and a net margin of 20.55% in 2025. The latest year showed healthy growth acceleration in revenue (15.63%) and net income (12.92%).
Datadog, Inc.
Datadog’s revenue surged from $603M in 2020 to $2.68B in 2024, accompanied by a significant net income turnaround from a loss of $25M to a positive $184M. Margins improved notably, with a gross margin of 80.76% and a net margin of 6.85% in 2024. The most recent year reflected strong performance gains, including a 26.12% revenue increase and a near 200% net margin growth.
Which one has the stronger fundamentals?
Both companies demonstrate favorable fundamentals with robust revenue and net income growth. Intuit delivers higher absolute profits and stronger net margins, indicating stable profitability. Datadog shows exceptional growth rates and margin improvements from a smaller base, reflecting rapid expansion. Intuit’s fundamentals emphasize consistent scale, whereas Datadog highlights dynamic growth potential.
Financial Ratios Comparison
The table below presents the most recent financial ratios for Intuit Inc. and Datadog, Inc., offering a side-by-side comparison based on their fiscal year 2025 and 2024 data respectively.
| Ratios | Intuit Inc. (2025) | Datadog, Inc. (2024) |
|---|---|---|
| ROE | 19.6% | 6.8% |
| ROIC | 14.8% | 1.1% |
| P/E | 56.8 | 261.4 |
| P/B | 11.2 | 17.7 |
| Current Ratio | 1.36 | 2.64 |
| Quick Ratio | 1.36 | 2.64 |
| D/E | 0.34 | 0.68 |
| Debt-to-Assets | 18.0% | 31.8% |
| Interest Coverage | 19.9 | 7.7 |
| Asset Turnover | 0.51 | 0.46 |
| Fixed Asset Turnover | 12.5 | 6.7 |
| Payout ratio | 30.7% | 0% |
| Dividend yield | 0.54% | 0% |
Interpretation of the Ratios
Intuit Inc.
Intuit exhibits predominantly strong financial ratios, including a favorable net margin of 20.55%, return on equity at 19.63%, and return on invested capital of 14.78%. However, its high price-to-earnings ratio of 56.82 and price-to-book of 11.15 are unfavorable, indicating a relatively expensive valuation. The company pays dividends, but with a low yield of 0.54%, suggesting modest shareholder returns and a cautious payout policy.
Datadog, Inc.
Datadog shows a mixed financial profile with a neutral net margin of 6.85% and unfavorable returns on equity (6.77%) and invested capital (1.07%). Its valuation multiples, including a high P/E of 261.42 and P/B of 17.7, are unfavorable, reflecting growth expectations. The company does not pay dividends, likely focusing on reinvestment and growth, supported by favorable liquidity ratios and interest coverage.
Which one has the best ratios?
Intuit presents a more favorable overall ratio profile with 57.14% favorable metrics versus Datadog’s 28.57%, reflecting stronger profitability, solvency, and operational efficiency. Datadog’s elevated valuation ratios and weaker returns indicate greater risk, while Intuit’s dividend payments, albeit low, add a layer of shareholder return stability.
Strategic Positioning
This section compares the strategic positioning of Intuit and Datadog, focusing on Market position, Key segments, and exposure to disruption:
Intuit Inc.
- Large market cap of 152B; faces competition in software for finance and accounting.
- Diverse segments: Small Business, Consumer, Credit Karma, ProConnect tax solutions.
- Operates in established financial software; technological disruption risk moderate.
Datadog, Inc.
- Market cap of 41.5B; competes in cloud monitoring and analytics SaaS.
- Focused on cloud monitoring platform integrating IT and security observability.
- Exposed to rapid tech evolution in cloud and security monitoring platforms.
Intuit vs Datadog Positioning
Intuit pursues a diversified approach with multiple business segments across financial management and tax, providing broad revenue streams. Datadog concentrates on cloud monitoring and observability, relying on a specialized SaaS platform with rapid innovation requirements.
Which has the best competitive advantage?
Intuit shows a slightly favorable economic moat by creating value despite declining profitability. Datadog has a slightly unfavorable moat, shedding value though improving profitability, indicating Intuit currently holds a stronger competitive advantage.
Stock Comparison
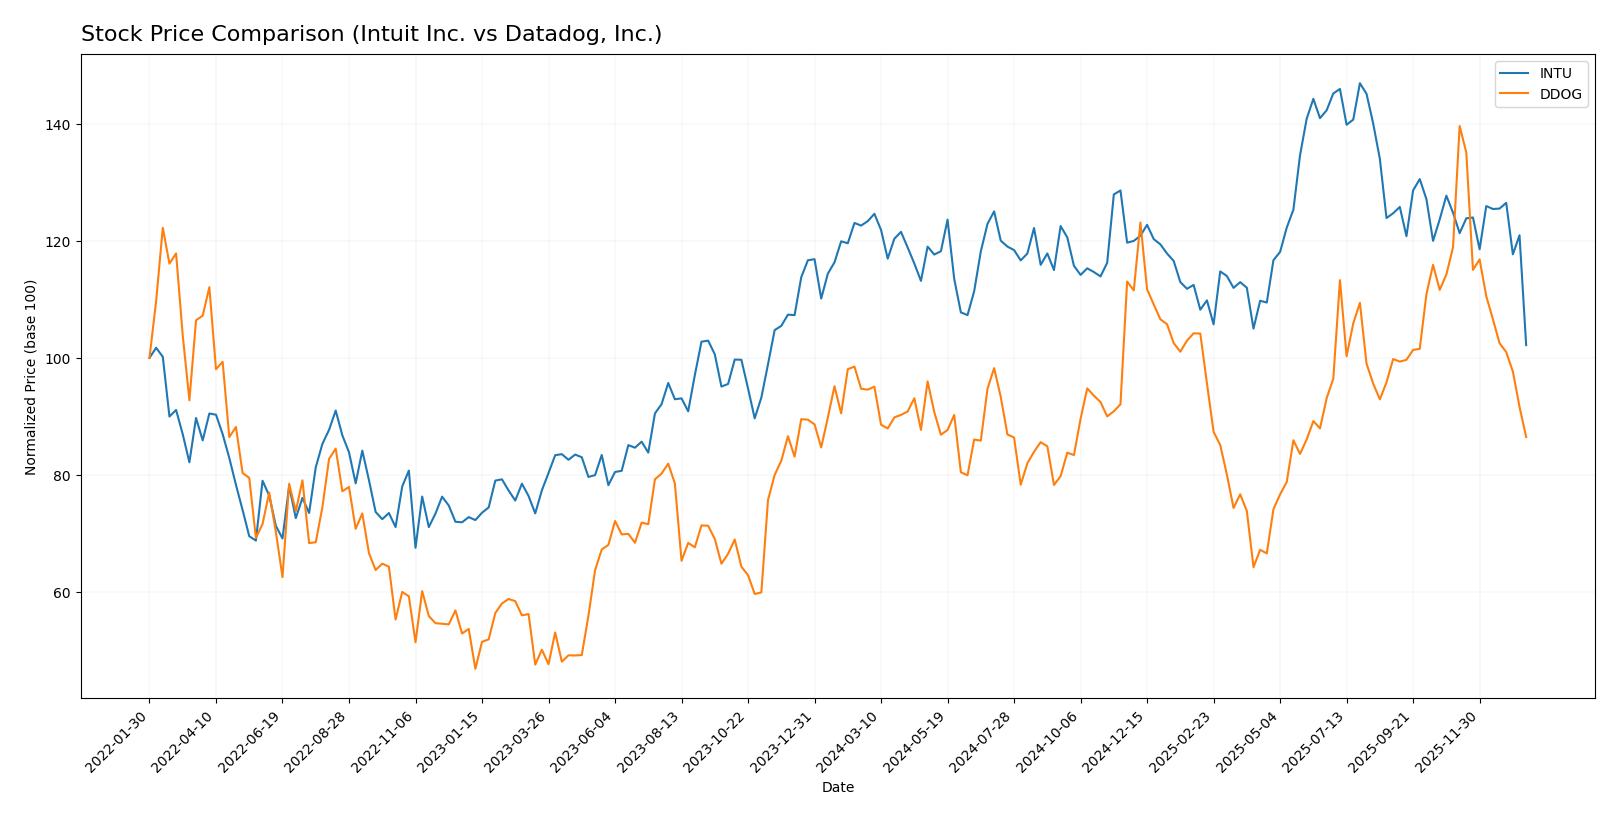
The stock price movements of Intuit Inc. and Datadog, Inc. over the past 12 months reveal sustained bearish trends with varying degrees of decline and trading volume dynamics.
Trend Analysis
Intuit Inc. experienced a 17.17% price decline over the past year, indicating a bearish trend with deceleration. The stock showed high volatility, ranging from 546.5 to 785.95, with recent losses accelerating at -18.13%.
Datadog, Inc. saw an 8.56% decrease over the same period, also bearish with deceleration. Its volatility was lower than Intuit’s, with prices fluctuating between 87.93 and 191.24. Recent declines intensified to -27.26%.
Comparatively, both stocks are bearish, but Intuit’s larger overall price drop contrasts with Datadog’s sharper recent fall. Intuit delivered a higher cumulative market loss over the past year.
Target Prices
Here is the consensus target price overview based on reliable analyst data:
| Company | Target High | Target Low | Consensus |
|---|---|---|---|
| Intuit Inc. | 880 | 700 | 798.4 |
| Datadog, Inc. | 215 | 105 | 177.67 |
Analysts generally expect significant upside for both Intuit and Datadog, with target consensuses well above current prices of $546.65 and $118.43 respectively, indicating potential growth opportunities.
Analyst Opinions Comparison
This section compares analysts’ ratings and financial scores for Intuit Inc. and Datadog, Inc.:
Rating Comparison
Intuit Inc. Rating
- Rating: B, indicating a very favorable overall evaluation.
- Discounted Cash Flow Score: 4, showing favorable valuation.
- ROE Score: 4, reflecting favorable efficiency in equity use.
- ROA Score: 5, very favorable asset utilization efficiency.
- Debt To Equity Score: 2, moderate financial risk profile.
- Overall Score: 3, indicating moderate overall financial health.
Datadog, Inc. Rating
- Rating: C+, also marked as very favorable by analysts.
- Discounted Cash Flow Score: 4, similarly favorable valuation.
- ROE Score: 2, indicating moderate performance in equity use.
- ROA Score: 3, moderate asset utilization.
- Debt To Equity Score: 2, also moderate financial risk.
- Overall Score: 2, showing moderate but lower financial health.
Which one is the best rated?
Based strictly on the provided data, Intuit Inc. is better rated with a higher overall score (3 vs. 2), stronger ROE and ROA scores, and the same discounted cash flow and debt-to-equity scores as Datadog.
Scores Comparison
Here is a comparison of the Altman Z-Score and Piotroski Score for Intuit Inc. and Datadog, Inc.:
Intuit Inc. Scores
- Altman Z-Score: 9.35, indicating a safe zone with low bankruptcy risk.
- Piotroski Score: 9, classified as very strong financial health.
Datadog, Inc. Scores
- Altman Z-Score: 11.37, indicating a safe zone with very low bankruptcy risk.
- Piotroski Score: 6, reflecting average financial strength.
Which company has the best scores?
Datadog has a higher Altman Z-Score, suggesting a slightly lower bankruptcy risk, while Intuit has a stronger Piotroski Score, indicating better financial health. Both have scores reflecting financial stability.
Grades Comparison
Here is a detailed comparison of recent grades and ratings for Intuit Inc. and Datadog, Inc.:
Intuit Inc. Grades
The following table summarizes notable recent grades from established financial institutions for Intuit Inc.:
| Grading Company | Action | New Grade | Date |
|---|---|---|---|
| Wells Fargo | Downgrade | Equal Weight | 2026-01-08 |
| Wells Fargo | Maintain | Overweight | 2025-11-21 |
| RBC Capital | Maintain | Outperform | 2025-11-21 |
| BMO Capital | Maintain | Outperform | 2025-11-21 |
| Evercore ISI Group | Maintain | Outperform | 2025-11-18 |
| RBC Capital | Maintain | Outperform | 2025-09-02 |
| RBC Capital | Maintain | Outperform | 2025-08-22 |
| UBS | Maintain | Neutral | 2025-08-22 |
| Morgan Stanley | Maintain | Overweight | 2025-08-22 |
| Barclays | Maintain | Overweight | 2025-08-22 |
Intuit’s grades mostly maintain an Outperform or Overweight stance, with a recent slight downgrade from Wells Fargo to Equal Weight.
Datadog, Inc. Grades
The following table shows recent grades for Datadog, Inc. from recognized grading companies:
| Grading Company | Action | New Grade | Date |
|---|---|---|---|
| Barclays | Maintain | Overweight | 2026-01-12 |
| Keybanc | Maintain | Overweight | 2026-01-12 |
| Morgan Stanley | Upgrade | Overweight | 2026-01-12 |
| Truist Securities | Maintain | Hold | 2026-01-07 |
| RBC Capital | Maintain | Outperform | 2026-01-05 |
| Jefferies | Maintain | Buy | 2026-01-05 |
| Piper Sandler | Maintain | Overweight | 2026-01-05 |
| Citigroup | Maintain | Buy | 2025-11-12 |
| Truist Securities | Maintain | Hold | 2025-11-07 |
| DA Davidson | Maintain | Buy | 2025-11-07 |
Datadog’s grades show consistent Overweight and Buy ratings, with Morgan Stanley recently upgrading its rating to Overweight.
Which company has the best grades?
Both companies have a consensus “Buy” rating from analysts, but Datadog exhibits a stronger recent upgrade momentum and more Buy/Overweight ratings. Intuit maintains strong Outperform and Overweight grades but faced a slight downgrade. These patterns may influence investor confidence differently.
Strengths and Weaknesses
Below is a comparison table highlighting the key strengths and weaknesses of Intuit Inc. (INTU) and Datadog, Inc. (DDOG) based on the latest financial and operational data.
| Criterion | Intuit Inc. (INTU) | Datadog, Inc. (DDOG) |
|---|---|---|
| Diversification | Highly diversified with Consumer, Credit Karma, Global Business, and Professional Tax segments generating multi-billion revenues | Focused primarily on cloud monitoring and analytics; less diversified product portfolio |
| Profitability | Strong profitability with net margin 20.55%, ROIC 14.78%, and positive value creation (ROIC > WACC) | Lower profitability; net margin 6.85%, ROIC 1.07%, currently shedding value (ROIC < WACC) |
| Innovation | Steady innovation in financial software and tax solutions; moderate ROIC decline suggests some pressure | Rapidly growing ROIC (224% increase) indicating accelerating innovation despite current value destruction |
| Global presence | Established global business solutions with significant North American dominance | Growing global footprint in cloud services but still emerging internationally |
| Market Share | Leading market share in consumer and business financial software segments | Strong position in cloud monitoring but niche compared to Intuit’s broad market |
Key takeaways: Intuit demonstrates strong profitability and diversified revenue streams, making it a relatively stable investment despite a slight decline in return on capital. Datadog shows promising growth and innovation but currently lacks profitability and a broad market presence, indicating higher risk for investors.
Risk Analysis
Below is a comparative table of key risk factors for Intuit Inc. and Datadog, Inc. based on the most recent data available in 2026:
| Metric | Intuit Inc. (INTU) | Datadog, Inc. (DDOG) |
|---|---|---|
| Market Risk | Beta 1.254, moderate | Beta 1.263, moderate |
| Debt level | Low (D/E 0.34) | Moderate (D/E 0.68) |
| Regulatory Risk | Moderate, financial software regulations | Moderate, cloud and data regulations |
| Operational Risk | Low, diversified segments | Medium, reliance on SaaS uptime and innovation |
| Environmental Risk | Low, minimal impact | Low, SaaS focused |
| Geopolitical Risk | Moderate, US-centric | Moderate, global cloud exposure |
Intuit demonstrates lower debt and stronger operational stability, but faces regulatory scrutiny typical of financial software providers. Datadog’s higher debt and operational dependency on cloud infrastructure increase its risk profile. Market and geopolitical risks are similar for both due to their US base and global reach. Investors should weigh Intuit’s stable cash flow against Datadog’s growth potential with caution on valuation metrics.
Which Stock to Choose?
Intuit Inc. shows a favorable income evolution with 15.63% revenue growth in 2025 and strong profitability indicated by a 20.55% net margin. Financial ratios reveal 57.14% favorable metrics, low debt levels, and a very favorable rating of B. The company creates value with ROIC exceeding WACC but with a slightly declining profitability trend.
Datadog, Inc. displays robust revenue growth of 26.12% in 2024 and improving profitability with a 6.85% net margin. However, its financial ratios are slightly unfavorable overall (42.86% unfavorable), reflecting moderate debt and mixed returns. The firm is shedding value despite increasing ROIC, with a slightly unfavorable moat and a very favorable C+ rating.
Investors prioritizing stable value creation and strong profitability may find Intuit’s profile more aligned with conservative or quality investing strategies. Conversely, those focused on growth and appreciating rising profitability trends might view Datadog’s improving metrics as indicative of potential upside, albeit with higher risk.
Disclaimer: Investment carries a risk of loss of initial capital. The past performance is not a reliable indicator of future results. Be sure to understand risks before making an investment decision.
Go Further
I encourage you to read the complete analyses of Intuit Inc. and Datadog, Inc. to enhance your investment decisions: