In the dynamic world of software applications, Datadog, Inc. and Figma, Inc. stand out as innovative leaders shaping the future of technology. Datadog excels in cloud monitoring and analytics, while Figma revolutionizes collaborative design tools. Both companies target technology professionals and emphasize cutting-edge solutions, making their comparison essential for investors seeking growth and innovation. Join me as we explore which of these promising firms deserves a place in your investment portfolio.
Table of contents
Companies Overview
I will begin the comparison between Datadog and Figma by providing an overview of these two companies and their main differences.
Datadog Overview
Datadog, Inc. offers a cloud-based monitoring and analytics platform designed for developers, IT operations, and business users globally. Its SaaS platform integrates infrastructure monitoring, application performance, log management, and security monitoring to deliver real-time observability. Headquartered in New York, Datadog serves a wide range of customers with features like incident management and collaboration tools, positioning itself as a comprehensive cloud monitoring solution.
Figma Overview
Figma, Inc. develops a browser-based collaborative design tool aimed at helping design and development teams create user interfaces and prototypes. Its offerings include design, prototyping, Dev Mode for code translation, and AI-driven tools for product development. Based in San Francisco, Figma focuses on streamlining product design workflows with a suite of integrated tools that foster team collaboration and creativity within a single platform.
Key similarities and differences
Both Datadog and Figma operate in the software application industry with SaaS models targeting professional users. Datadog focuses on IT infrastructure and application monitoring, while Figma specializes in collaborative design and prototyping tools. Datadog’s market cap stands at $41.7B with 6,500 employees, contrasting Figma’s $14.4B valuation and 1,646 employees, reflecting differences in scale and market focus within technology services.
Income Statement Comparison
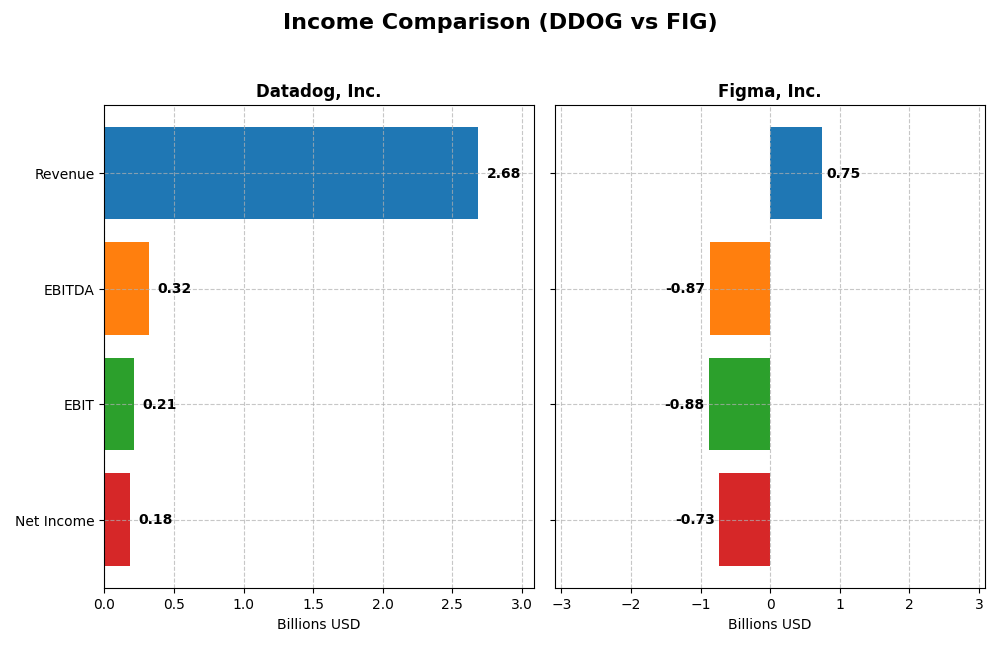
The table below presents a side-by-side comparison of key income statement metrics for Datadog, Inc. and Figma, Inc. for the fiscal year 2024.
| Metric | Datadog, Inc. (DDOG) | Figma, Inc. (FIG) |
|---|---|---|
| Market Cap | 41.7B | 14.4B |
| Revenue | 2.68B | 749M |
| EBITDA | 318M | -870M |
| EBIT | 211M | -877M |
| Net Income | 184M | -732M |
| EPS | 0.55 | -3.11 |
| Fiscal Year | 2024 | 2024 |
Income Statement Interpretations
Datadog, Inc.
Datadog’s revenue exhibited strong growth from 2020 to 2024, rising from $603M to $2.68B, with net income turning positive after losses in earlier years. Gross margins remained robust around 80.76%, while net margin improved significantly to 6.85% in 2024. The latest year showed accelerated revenue growth of 26.12% and a near tripling of net income, reflecting improved operational efficiency.
Figma, Inc.
Figma’s revenue grew rapidly from $505M in 2023 to $749M in 2024, a 48.36% increase, but it continued to report substantial net losses, with net income at -$732M in 2024. Gross margin was high at 88.32%, but EBIT and net margins were deeply negative, indicating ongoing heavy losses. Operating expenses grew faster than revenue, causing deteriorated profitability metrics over the last year.
Which one has the stronger fundamentals?
Datadog shows stronger fundamentals with consistent revenue and net income growth, positive margins, and a favorable overall income statement evaluation of 92.86% favorable. In contrast, Figma’s income statement is marked by large losses, unfavorable EBIT and net margin trends, and a predominantly unfavorable evaluation at 64.29%, pointing to weaker profitability despite solid revenue growth.
Financial Ratios Comparison
This table presents a side-by-side comparison of key financial ratios for Datadog, Inc. and Figma, Inc. based on the latest fiscal year data available for 2024.
| Ratios | Datadog, Inc. (DDOG) | Figma, Inc. (FIG) |
|---|---|---|
| ROE | 6.77% | -55.29% |
| ROIC | 1.07% | -59.68% |
| P/E | 261.42 | -70.71 |
| P/B | 17.70 | 39.10 |
| Current Ratio | 2.64 | 3.66 |
| Quick Ratio | 2.64 | 3.66 |
| D/E (Debt-to-Equity) | 0.68 | 0.02 |
| Debt-to-Assets | 31.84% | 1.60% |
| Interest Coverage | 7.68 | 0 |
| Asset Turnover | 0.46 | 0.42 |
| Fixed Asset Turnover | 6.72 | 17.09 |
| Payout Ratio | 0 | 0 |
| Dividend Yield | 0 | 0 |
Interpretation of the Ratios
Datadog, Inc.
Datadog shows a mixed ratio profile with favorable liquidity and interest coverage but weak profitability and valuation metrics. Key concerns include low returns on equity and invested capital, and a high price-to-earnings ratio indicating potential overvaluation. The company does not pay dividends, likely focusing on growth and reinvestment strategies, supported by a stable balance sheet.
Figma, Inc.
Figma’s ratios reveal significant profitability challenges, with negative margins and returns on equity and invested capital. However, it benefits from low leverage and a strong quick ratio, reflecting liquidity strength. The absence of dividends aligns with its high-growth phase and reinvestment focus, prioritizing development over shareholder payouts amid operational losses.
Which one has the best ratios?
Datadog presents a slightly unfavorable overall ratio profile but outperforms Figma in profitability and valuation metrics. Figma’s unfavorable global ratios and negative profitability indicate higher financial risk. Therefore, Datadog’s ratios are comparatively stronger, despite some concerns on returns and valuation.
Strategic Positioning
This section compares the strategic positioning of Datadog and Figma, including Market position, Key segments, and disruption:
Datadog, Inc.
- Leading cloud monitoring platform under competitive pressure in software application industry.
- Focuses on SaaS monitoring, analytics for IT, developers, security, and network performance.
- Operates in cloud infrastructure and security monitoring, with moderate exposure to tech disruption.
Figma, Inc.
- Emerging design collaboration software with high volatility indicated by negative beta.
- Browser-based UI design, prototyping, and AI tools targeting design and development teams.
- Concentrated on innovative design collaboration tools, likely facing significant tech disruption.
Datadog vs Figma Positioning
Datadog pursues a diversified SaaS monitoring platform serving multiple IT functions, while Figma concentrates on collaborative design software. Datadog’s broader scope contrasts with Figma’s niche focus, reflecting different strategic risk and growth profiles based on available data.
Which has the best competitive advantage?
Datadog shows a slightly unfavorable moat with growing profitability, whereas Figma has a very unfavorable moat with declining returns, indicating Datadog currently has a more sustainable competitive advantage.
Stock Comparison
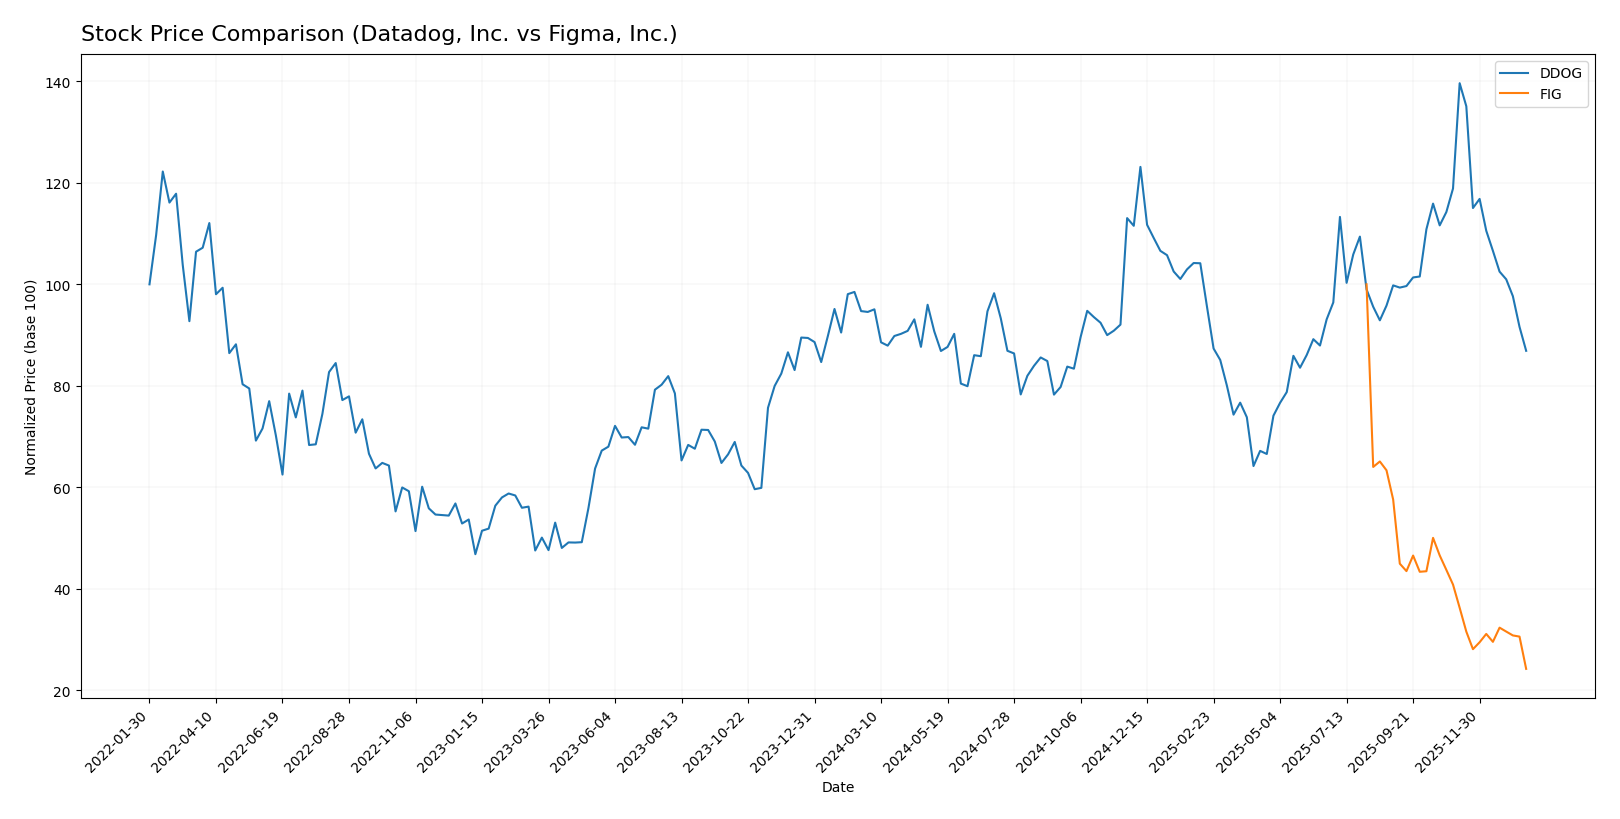
The stock prices of Datadog, Inc. (DDOG) and Figma, Inc. (FIG) have exhibited significant bearish trends over the past 12 months, with notable price declines and contrasting volume dynamics shaping their trading patterns.
Trend Analysis
Datadog, Inc. (DDOG) experienced a bearish trend over the past year, with an 8.1% price decline and decelerating downward momentum. Price volatility remains high, with a standard deviation of 18.63, reaching lows near 87.93.
Figma, Inc. (FIG) showed a sharper bearish trend, dropping 75.76% over the same period with accelerating losses. Despite a slightly lower volatility of 19.95, the stock hit a low of 29.57, reflecting sustained selling pressure.
Comparatively, DDOG outperformed FIG over the last 12 months, delivering a less severe decline and more stable price movement, indicating relatively better market resilience.
Target Prices
Analysts present a clear target price consensus for Datadog, Inc. and Figma, Inc., reflecting cautious optimism.
| Company | Target High | Target Low | Consensus |
|---|---|---|---|
| Datadog, Inc. | 215 | 105 | 177.67 |
| Figma, Inc. | 52 | 38 | 43.6 |
The consensus target prices for both companies are significantly above their current stock prices, indicating expected growth potential. Datadog’s target consensus at 177.67 far exceeds its 119.02 current price, while Figma’s consensus of 43.6 is well above its 29.57 trading level.
Analyst Opinions Comparison
This section compares analysts’ ratings and scores for Datadog, Inc. and Figma, Inc.:
Rating Comparison
Datadog, Inc. Rating
- Rating: C+, classified as Very Favorable by analysts.
- Discounted Cash Flow Score: 4, indicating a Favorable DCF.
- ROE Score: 2, a Moderate efficiency in generating profit.
- ROA Score: 3, Moderate asset utilization effectiveness.
- Debt To Equity Score: 2, Moderate financial risk level.
- Overall Score: 2, Moderate overall financial standing.
Figma, Inc. Rating
- Rating: C+, also classified as Very Favorable.
- Discounted Cash Flow Score: 4, also Favorable.
- ROE Score: 1, considered Very Unfavorable for profit efficiency.
- ROA Score: 1, Very Unfavorable asset utilization.
- Debt To Equity Score: 4, Favorable low financial risk.
- Overall Score: 2, also Moderate overall standing.
Which one is the best rated?
Both Datadog and Figma share the same overall rating and discounted cash flow score, but Datadog shows stronger profitability metrics (ROE and ROA), whereas Figma has a better debt-to-equity score indicating lower financial risk. Overall, their ratings are comparable with differences in specific financial strengths.
Scores Comparison
Here is a comparison of the Altman Z-Score and Piotroski Score for Datadog, Inc. and Figma, Inc.:
DDOG Scores
- Altman Z-Score: 11.37, indicating a safe zone.
- Piotroski Score: 6, classified as average.
FIG Scores
- Altman Z-Score: 14.34, indicating a safe zone.
- Piotroski Score: 4, classified as average.
Which company has the best scores?
Both Datadog and Figma are in the safe zone for Altman Z-Score, but Figma has a higher Z-Score. Datadog has a better Piotroski Score than Figma, with both rated as average overall.
Grades Comparison
Here is the grades comparison for Datadog, Inc. and Figma, Inc.:
Datadog, Inc. Grades
This table summarizes recent grades assigned to Datadog by leading financial institutions.
| Grading Company | Action | New Grade | Date |
|---|---|---|---|
| Barclays | Maintain | Overweight | 2026-01-12 |
| Keybanc | Maintain | Overweight | 2026-01-12 |
| Morgan Stanley | Upgrade | Overweight | 2026-01-12 |
| Truist Securities | Maintain | Hold | 2026-01-07 |
| RBC Capital | Maintain | Outperform | 2026-01-05 |
| Jefferies | Maintain | Buy | 2026-01-05 |
| Piper Sandler | Maintain | Overweight | 2026-01-05 |
| Citigroup | Maintain | Buy | 2025-11-12 |
| Truist Securities | Maintain | Hold | 2025-11-07 |
| DA Davidson | Maintain | Buy | 2025-11-07 |
Datadog’s grades show a strong buying consensus with multiple overweight and buy ratings, highlighting positive sentiment.
Figma, Inc. Grades
The following table details recent grades for Figma from recognized grading firms.
| Grading Company | Action | New Grade | Date |
|---|---|---|---|
| Morgan Stanley | Maintain | Equal Weight | 2026-01-15 |
| Wells Fargo | Upgrade | Overweight | 2026-01-08 |
| RBC Capital | Maintain | Sector Perform | 2026-01-05 |
| Goldman Sachs | Maintain | Neutral | 2025-11-07 |
| JP Morgan | Maintain | Neutral | 2025-11-06 |
| Piper Sandler | Maintain | Overweight | 2025-11-06 |
| Wells Fargo | Maintain | Equal Weight | 2025-11-05 |
| Wells Fargo | Maintain | Equal Weight | 2025-09-04 |
| Morgan Stanley | Maintain | Equal Weight | 2025-09-04 |
| RBC Capital | Maintain | Sector Perform | 2025-09-04 |
Figma’s grades mostly reflect a neutral to moderate positive outlook, with several equal weight and sector perform ratings.
Which company has the best grades?
Datadog has received significantly stronger grades, predominantly buy and overweight ratings, compared to Figma’s hold and equal weight consensus. This may indicate higher analyst confidence in Datadog’s growth potential, which investors could interpret as a more favorable risk-reward profile.
Strengths and Weaknesses
The table below summarizes key strengths and weaknesses of Datadog, Inc. (DDOG) and Figma, Inc. (FIG) based on the most recent financial and operational data.
| Criterion | Datadog, Inc. (DDOG) | Figma, Inc. (FIG) |
|---|---|---|
| Diversification | Moderate product/service diversification | Limited diversification, focused on design collaboration software |
| Profitability | Neutral net margin (6.85%), low ROIC (1.07%) | Negative net margin (-97.74%), negative ROIC (-59.68%) |
| Innovation | Growing ROIC trend suggests improving efficiency | Declining ROIC indicates challenges in innovation returns |
| Global presence | Strong with scalable cloud-based platform | Emerging global presence, still expanding |
| Market Share | Significant in cloud monitoring space | Growing in design software market but smaller share |
Key takeaways: Datadog shows improving profitability with a growing ROIC trend, though value creation remains slightly unfavorable. Figma faces significant profitability challenges and declining returns, indicating higher risk. Investors should weigh Datadog’s improving fundamentals against Figma’s current struggles.
Risk Analysis
Below is a comparative overview of key risks for Datadog, Inc. (DDOG) and Figma, Inc. (FIG) based on the most recent data from 2024.
| Metric | Datadog, Inc. (DDOG) | Figma, Inc. (FIG) |
|---|---|---|
| Market Risk | Moderate (Beta 1.26, volatile SaaS sector) | High (Beta -3.80, extreme volatility) |
| Debt level | Moderate (Debt-to-Equity 0.68, Neutral) | Low (Debt-to-Equity 0.02, Favorable) |
| Regulatory Risk | Moderate (Technology sector scrutiny) | Moderate (US-based software, evolving policies) |
| Operational Risk | Moderate (Scale and integration complexity) | High (Early-stage growth, negative margins) |
| Environmental Risk | Low (Software sector with low direct impact) | Low (Similar sector profile) |
| Geopolitical Risk | Moderate (Global cloud operations) | Moderate (Global collaboration tools) |
Datadog faces moderate market and regulatory risks but maintains a solid debt profile and operational stability. Figma’s risks are amplified by high market volatility and operational challenges due to heavy losses and early growth stage. The most impactful risks are Figma’s operational losses and market volatility, which may affect stock stability. Datadog’s moderate beta and neutral debt levels suggest more balanced risk exposure.
Which Stock to Choose?
Datadog, Inc. (DDOG) shows a favorable income evolution with 26.12% revenue growth and improved profitability. Its financial ratios are slightly unfavorable overall due to high P/E and P/B, but it maintains moderate debt and strong liquidity. The company’s rating is very favorable with a C+ score, and its moat evaluation signals slight value destruction but growing profitability.
Figma, Inc. (FIG) presents an unfavorable income evolution with negative net margin and declining profitability despite strong revenue growth of 48.36%. Financial ratios are mostly unfavorable, though debt levels remain low and liquidity is solid. It shares the same very favorable C+ rating but has a very unfavorable moat status indicating value erosion and decreasing returns.
Considering ratings, income statements, and financial ratios, investors focused on growth might find Datadog’s improving profitability and moderate valuation metrics more appealing, while those prioritizing low leverage and liquidity might see Figma’s profile as fitting. However, both show risks reflected in their profitability and value creation metrics, suggesting it might be prudent to assess individual risk tolerance before considering either.
Disclaimer: Investment carries a risk of loss of initial capital. The past performance is not a reliable indicator of future results. Be sure to understand risks before making an investment decision.
Go Further
I encourage you to read the complete analyses of Datadog, Inc. and Figma, Inc. to enhance your investment decisions: