In today’s rapidly evolving tech landscape, Datadog, Inc. and Domo, Inc. stand out as key players in the software application sector, both offering cloud-based platforms that enhance data visibility and decision-making. While Datadog focuses on comprehensive IT monitoring and security, Domo emphasizes real-time business intelligence across all organizational levels. This article will explore their market positions and innovation strategies to help you identify the more promising investment opportunity.

Table of contents
Companies Overview
I will begin the comparison between Datadog and Domo by providing an overview of these two companies and their main differences.
Datadog Overview
Datadog, Inc. offers a SaaS monitoring and analytics platform designed for developers, IT operations, and business users, with a focus on cloud environments globally. Its platform integrates infrastructure monitoring, application performance, log and security management, enabling real-time observability. Founded in 2010 and headquartered in New York City, Datadog operates in the Software – Application industry with a market cap of 41.7B USD.
Domo Overview
Domo, Inc. operates a cloud-based business intelligence platform that connects all organizational levels with real-time data and insights accessible via smartphones. Serving markets in the US, Japan, and internationally, Domo focuses on enhancing business management through digital connectivity. Incorporated in 2010 and based in American Fork, Utah, Domo is positioned in the Software – Application sector with a market cap of 257M USD.
Key similarities and differences
Both Datadog and Domo operate cloud-based software platforms in the technology sector, focusing on data analytics and business intelligence. Datadog emphasizes real-time technology stack observability and security monitoring, while Domo prioritizes business intelligence and data connectivity across organizational roles. Datadog’s market capitalization and employee base far exceed Domo’s, reflecting differences in scale and market reach.
Income Statement Comparison
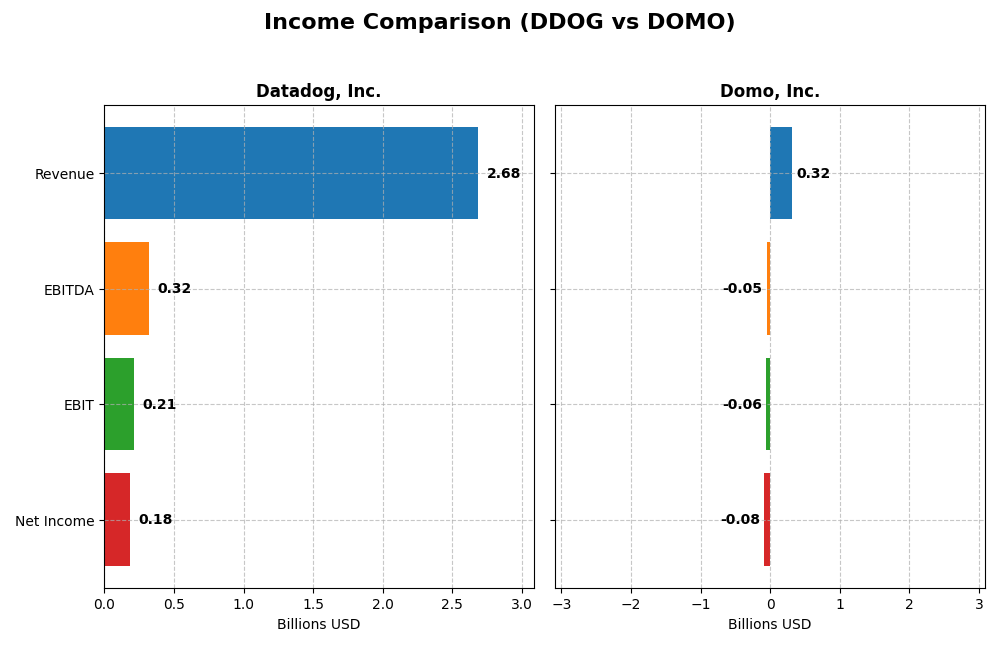
The table below compares key income statement metrics for Datadog, Inc. and Domo, Inc. for their most recent fiscal years, providing a snapshot of their financial performance.
| Metric | Datadog, Inc. (DDOG) | Domo, Inc. (DOMO) |
|---|---|---|
| Market Cap | 41.7B | 257M |
| Revenue | 2.68B (2024) | 317M (2025) |
| EBITDA | 318M (2024) | -50M (2025) |
| EBIT | 211M (2024) | -59M (2025) |
| Net Income | 184M (2024) | -82M (2025) |
| EPS | 0.55 (2024) | -2.13 (2025) |
| Fiscal Year | 2024 | 2025 |
Income Statement Interpretations
Datadog, Inc.
Datadog’s revenue grew substantially over 2020-2024, reaching $2.68B in 2024 with net income turning positive and rising to $184M. Gross margin remained strong around 81%, signaling efficient cost control. The 2024 fiscal year showed favorable revenue growth of 26.1% and a significant net margin improvement, reflecting robust profitability expansion.
Domo, Inc.
Domo’s revenue increased moderately from $210M in 2021 to $317M in 2025, but net income remained negative, widening to a loss of $82M in 2025. Gross margin held favorably at 74%, yet EBIT and net margins stayed deeply negative. In 2025, revenue slightly declined by 0.6%, and profitability metrics deteriorated further, indicating ongoing operational challenges.
Which one has the stronger fundamentals?
Datadog demonstrates stronger fundamentals with consistent revenue and net income growth, high gross margins, and improving profitability margins. Conversely, Domo struggles with persistent losses and negative EBIT and net margins despite moderate revenue growth. Datadog’s favorable overall income statement contrasts with Domo’s unfavorable profitability profile, highlighting a significant fundamental divergence.
Financial Ratios Comparison
The table below presents a side-by-side comparison of key financial ratios for Datadog, Inc. (DDOG) and Domo, Inc. (DOMO) based on the most recent fiscal year data available.
| Ratios | Datadog, Inc. (2024) | Domo, Inc. (2025) |
|---|---|---|
| ROE | 6.77% | 46.23% |
| ROIC | 1.07% | 194.73% |
| P/E | 261.4 | -3.98 |
| P/B | 17.70 | -1.84 |
| Current Ratio | 2.64 | 0.56 |
| Quick Ratio | 2.64 | 0.56 |
| D/E (Debt-to-Equity) | 0.68 | -0.76 |
| Debt-to-Assets | 31.8% | 63.2% |
| Interest Coverage | 7.68 | -2.99 |
| Asset Turnover | 0.46 | 1.48 |
| Fixed Asset Turnover | 6.72 | 8.17 |
| Payout ratio | 0 | 0 |
| Dividend yield | 0 | 0 |
Interpretation of the Ratios
Datadog, Inc.
Datadog shows a mixed ratio profile with favorable liquidity evidenced by strong current and quick ratios at 2.64, but weak profitability indicators like a low ROE of 6.77% and ROIC of 1.07%. Its high P/E of 261.42 and P/B of 17.7 also raise valuation concerns. The company does not pay dividends, likely reflecting reinvestment and growth priorities.
Domo, Inc.
Domo’s ratios are polarized, with strong returns such as a high ROE of 46.23% and ROIC of 194.73%, but poor liquidity shown by a current ratio of 0.56 and negative interest coverage. The negative net margin at -25.84% indicates ongoing losses. Domo also does not pay dividends, consistent with its negative profitability and possible focus on expansion.
Which one has the best ratios?
Datadog’s ratios lean slightly unfavorable due to weak profitability and high valuation metrics, despite solid liquidity. Domo presents a neutral ratio profile with strong returns but significant liquidity and profitability challenges. Neither company exhibits a clearly superior ratio set, reflecting trade-offs between stability and growth risk.
Strategic Positioning
This section compares the strategic positioning of Datadog and Domo, focusing on market position, key segments, and exposure to technological disruption:
Datadog, Inc.
- Market leader in cloud monitoring with strong competitive pressure in SaaS infrastructure monitoring.
- Offers integrated monitoring and analytics platform for developers and IT operations globally.
- Exposure to rapid cloud technology changes requiring continuous innovation in observability tools.
Domo, Inc.
- Smaller market cap, competing in cloud-based business intelligence with moderate competitive pressure.
- Focuses on subscription-based business intelligence platform with professional services in the U.S. and Japan.
- Faces disruption risks in cloud BI but benefits from mobile management and real-time data access.
Datadog, Inc. vs Domo, Inc. Positioning
Datadog pursues a diversified platform integrating multiple monitoring functions with a large global footprint, while Domo concentrates on business intelligence and mobile data management, relying heavily on subscription revenues and professional services.
Which has the best competitive advantage?
Domo demonstrates a very favorable moat with ROIC well above WACC and growing profitability, indicating a durable competitive advantage. Datadog shows slightly unfavorable moat status with value destruction despite improving ROIC trends.
Stock Comparison
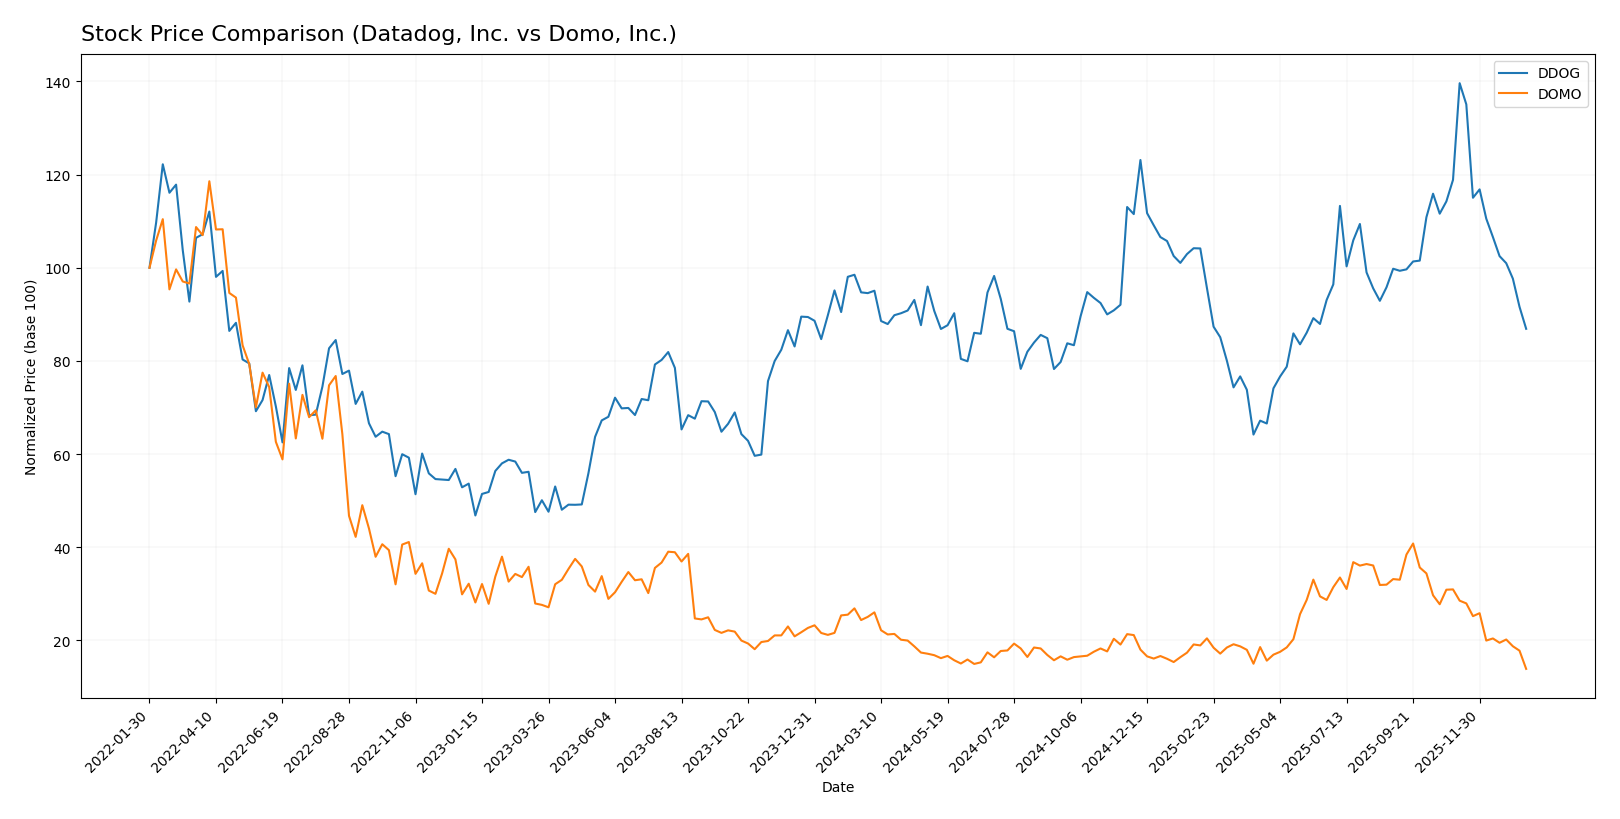
Over the past 12 months, both Datadog, Inc. and Domo, Inc. have experienced notable bearish trends, with significant price declines and decelerating momentum, reflecting challenging trading dynamics and increased seller dominance.
Trend Analysis
Datadog, Inc. (DDOG) shows a bearish trend with an 8.1% price decline over the past year, accompanied by a deceleration in trend and high volatility indicated by a standard deviation of 18.63. The stock hit a high of 191.24 and a low of 87.93.
Domo, Inc. (DOMO) also exhibits a bearish trend with a larger 44.54% price decline over the same period, decelerating trend momentum, and lower volatility at 3.01 standard deviation. Its price ranged between 18.06 and 6.15.
Comparing the two, Datadog has delivered a higher market performance than Domo over the past year, as its smaller percentage decline indicates relatively less negative price movement.
Target Prices
Analysts present a clear target price consensus for Datadog, Inc. and Domo, Inc., reflecting varied expectations in the software application sector.
| Company | Target High | Target Low | Consensus |
|---|---|---|---|
| Datadog, Inc. | 215 | 105 | 177.67 |
| Domo, Inc. | 13 | 10 | 11.5 |
Datadog’s consensus target price of 177.67 USD is significantly above its current price of 119.02 USD, indicating potential upside. In contrast, Domo’s consensus target of 11.5 USD also suggests room for growth relative to its current price of 6.15 USD.
Analyst Opinions Comparison
This section compares analysts’ ratings and grades for Datadog, Inc. and Domo, Inc.:
Rating Comparison
Datadog Rating
- Rating: C+, considered very favorable overall.
- Discounted Cash Flow Score: 4, indicating a favorable valuation based on cash flow.
- ROE Score: 2, moderate efficiency in generating profit from equity.
- ROA Score: 3, moderate effectiveness in asset utilization.
- Debt To Equity Score: 2, moderate financial risk.
- Overall Score: 2, moderate overall financial standing.
Domo Rating
- Rating: C, considered very favorable overall.
- Discounted Cash Flow Score: 1, very unfavorable valuation based on cash flow.
- ROE Score: 5, very favorable efficiency in generating profit from equity.
- ROA Score: 1, very unfavorable effectiveness in asset utilization.
- Debt To Equity Score: 1, very unfavorable financial risk.
- Overall Score: 2, moderate overall financial standing.
Which one is the best rated?
Based strictly on the provided data, Datadog holds a better discounted cash flow and debt-to-equity profile, while Domo excels in return on equity but scores poorly on asset use and financial risk. Overall, both share a moderate overall score of 2.
Scores Comparison
Here is a comparison of the Altman Z-Score and Piotroski Score for Datadog, Inc. and Domo, Inc.:
DDOG Scores
- Altman Z-Score of 11.37, indicating a safe financial zone.
- Piotroski Score of 6, reflecting an average financial strength.
DOMO Scores
- Altman Z-Score of -10.10, showing financial distress.
- Piotroski Score of 3, indicating very weak financial health.
Which company has the best scores?
Datadog displays a significantly higher Altman Z-Score in the safe zone and a stronger Piotroski Score compared to Domo, which is in financial distress with very weak Piotroski results. Based on scores alone, Datadog shows better financial stability.
Grades Comparison
Here is a detailed comparison of the latest grades assigned to Datadog, Inc. and Domo, Inc.:
Datadog, Inc. Grades
The following table summarizes the recent grades awarded to Datadog, Inc. by reputable grading companies.
| Grading Company | Action | New Grade | Date |
|---|---|---|---|
| Citigroup | Maintain | Buy | 2026-01-16 |
| Morgan Stanley | Upgrade | Overweight | 2026-01-12 |
| Barclays | Maintain | Overweight | 2026-01-12 |
| Keybanc | Maintain | Overweight | 2026-01-12 |
| Truist Securities | Maintain | Hold | 2026-01-07 |
| Jefferies | Maintain | Buy | 2026-01-05 |
| RBC Capital | Maintain | Outperform | 2026-01-05 |
| Piper Sandler | Maintain | Overweight | 2026-01-05 |
| Citigroup | Maintain | Buy | 2025-11-12 |
| Morgan Stanley | Maintain | Equal Weight | 2025-11-07 |
Datadog’s ratings predominantly reflect a positive outlook, with multiple “Buy” and “Overweight” grades and no recent downgrades.
Domo, Inc. Grades
The following table reflects the most recent grades assigned to Domo, Inc. by recognized grading firms.
| Grading Company | Action | New Grade | Date |
|---|---|---|---|
| DA Davidson | Maintain | Neutral | 2025-12-05 |
| TD Cowen | Maintain | Buy | 2025-12-05 |
| Lake Street | Maintain | Hold | 2025-12-05 |
| DA Davidson | Maintain | Neutral | 2025-12-01 |
| JMP Securities | Maintain | Market Outperform | 2025-09-10 |
| DA Davidson | Maintain | Neutral | 2025-08-28 |
| Cantor Fitzgerald | Maintain | Overweight | 2025-08-28 |
| TD Cowen | Upgrade | Buy | 2025-08-26 |
| JMP Securities | Maintain | Market Outperform | 2025-06-25 |
| Cantor Fitzgerald | Maintain | Overweight | 2025-06-25 |
Domo’s grades show a mixed but generally positive stance, with “Buy” and “Market Outperform” ratings balanced by several “Neutral” and “Hold” grades.
Which company has the best grades?
Datadog, Inc. holds stronger and more consistent high-grade ratings, mainly “Buy” and “Overweight,” compared to Domo, Inc.’s mixed profile with some “Neutral” ratings. This difference suggests that investors might perceive Datadog as having a more favorable near-term outlook.
Strengths and Weaknesses
The following table summarizes the key strengths and weaknesses of Datadog, Inc. (DDOG) and Domo, Inc. (DOMO) based on their diversification, profitability, innovation, global presence, and market share as of 2026.
| Criterion | Datadog, Inc. (DDOG) | Domo, Inc. (DOMO) |
|---|---|---|
| Diversification | Moderate focus, primarily cloud monitoring services | Strong subscription base, with professional services complementing growth |
| Profitability | Slightly unfavorable profitability; ROIC 1.07%, net margin 6.85% | Strong value creation; ROIC 194.73%, but negative net margin -25.84% |
| Innovation | Growing ROIC trend indicates improving innovation | Very favorable ROIC trend shows durable competitive advantage |
| Global presence | Established global footprint but less diversified geographically | Expanding presence, focused on subscription services worldwide |
| Market Share | Significant market share in cloud monitoring | Growing market share in business intelligence and analytics |
Key takeaways: Datadog shows improving profitability but still struggles to create value above its cost of capital, indicating cautious optimism. Domo demonstrates strong value creation and innovation but faces challenges in profitability and liquidity, requiring careful risk management.
Risk Analysis
Below is a comparative risk table for Datadog, Inc. (DDOG) and Domo, Inc. (DOMO) based on the most recent financial and operational data.
| Metric | Datadog, Inc. (DDOG) | Domo, Inc. (DOMO) |
|---|---|---|
| Market Risk | Beta 1.26 – moderate volatility | Beta 1.65 – higher volatility |
| Debt level | Debt-to-Equity 0.68 (neutral) | Debt-to-Equity negative but Debt-to-Assets 63.23% (unfavorable) |
| Regulatory Risk | Moderate (US-based SaaS, low regulatory burden) | Moderate (US-based SaaS, low regulatory burden) |
| Operational Risk | Moderate – large workforce (6.5K), stable platform | Higher – smaller scale (888 employees), profitability challenges |
| Environmental Risk | Low – Software industry, limited direct impact | Low – Software industry, limited direct impact |
| Geopolitical Risk | Moderate – International exposure but diversified | Moderate – International exposure but smaller scale |
The most impactful risks are Datadog’s high valuation metrics and moderate operational scale, while Domo faces significant financial distress signals with negative Altman Z-score and weak liquidity ratios, heightening bankruptcy risk. Investors should monitor Domo’s high debt burden and low current ratio closely.
Which Stock to Choose?
Datadog, Inc. (DDOG) shows strong income growth with a 344.81% revenue increase over 2020-2024 and favorable profitability metrics, including an 80.76% gross margin and 6.85% net margin. Financial ratios reveal a slightly unfavorable overall status due to high valuation multiples, but liquidity and interest coverage are solid. Its debt level is moderate, and the rating is very favorable (C+). The company’s MOAT evaluation is slightly unfavorable as it currently destroys value, though ROIC is improving.
Domo, Inc. (DOMO) presents mixed financials with a smaller 50.84% revenue growth over 2021-2025 but unfavorable earnings and net margins. Ratios are split evenly between favorable and unfavorable, with concerns on liquidity and debt levels. Despite a very favorable rating (C), Domo’s Altman Z-Score indicates financial distress and a very weak Piotroski score. Its MOAT evaluation is very favorable, reflecting strong value creation and growing profitability.
For investors prioritizing growth and stability, Datadog’s robust income evolution and liquidity might appear more attractive, despite its slightly unfavorable valuation and value destruction signal. Conversely, those focusing on companies demonstrating strong economic moats and value creation, even amid distress signals, might find Domo worth analyzing further given its favorable MOAT and rating. Ultimately, the choice could depend on an investor’s risk tolerance and investment strategy.
Disclaimer: Investment carries a risk of loss of initial capital. The past performance is not a reliable indicator of future results. Be sure to understand risks before making an investment decision.
Go Further
I encourage you to read the complete analyses of Datadog, Inc. and Domo, Inc. to enhance your investment decisions: