Home > Comparison > Consumer Cyclical > YUM vs DRI
The strategic rivalry between Yum! Brands, Inc. and Darden Restaurants, Inc. shapes the dynamics of the global restaurant industry. Yum! Brands operates a vast portfolio of quick-service franchises worldwide, emphasizing scalability and brand diversity. In contrast, Darden focuses on full-service dining with a premium experience across multiple casual dining concepts. This analysis will assess which operational model delivers superior risk-adjusted returns for a diversified portfolio amid evolving consumer trends.

Table of contents
Companies Overview
Yum! Brands and Darden Restaurants dominate distinct niches in the restaurant industry, shaping consumer dining experiences globally.
Yum! Brands, Inc.: Global Quick-Service Powerhouse
Yum! Brands leads in quick-service restaurants with a vast international footprint. Its core revenue streams come from franchising KFC, Pizza Hut, Taco Bell, and Habit Burger Grill outlets. In 2026, the company focuses on expanding its global presence and innovating menu offerings to capture fast-growing markets and evolving consumer tastes.
Darden Restaurants, Inc.: Full-Service Dining Specialist
Darden Restaurants excels in full-service dining across the US and Canada. It generates revenue by owning and operating brands like Olive Garden and LongHorn Steakhouse. The strategic focus remains on enhancing customer experience and optimizing operations across its 1,867 restaurants to strengthen brand loyalty and sustain domestic growth.
Strategic Collision: Similarities & Divergences
Yum! Brands pursues a franchise-driven, global quick-service model, while Darden emphasizes corporate-owned, full-service dining in North America. Their competition centers on capturing consumer discretionary spending but in vastly different segments. Yum! offers scalability and international reach; Darden delivers operational control and premium dining experiences, reflecting distinct risk and return profiles for investors.
Income Statement Comparison
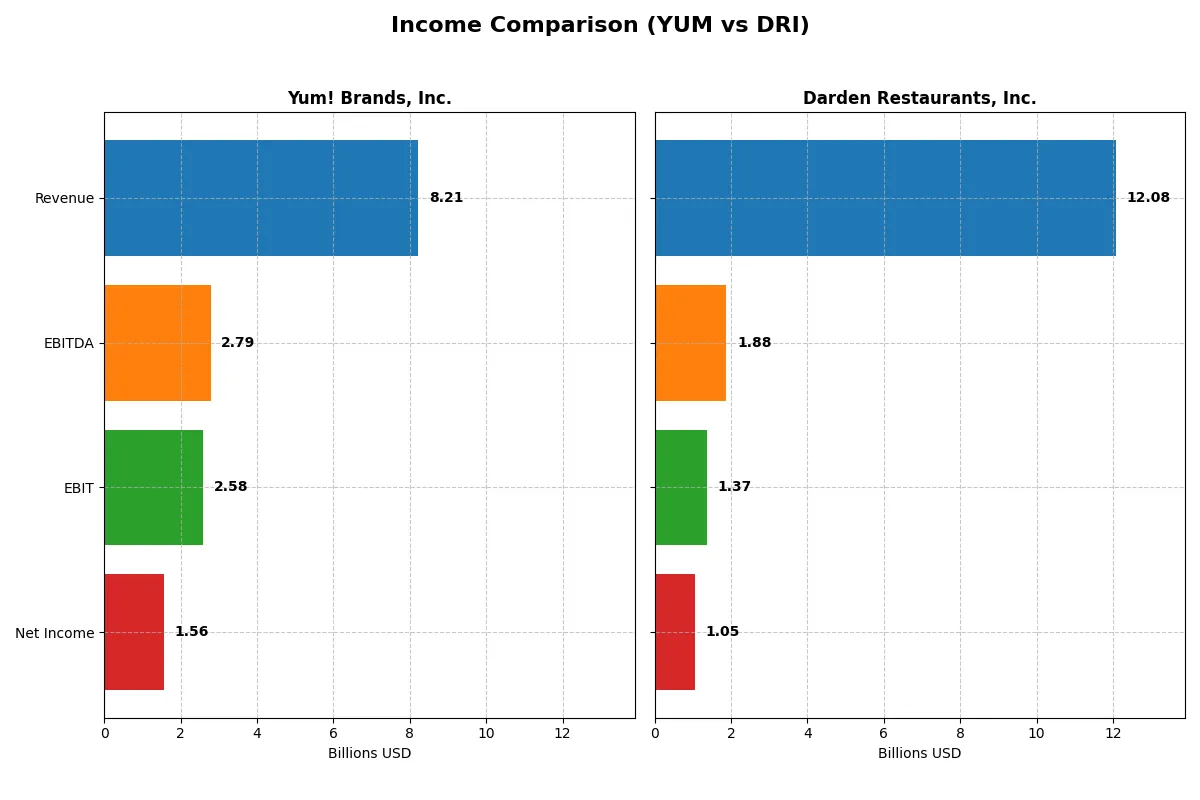
This data dissects the core profitability and scalability of both corporate engines to reveal who dominates the bottom line:
| Metric | Yum! Brands, Inc. (YUM) | Darden Restaurants, Inc. (DRI) |
|---|---|---|
| Revenue | 8.2B | 12.1B |
| Cost of Revenue | 4.4B | 9.4B |
| Operating Expenses | 1.3B | 1.3B |
| Gross Profit | 3.8B | 2.6B |
| EBITDA | 2.8B | 1.9B |
| EBIT | 2.6B | 1.4B |
| Interest Expense | 500M | 180M |
| Net Income | 1.6B | 1.0B |
| EPS | 5.59 | 8.93 |
| Fiscal Year | 2025 | 2025 |
Income Statement Analysis: The Bottom-Line Duel
This income statement comparison reveals which company runs a more efficient and profitable corporate engine through recent financial performance.
Yum! Brands, Inc. Analysis
Yum! Brands’ revenue climbed steadily from 6.6B in 2021 to 8.2B in 2025, reflecting solid top-line momentum. Gross margins remain robust near 46%, while net margins hover around 19%, signaling efficient cost control. In 2025, net income reached 1.56B despite a slight net margin dip, showing resilience and strong operational leverage.
Darden Restaurants, Inc. Analysis
Darden’s revenue surged from 7.2B in 2021 to 12.1B in 2025, showcasing impressive scale growth. Gross margin is lower at about 22%, and net margin trails at 8.7%, indicating thinner profitability. However, net income more than doubled over five years, hitting 1.05B in 2025, supported by disciplined interest expense and moderate margin expansion.
Margin Strength vs. Revenue Growth Scale
Yum! Brands leads in margin quality with nearly double the net margin of Darden, delivering superior profit efficiency. Meanwhile, Darden outpaces in revenue and net income growth, supported by rapid expansion. Yum!’s profile suits investors valuing strong profitability; Darden appeals to those prioritizing growth and scale.
Financial Ratios Comparison
These vital ratios act as a diagnostic tool to expose the underlying fiscal health, valuation premiums, and capital efficiency of these companies:
| Ratios | Yum! Brands, Inc. (YUM) | Darden Restaurants, Inc. (DRI) |
|---|---|---|
| ROE | -21.3% | 45.4% |
| ROIC | 28.3% | 11.4% |
| P/E | 27.0 | 22.8 |
| P/B | -5.74 | 10.37 |
| Current Ratio | 1.35 | 0.42 |
| Quick Ratio | 1.35 | 0.28 |
| D/E | -1.63 | 2.70 |
| Debt-to-Assets | 145.3% | 49.5% |
| Interest Coverage | 5.06 | 7.55 |
| Asset Turnover | 1.00 | 0.96 |
| Fixed Asset Turnover | 5.12 | 1.46 |
| Payout ratio | 50.6% | 62.7% |
| Dividend yield | 1.88% | 2.75% |
| Fiscal Year | 2025 | 2025 |
Efficiency & Valuation Duel: The Vital Signs
Ratios act as a company’s DNA, revealing hidden risks and operational excellence that define its true financial health.
Yum! Brands, Inc.
Yum! shows a favorable net margin of 19% and strong ROIC at 28%, but a negative ROE signals shareholder equity struggles. Its P/E ratio near 27 suggests the stock is expensive relative to earnings. A modest 1.9% dividend yield indicates stable shareholder returns amid reinvestment in operations and debt management.
Darden Restaurants, Inc.
Darden delivers an impressive 45% ROE, reflecting efficient equity use, yet a lower 8.7% net margin signals moderate profitability. The P/E of 23 positions the stock as reasonably valued, while a higher 2.75% dividend yield rewards investors directly. However, weak liquidity ratios and elevated debt levels raise caution on financial stability.
Premium Valuation vs. Operational Safety
Yum! commands a premium valuation supported by strong operational returns but suffers from negative equity returns. Darden offers superior ROE and dividends but carries liquidity concerns. Yum! suits investors prioritizing growth and operational efficiency; Darden fits those favoring income with moderate risk exposure.
Which one offers the Superior Shareholder Reward?
I see Yum! Brands (YUM) offers a modest dividend yield near 1.9%, with a payout ratio around 50%, well-covered by stable free cash flow of 7.2/share. Yum balances dividends with moderate buybacks, sustaining growth through reinvestment. Darden Restaurants (DRI) pays a higher yield near 3%, but with a payout ratio exceeding 60%, pressured by higher capex of 5.7/share. Darden’s buyback pace is lighter. Historically, Yum’s balanced payout and buyback mix deliver more sustainable total returns. I conclude Yum provides the superior shareholder reward in 2026, blending yield, growth, and free cash flow reliability better than Darden.
Comparative Score Analysis: The Strategic Profile
The radar chart reveals the fundamental DNA and trade-offs of Yum! Brands and Darden Restaurants, highlighting their core financial strengths and vulnerabilities:
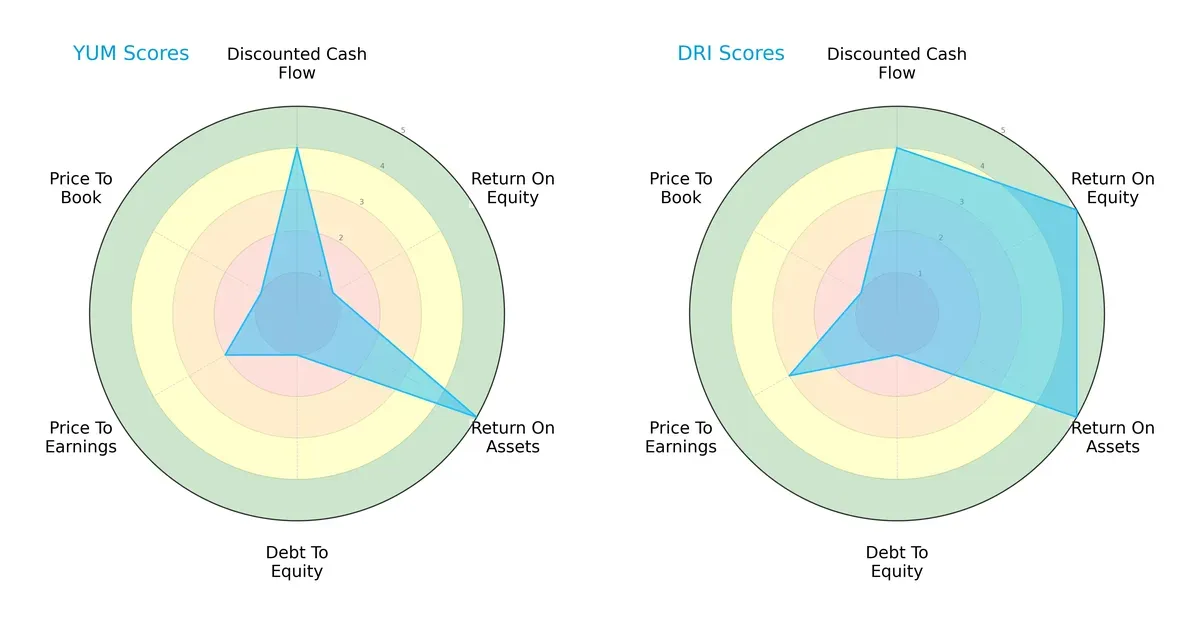
Darden leads with a more balanced profile, excelling in return on equity and assets, signaling operational efficiency and profitability. Yum! Brands, however, depends heavily on asset utilization but struggles with equity returns and carries higher financial risk, reflected in weak debt and valuation scores. Darden’s moderate overall score contrasts Yum!’s unfavorable rating, indicating sturdier fundamentals in a volatile cycle.
Bankruptcy Risk: Solvency Showdown
The Altman Z-Scores place both firms in the grey zone, indicating moderate bankruptcy risk in this economic phase:
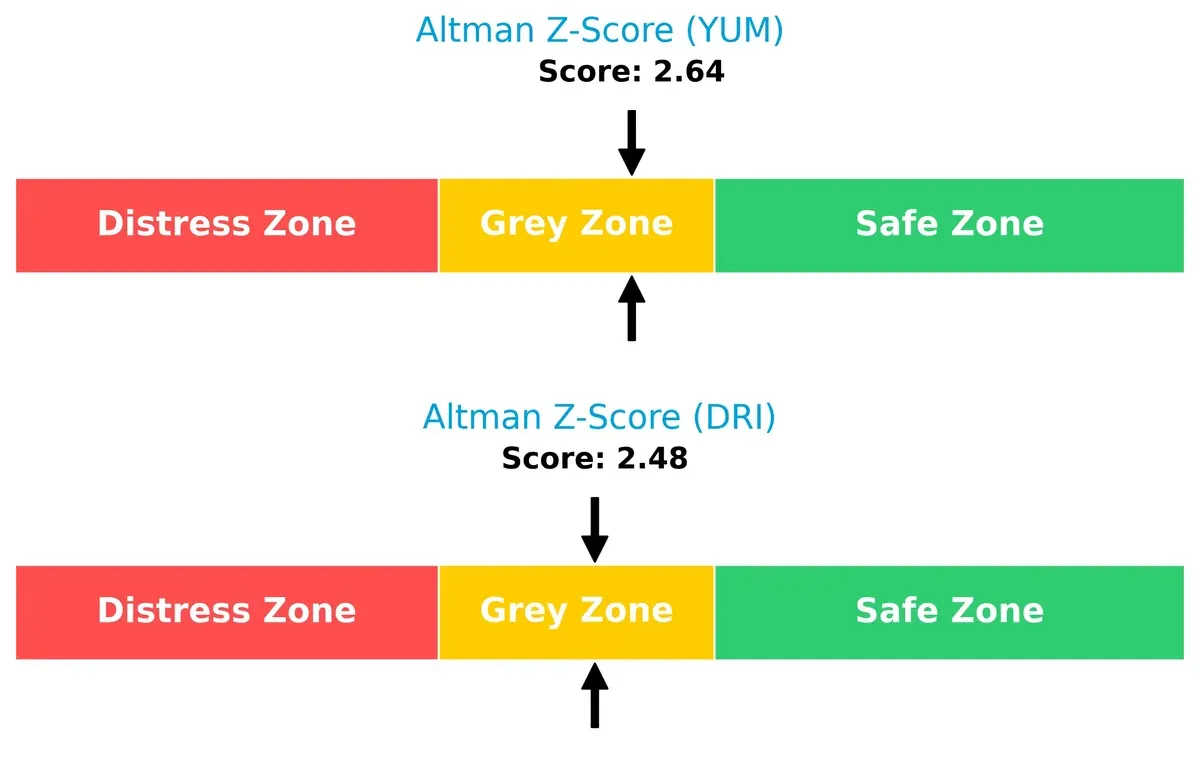
Yum! Brands scores 2.64, slightly above Darden’s 2.48, suggesting marginally better solvency. Both companies face cautionary signals, demanding vigilant risk management to navigate potential liquidity stress.
Financial Health: Quality of Operations
Darden’s Piotroski F-Score of 7 outperforms Yum!’s 6, reflecting stronger internal financial metrics and operational health:
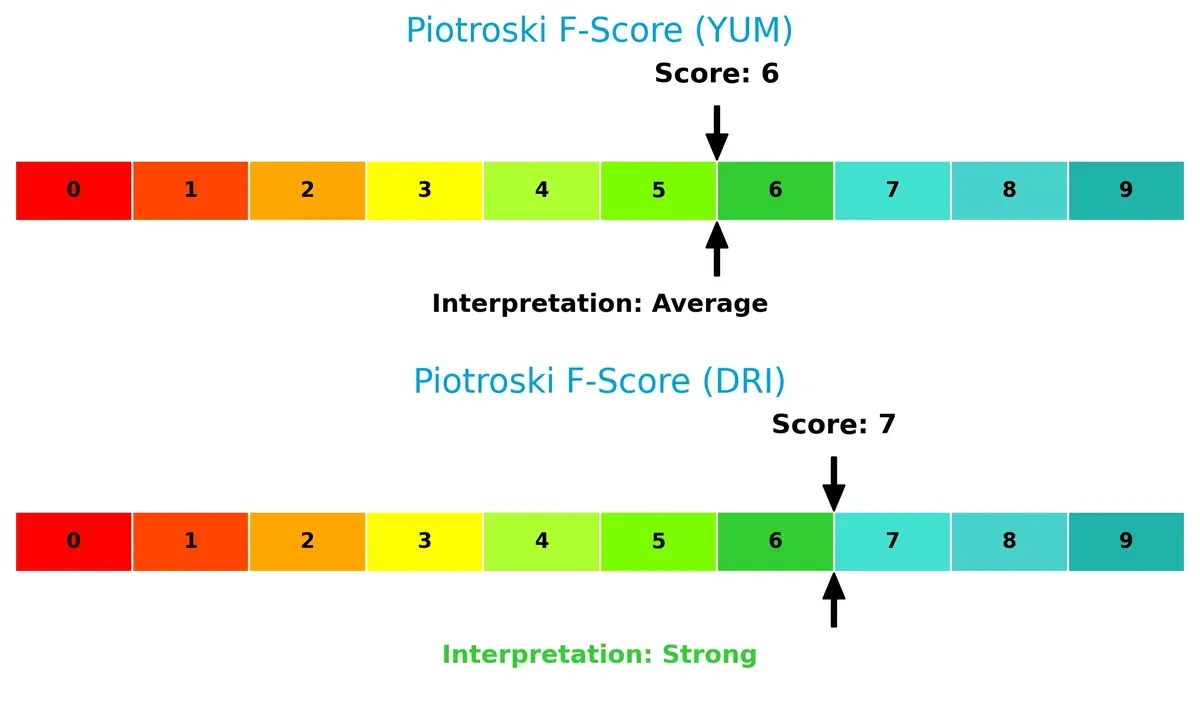
Darden’s higher score signals robust profitability and efficient capital use, while Yum!’s average score hints at some internal weaknesses. Investors should note Yum!’s relative red flags in operational quality compared to its peer.
How are the two companies positioned?
This section dissects the operational DNA of Yum and Darden by comparing their revenue distribution by segment and internal dynamics. The goal is to confront their economic moats and identify which model offers the most resilient competitive advantage today.
Revenue Segmentation: The Strategic Mix
This comparison dissects how Yum! Brands and Darden Restaurants diversify their income streams and where their primary sector bets lie:
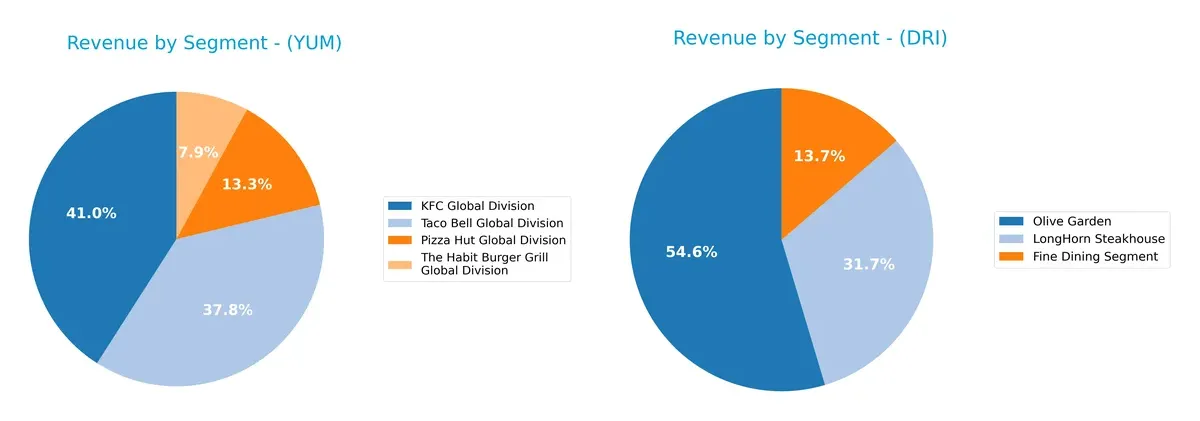
Yum! Brands anchors revenue in KFC at $3.1B and Taco Bell at $2.9B, with notable contributions from Pizza Hut and Habit Burger. Darden Restaurants pivots heavily on Olive Garden’s $5.1B and LongHorn Steakhouse’s $3.0B, plus a smaller Fine Dining segment at $1.3B. Yum! shows a balanced multi-brand approach, reducing concentration risk. Darden leans on Olive Garden’s scale, posing potential dependency but benefiting from infrastructure dominance.
Strengths and Weaknesses Comparison
This table compares the strengths and weaknesses of Yum! Brands and Darden Restaurants based on diversification, profitability, financials, innovation, global presence, and market share:
YUM Strengths
- Diverse brand portfolio with KFC, Taco Bell, Pizza Hut, and Habit Burger Grill
- High net margin at 18.98%
- Strong ROIC of 28.26% well above WACC at 6.16%
- Favorable quick ratio and interest coverage
- Efficient fixed asset turnover at 5.12
DRI Strengths
- Robust ROE of 45.41% and favorable ROIC at 11.4%
- Solid interest coverage ratio at 7.57
- Strong market presence with Olive Garden and LongHorn Steakhouse
- Favorable dividend yield at 2.75%
- Moderate P/E ratio at 22.84
YUM Weaknesses
- Negative ROE at -21.28% despite strong ROIC
- Elevated debt-to-assets ratio at 145.3% signals high leverage risk
- Unfavorable P/E ratio near 27
- Negative price-to-book ratio
- Neutral current ratio at 1.35 limits liquidity flexibility
DRI Weaknesses
- Weak liquidity with current ratio at 0.42 and quick ratio at 0.28
- High debt-to-equity at 2.7 flags financial risk
- Neutral net margin at 8.69% below Yum!
- Unfavorable price-to-book ratio at 10.37
- Asset turnover ratios only neutral
Overall, Yum! Brands excels in operational efficiency and brand diversification but carries significant leverage and profitability concerns. Darden shows stronger equity returns and liquidity challenges, suggesting different strategic priorities in capital structure and market focus.
The Moat Duel: Analyzing Competitive Defensibility
A structural moat shields long-term profits from relentless competitive pressures. It is the only true defense against margin erosion and market share loss:
Yum! Brands, Inc.: Franchise Power and Brand Portfolio
Yum! leverages strong intangible assets and global franchise scale, reflected in a high ROIC well above WACC. However, its declining ROIC trend in 2026 signals rising margin pressure and intensifying competition.
Darden Restaurants, Inc.: Operational Excellence and Customer Loyalty
Darden’s moat stems from superior operational efficiency and brand loyalty in full-service dining, sustaining steady ROIC growth. Unlike Yum!, its improving profitability in 2026 suggests deepening competitive advantages.
Franchise Scale vs. Operational Strength: Who Defends Better?
Yum! commands a wider moat through global franchise reach but faces shrinking profitability. Darden’s narrower yet deepening moat via operational gains equips it better to defend market share long term.
Which stock offers better returns?
Over the past 12 months, both stocks show strong upward momentum with notable price gains and accelerating trends, reflecting increased investor interest and trading activity.
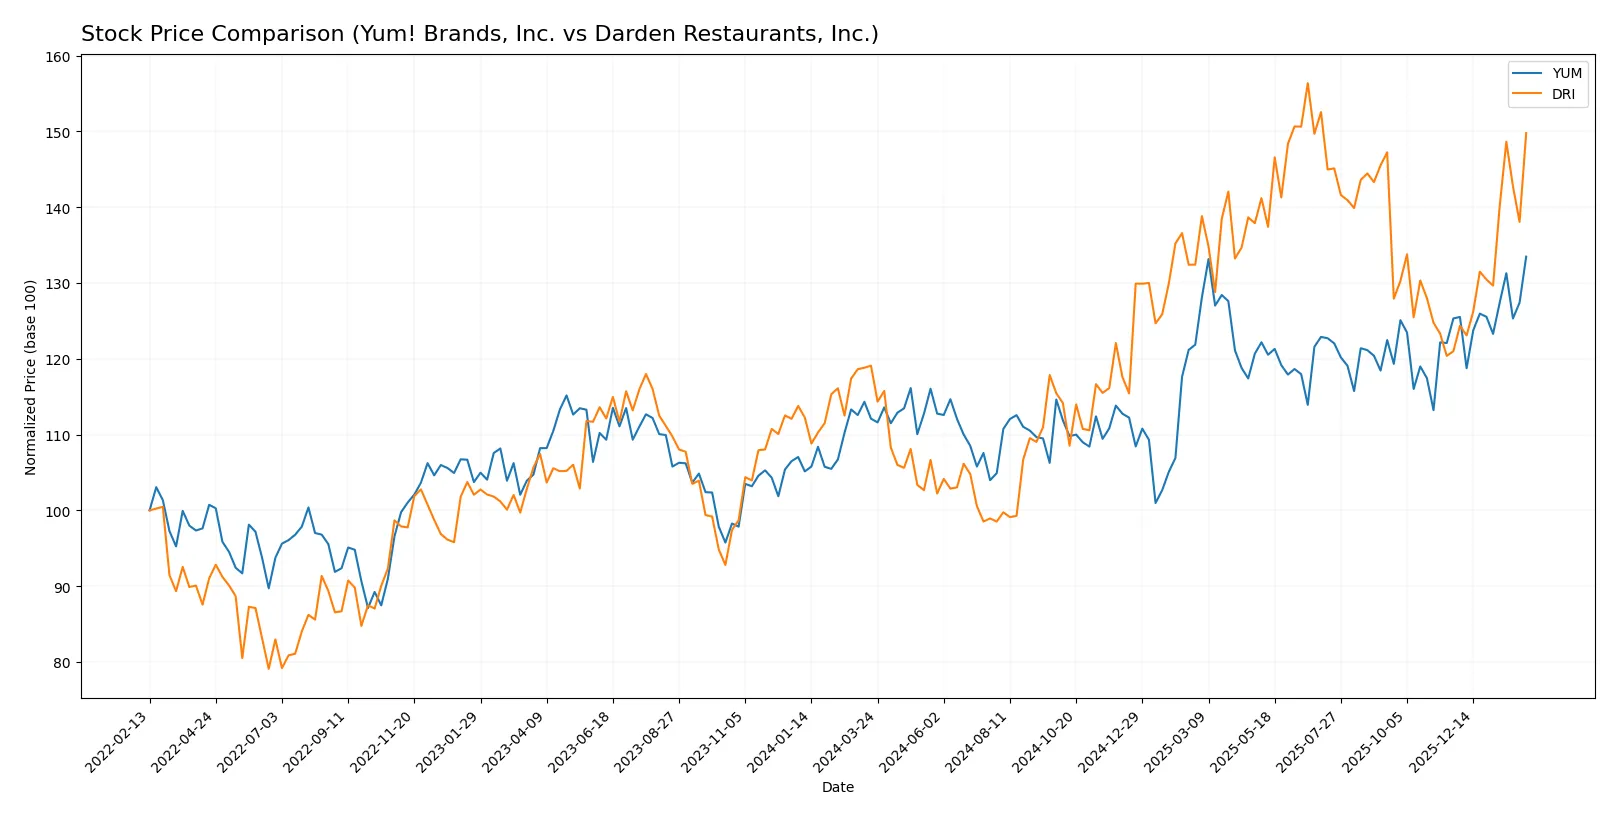
Trend Comparison
Yum! Brands, Inc. (YUM) posted a 19.07% price gain over the past year with accelerating bullish momentum and moderate volatility (8.64 std deviation). The stock ranged between 123.25 and 162.93.
Darden Restaurants, Inc. (DRI) outperformed YUM with a 25.77% price increase and accelerating bullish trend. It exhibited higher volatility (23.04 std deviation) and a wider price range from 142.27 to 225.78.
DRI delivered stronger market performance than YUM, supported by a steeper recent trend slope and higher returns despite greater price volatility.
Target Prices
Analysts show a bullish consensus for Yum! Brands and Darden Restaurants, reflecting confidence in their growth prospects.
| Company | Target Low | Target High | Consensus |
|---|---|---|---|
| Yum! Brands, Inc. | 158 | 185 | 170.85 |
| Darden Restaurants, Inc. | 200 | 265 | 221.94 |
The target consensus for Yum! Brands sits slightly above its current price of $163, signaling moderate upside. Darden’s consensus target price exceeds its current $216, suggesting stronger growth expectations.

Don’t Let Luck Decide Your Entry Point
Optimize your entry points with our advanced ProRealTime indicators. You’ll get efficient buy signals with precise price targets for maximum performance. Start outperforming now!
How do institutions grade them?
Yum! Brands, Inc. Grades
The following table summarizes recent institution grade actions for Yum! Brands, Inc.:
| Grading Company | Action | New Grade | Date |
|---|---|---|---|
| TD Cowen | Maintain | Buy | 2026-02-05 |
| Wells Fargo | Maintain | Equal Weight | 2026-02-05 |
| Citigroup | Maintain | Neutral | 2026-02-05 |
| Citigroup | Maintain | Neutral | 2026-01-22 |
| Morgan Stanley | Maintain | Equal Weight | 2026-01-20 |
| Gordon Haskett | Upgrade | Buy | 2026-01-08 |
| Barclays | Maintain | Overweight | 2026-01-07 |
| Oppenheimer | Downgrade | Perform | 2026-01-07 |
| TD Cowen | Upgrade | Buy | 2025-11-17 |
| Evercore ISI Group | Upgrade | Outperform | 2025-11-05 |
Darden Restaurants, Inc. Grades
The following table summarizes recent institution grade actions for Darden Restaurants, Inc.:
| Grading Company | Action | New Grade | Date |
|---|---|---|---|
| Mizuho | Upgrade | Outperform | 2026-01-23 |
| Raymond James | Downgrade | Market Perform | 2026-01-21 |
| Truist Securities | Downgrade | Hold | 2026-01-08 |
| Barclays | Maintain | Overweight | 2026-01-07 |
| BMO Capital | Maintain | Market Perform | 2026-01-06 |
| Mizuho | Maintain | Neutral | 2025-12-22 |
| BTIG | Maintain | Buy | 2025-12-19 |
| Stephens & Co. | Maintain | Equal Weight | 2025-12-19 |
| Guggenheim | Maintain | Buy | 2025-12-17 |
| Jefferies | Maintain | Hold | 2025-12-15 |
Which company has the best grades?
Yum! Brands holds a stronger average rating with multiple Buy and Outperform grades, while Darden shows more mixed opinions with several downgrades. Investors may interpret Yum!’s more consistent positive grades as a sign of stronger institutional confidence.
Risks specific to each company
The following categories identify the critical pressure points and systemic threats facing both firms in the 2026 market environment:
1. Market & Competition
Yum! Brands, Inc. (YUM)
- Operates globally with diverse brands; faces intense quick service competition.
Darden Restaurants, Inc. (DRI)
- Focuses on full-service US/Canada restaurants; competes in casual dining segment.
2. Capital Structure & Debt
Yum! Brands, Inc. (YUM)
- Debt to assets extremely high at 145%, signaling leverage risk.
Darden Restaurants, Inc. (DRI)
- Moderate debt to assets at 49%, but low liquidity ratios raise concerns.
3. Stock Volatility
Yum! Brands, Inc. (YUM)
- Beta at 0.657 shows moderate market sensitivity; relatively stable.
Darden Restaurants, Inc. (DRI)
- Beta at 0.614 indicates slightly lower volatility than YUM.
4. Regulatory & Legal
Yum! Brands, Inc. (YUM)
- Global footprint increases exposure to diverse regulatory environments.
Darden Restaurants, Inc. (DRI)
- Primarily North American operations limit regulatory complexity but not risk.
5. Supply Chain & Operations
Yum! Brands, Inc. (YUM)
- Extensive international supply chains vulnerable to geopolitical and logistic disruptions.
Darden Restaurants, Inc. (DRI)
- Focus on domestic supply chains reduces complexity but risks remain.
6. ESG & Climate Transition
Yum! Brands, Inc. (YUM)
- Global scale demands aggressive ESG initiatives to meet stakeholder expectations.
Darden Restaurants, Inc. (DRI)
- ESG efforts critical to sustaining brand reputation in competitive market.
7. Geopolitical Exposure
Yum! Brands, Inc. (YUM)
- Significant exposure due to operations in 157 countries; geopolitical instability a key risk.
Darden Restaurants, Inc. (DRI)
- Limited international exposure reduces geopolitical risk substantially.
Which company shows a better risk-adjusted profile?
Yum! Brands faces high leverage and geopolitical risks but benefits from diversification and operational scale. Darden boasts stronger profitability and liquidity but suffers from low current and quick ratios and higher debt-to-equity risk. The most impactful risks are Yum!’s excessive leverage and Darden’s liquidity constraints. Given these factors, Darden shows a better risk-adjusted profile, supported by its strong ROE (45.41%) and Piotroski score of 7 versus Yum!’s weaker financial stability signals.
Final Verdict: Which stock to choose?
Yum! Brands stands out as a cash-generating powerhouse with a robust return on invested capital that well exceeds its cost of capital. Its main point of vigilance lies in a declining profitability trend and a high debt load. Yum! fits an aggressive growth portfolio seeking market leaders with operational efficiency.
Darden Restaurants offers a solid strategic moat through its growing profitability and consistent capital efficiency. It provides a safer profile compared to Yum!, with a more stable return on equity and a strong income quality. Darden suits a GARP (Growth at a Reasonable Price) portfolio aiming for stability alongside growth.
If you prioritize operational excellence and high capital returns, Yum! Brands is the compelling choice due to its superior ROIC and cash flow generation. However, if you seek a balance of growth with greater stability and improving profitability, Darden Restaurants offers better consistency and a durable competitive advantage. Both present analytical scenarios for different investor profiles.
Disclaimer: Investment carries a risk of loss of initial capital. The past performance is not a reliable indicator of future results. Be sure to understand risks before making an investment decision.
Go Further
I encourage you to read the complete analyses of Yum! Brands, Inc. and Darden Restaurants, Inc. to enhance your investment decisions: