Home > Comparison > Consumer Cyclical > SBUX vs DRI
The strategic rivalry between Starbucks Corporation and Darden Restaurants, Inc. shapes the consumer cyclical sector’s competitive landscape. Starbucks operates as a global specialty coffee roaster and retailer, emphasizing broad international reach and brand licensing. In contrast, Darden focuses on full-service, multi-brand restaurant operations primarily in North America. This analysis pits Starbucks’ growth-driven model against Darden’s value-oriented approach to identify which offers the superior risk-adjusted return for diversified investors.
Table of contents
Companies Overview
Starbucks and Darden Restaurants stand as two pillars of the US restaurant industry, each commanding significant market influence.
Starbucks Corporation: Global Specialty Coffee Leader
Starbucks dominates the specialty coffee market through its vast network of over 33,800 stores worldwide. It generates revenue primarily by selling coffee beverages, packaged coffee, and food items. In 2026, the company continues to emphasize international expansion and brand diversification, leveraging premium offerings under multiple brands to capture evolving consumer tastes.
Darden Restaurants, Inc.: Full-Service Dining Powerhouse
Darden leads the full-service restaurant segment in North America with nearly 1,900 locations across diverse brands like Olive Garden and LongHorn Steakhouse. Its revenue stems from dine-in, takeout, and franchising operations. The firm’s 2026 strategy focuses on enhancing guest experiences and optimizing operations to sustain growth amid competitive pressures.
Strategic Collision: Similarities & Divergences
Starbucks and Darden share a commitment to customer experience but diverge sharply in business models: Starbucks relies on a highly scalable retail footprint, while Darden invests in full-service dining with broad menu variety. Their primary battleground lies in consumer discretionary spending. Starbucks appeals to convenience and premiumization; Darden targets value and dining occasions, shaping distinct investment profiles.
Income Statement Comparison
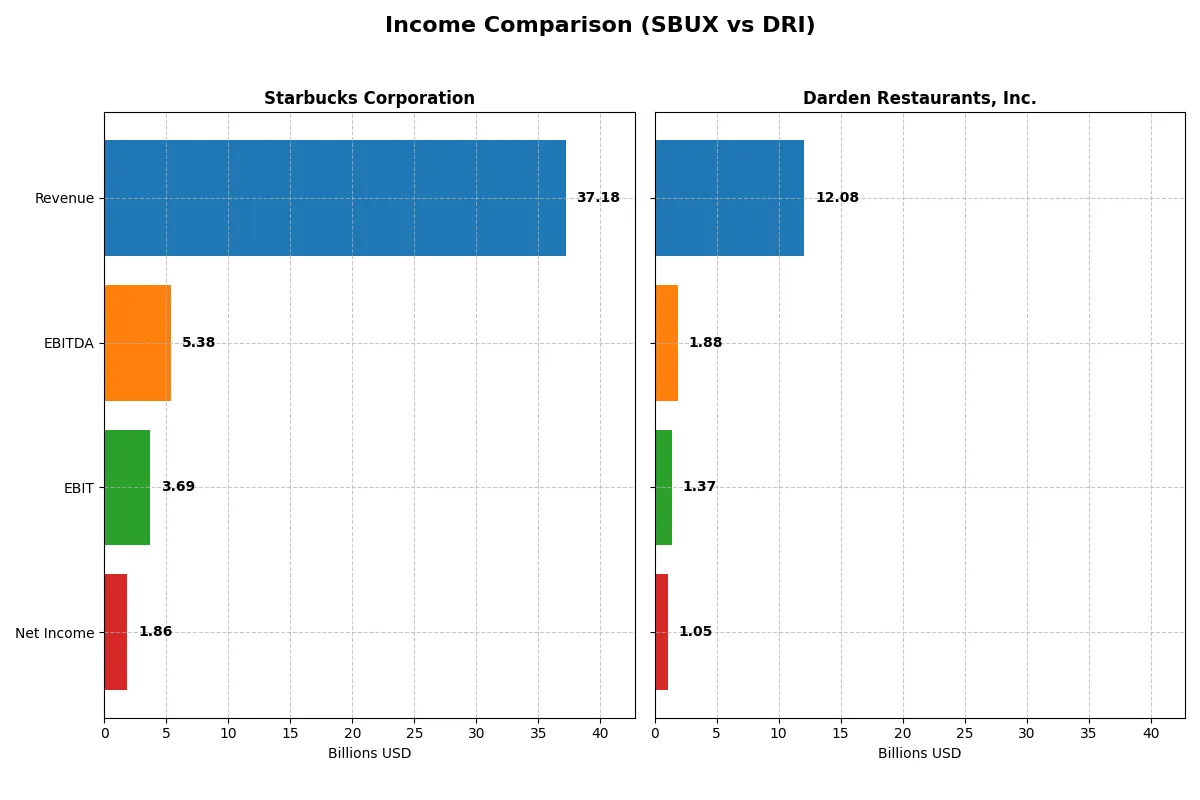
This data dissects the core profitability and scalability of both corporate engines to reveal who dominates the bottom line:
| Metric | Starbucks Corporation (SBUX) | Darden Restaurants, Inc. (DRI) |
|---|---|---|
| Revenue | 37.2B | 12.1B |
| Cost of Revenue | 28.2B | 9.4B |
| Operating Expenses | 5.4B | 1.3B |
| Gross Profit | 9.0B | 2.6B |
| EBITDA | 5.4B | 1.9B |
| EBIT | 3.7B | 1.4B |
| Interest Expense | 543M | 180M |
| Net Income | 1.9B | 1.0B |
| EPS | 1.63 | 8.93 |
| Fiscal Year | 2025 | 2025 |
Income Statement Analysis: The Bottom-Line Duel
This income statement comparison reveals the true efficiency and profitability momentum of Starbucks Corporation and Darden Restaurants, Inc. over recent years.
Starbucks Corporation Analysis
Starbucks shows a revenue growth of 28% from 2021 to 2025 but suffers a 56% net income decline over the same period. Its gross margin remains favorable at 24.15%, yet net margin contracts to 4.99%. The 2025 fiscal year highlights weakening profitability with a 7.5% drop in gross profit and a 52% net margin decline, signaling efficiency challenges.
Darden Restaurants, Inc. Analysis
Darden’s revenue grows 68% from 2021 to 2025, paired with a 67% net income increase, underscoring robust top- and bottom-line momentum. Gross margin holds favorably at 21.88%, with net margin at a strong 8.69%. Despite a slight 3.7% net margin dip last year, Darden’s 2025 results reflect operational strength and consistent profitability improvement.
Margin Resilience vs. Growth Momentum
Darden outperforms Starbucks in both revenue and net income growth, showcasing superior capital allocation and margin expansion. Starbucks’ declining net margins and profits contrast sharply with Darden’s steady gains. For investors prioritizing growth and margin durability, Darden presents a more attractive fundamental profile.
Financial Ratios Comparison
These vital ratios act as a diagnostic tool to expose the underlying fiscal health, valuation premiums, and capital efficiency of the companies compared below:
| Ratios | Starbucks Corporation (SBUX) | Darden Restaurants, Inc. (DRI) |
|---|---|---|
| ROE | -22.9% | 45.4% |
| ROIC | 8.5% | 11.4% |
| P/E | 52.6 | 22.8 |
| P/B | -12.1 | 10.4 |
| Current Ratio | 0.72 | 0.42 |
| Quick Ratio | 0.51 | 0.28 |
| D/E | -3.29 | 2.70 |
| Debt-to-Assets | 83.1% | 49.5% |
| Interest Coverage | 6.6 | 7.6 |
| Asset Turnover | 1.16 | 0.96 |
| Fixed Asset Turnover | 2.09 | 1.46 |
| Payout ratio | 149% | 63% |
| Dividend yield | 2.84% | 2.75% |
| Fiscal Year | 2025 | 2025 |
Efficiency & Valuation Duel: The Vital Signs
Ratios act as a company’s DNA, exposing hidden risks and revealing operational excellence critical for investment decisions.
Starbucks Corporation
Starbucks shows weak profitability with a negative ROE of -23% and a low net margin of 5%, signaling operational challenges. Its P/E of 52.6 marks the stock as expensive relative to earnings. Shareholders benefit from a 2.84% dividend yield, reflecting a preference for steady income over aggressive growth reinvestment.
Darden Restaurants, Inc.
Darden delivers robust profitability with a 45% ROE and an 8.7% net margin, indicating operational strength. Its P/E of 22.8 suggests a fair valuation. The company supports shareholders with a 2.75% dividend yield, balancing income with reinvestment to sustain growth and operational efficiency.
Valuation Discipline Meets Profitability Strength
Darden offers a stronger profitability profile at a more reasonable valuation than Starbucks. Starbucks appears stretched on price with weaker returns. Investors seeking operational resilience might prefer Darden, while those valuing income with growth potential may consider Starbucks’s stable dividend.
Which one offers the Superior Shareholder Reward?
I compare Starbucks (SBUX) and Darden Restaurants (DRI) on dividends, payout ratios, and buybacks. Starbucks yields 2.33–2.84%, with payout ratios near 69%, slightly exceeding free cash flow, risking sustainability. Darden yields 2.75–3.55%, with payout ratios around 61–63%, comfortably covered by free cash flow. Starbucks’ buybacks are modest, while Darden aggressively repurchases shares, enhancing total return. Darden’s disciplined payout and strong buyback program suggest a more sustainable, superior shareholder reward in 2026.
Comparative Score Analysis: The Strategic Profile
The radar chart reveals the fundamental DNA and trade-offs of Starbucks and Darden Restaurants, highlighting their core strengths and weaknesses:
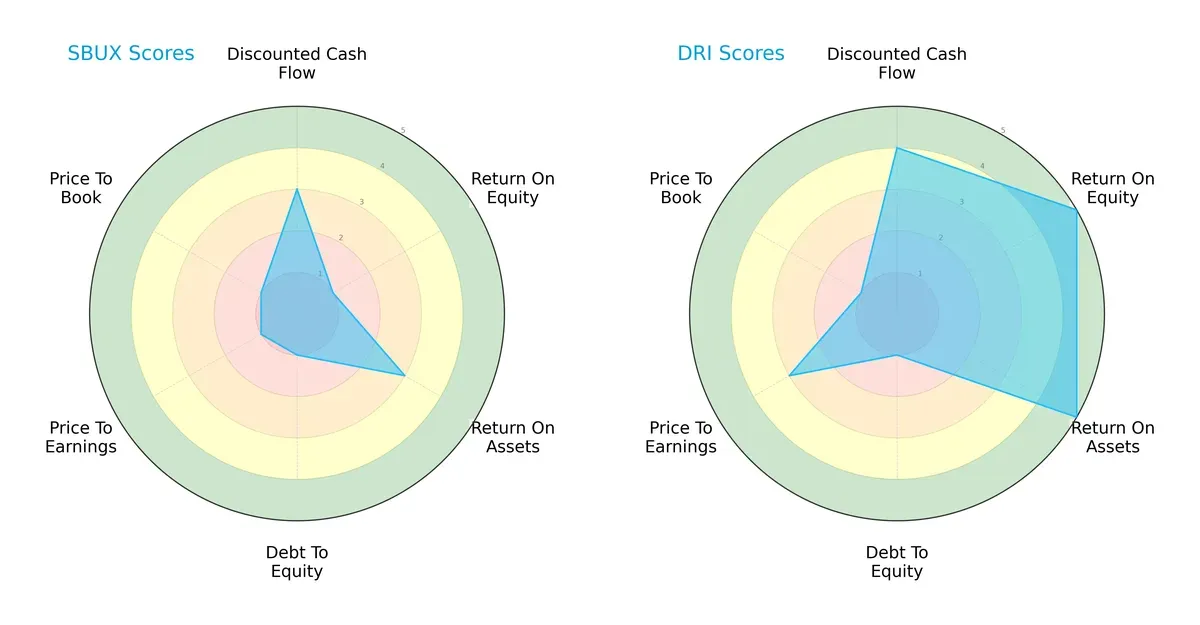
Darden leads with a stronger overall score (3 vs. 2), driven by superior DCF (4 vs. 3), ROE (5 vs. 1), and ROA (5 vs. 3) scores. Starbucks shows vulnerability in profitability and valuation metrics, scoring very low in ROE, Debt/Equity, P/E, and P/B ratios. Darden’s profile is more balanced, leveraging operational efficiency and cash flow strength. Starbucks relies heavily on moderate cash flow but struggles with equity returns and balance sheet leverage, signaling riskier positioning.
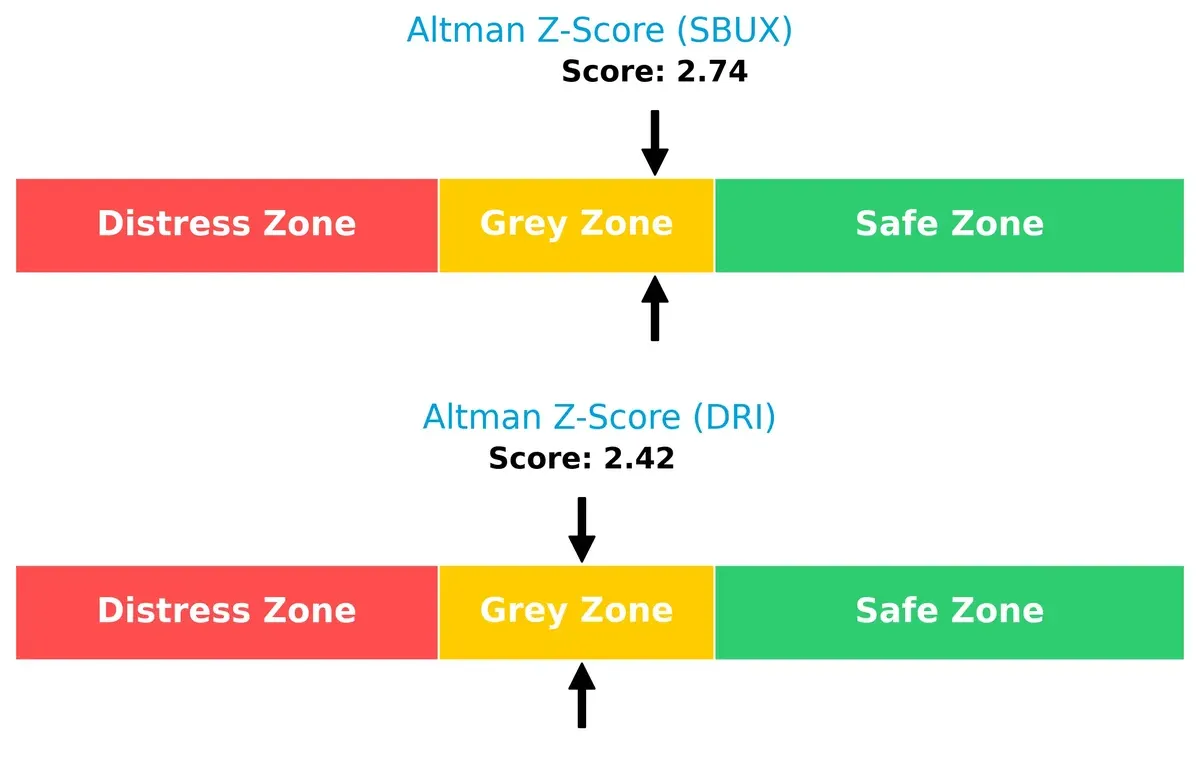
Bankruptcy Risk: Solvency Showdown
Darden’s Altman Z-Score of 2.42 slightly trails Starbucks’ 2.74, positioning both firms in the grey zone. This suggests moderate bankruptcy risk amid current economic cycles, with neither company fully insulated from financial distress:
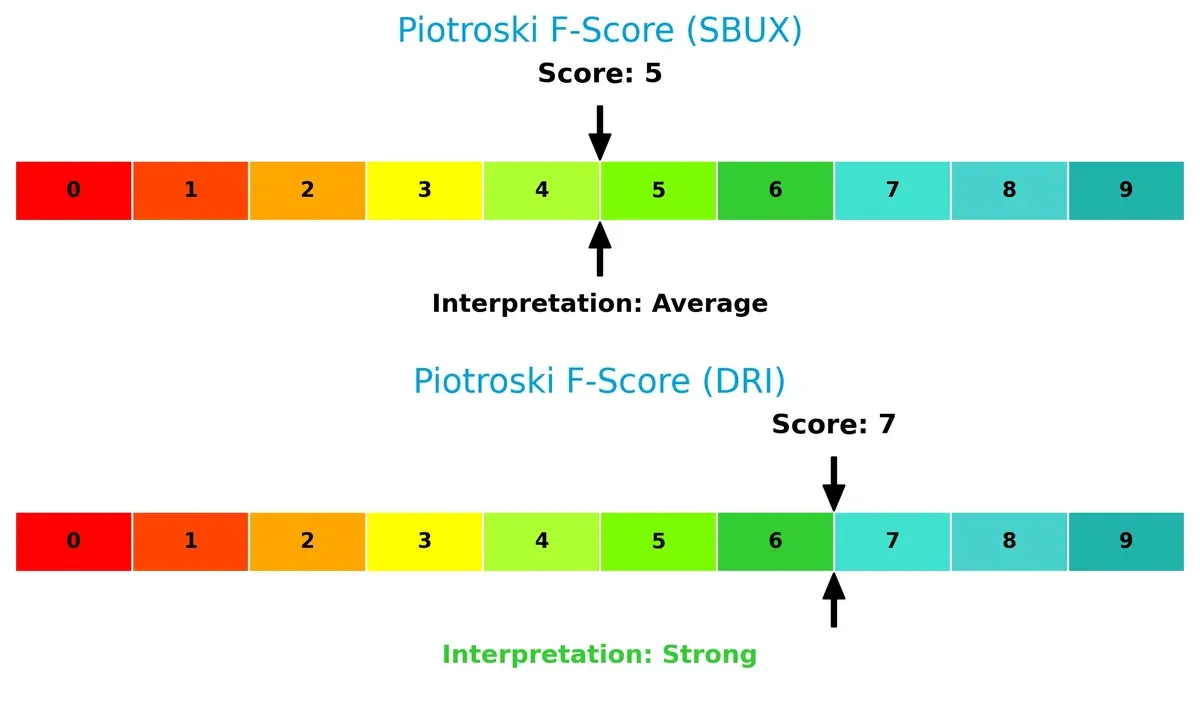
Financial Health: Quality of Operations
Darden’s Piotroski F-Score of 7 indicates strong financial health, outperforming Starbucks’ average score of 5. Starbucks’ lower score flags potential red flags in internal metrics and operational quality compared to Darden’s more robust financial footing:
How are the two companies positioned?
This section dissects the operational DNA of Starbucks and Darden by comparing revenue distribution and internal dynamics. The goal is to confront their economic moats and identify which model offers the most resilient competitive advantage today.
Revenue Segmentation: The Strategic Mix
This visual comparison dissects how Starbucks Corporation and Darden Restaurants, Inc. diversify their income streams and where their primary sector bets lie:
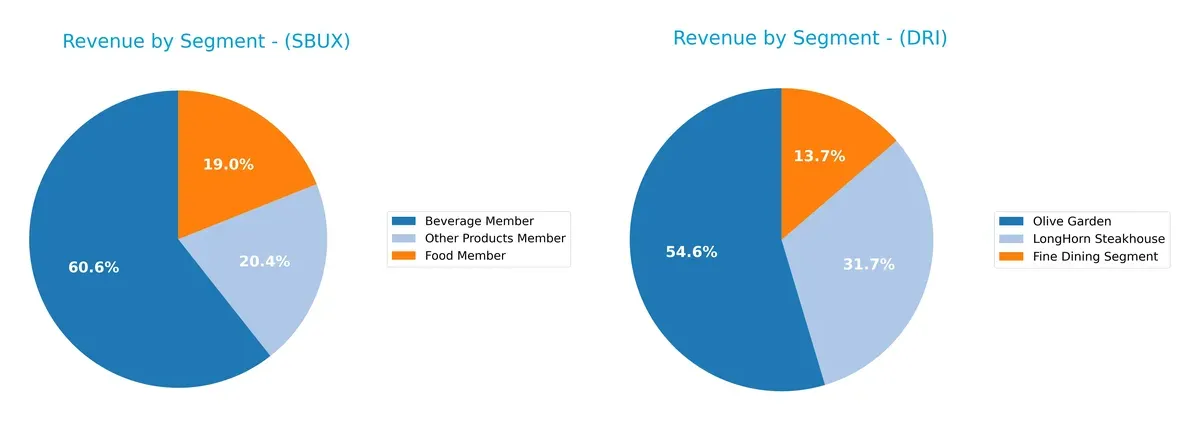
Starbucks anchors its revenue heavily in its Beverage Member segment, generating $22.5B in 2025, dwarfing Food Member at $7B and Other Products Member at $7.6B. This reflects a focused ecosystem lock-in around beverages. In contrast, Darden spreads revenue more evenly across Olive Garden ($5.2B), LongHorn Steakhouse ($3B), and Fine Dining ($1.3B), showing a more diversified portfolio. Starbucks faces concentration risk, while Darden benefits from broad restaurant brand exposure.
Strengths and Weaknesses Comparison
This table compares the Strengths and Weaknesses of Starbucks Corporation and Darden Restaurants, Inc.:
Starbucks Strengths
- Strong beverage segment with $22.5B revenue
- Diverse product mix including food and other products
- Favorable WACC and interest coverage ratios
- Solid asset turnover indicating operational efficiency
- Global presence with significant US and international sales
Darden Strengths
- High net margin and ROE reflecting strong profitability
- Favorable ROIC and WACC supporting capital efficiency
- Leading brands like Olive Garden and LongHorn Steakhouse
- Favorable interest coverage and dividend yield
- Stable revenue from fine dining and casual segments
Starbucks Weaknesses
- Negative ROE and unfavorable net margin signal profitability issues
- High debt to assets ratio at 83% poses financial risk
- Low current and quick ratios indicate liquidity concerns
- Unfavorable P/E suggests overvaluation
- Negative debt/equity ratio flags capital structure concerns
Darden Weaknesses
- Low current and quick ratios reflect liquidity constraints
- Unfavorable debt/equity ratio points to higher leverage
- Unfavorable price-to-book ratio may indicate valuation risk
- Neutral asset turnover suggests room for operational improvement
The comparison highlights Starbucks’ global scale and operational efficiency offset by profitability and liquidity challenges. Darden excels in profitability and capital efficiency but faces liquidity and leverage risks. These factors will influence each company’s strategic priorities in managing growth and financial stability.
The Moat Duel: Analyzing Competitive Defensibility
A structural moat is the sole barrier protecting long-term profits from relentless competitive pressure and market erosion:
Starbucks Corporation: Brand Loyalty and Global Scale Moat
Starbucks leverages powerful brand loyalty and global footprint. Its high gross margins reflect pricing power. However, declining ROIC signals margin pressure that new markets in China may only partially offset in 2026.
Darden Restaurants, Inc.: Operational Efficiency and Portfolio Diversification Moat
Darden’s moat rests on operational scale and diverse restaurant brands. It consistently grows ROIC above WACC, signaling efficient capital use. Expansion into new concepts should deepen its moat and drive steady profit growth.
Brand Loyalty vs. Operational Scale: Who Defends Better?
Darden exhibits a wider, more durable moat with growing ROIC and expanding profits. Starbucks’ shrinking ROIC and margin contraction weaken its competitive edge. Darden is better equipped to defend market share in 2026.
Which stock offers better returns?
Over the past 12 months, both Starbucks and Darden Restaurants showed bullish price trends, with Darden demonstrating a stronger gain and higher volatility.
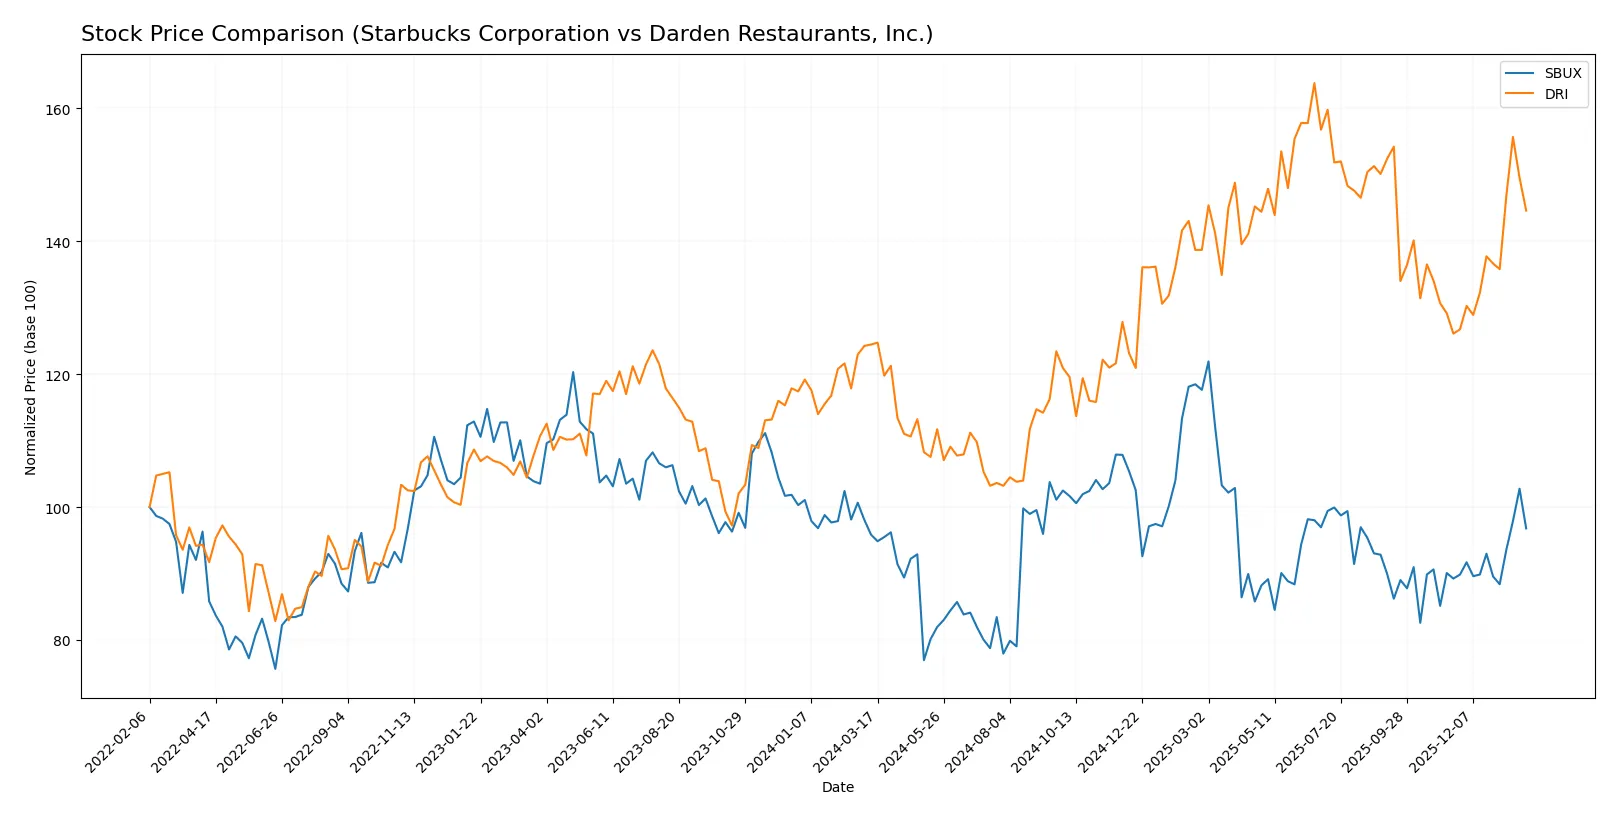
Trend Comparison
Starbucks stock rose 0.98% over the last year, indicating a mild bullish trend with accelerating momentum and a price range between 73.11 and 115.81.
Darden Restaurants stock surged 16.19% over the same period, reflecting a robust bullish trend with acceleration and a wider price range from 142.27 to 225.78.
Darden Restaurants delivered markedly higher returns and greater price movement than Starbucks during this timeframe.
Target Prices
Analysts present a clear consensus on target prices for Starbucks Corporation and Darden Restaurants, Inc.
| Company | Target Low | Target High | Consensus |
|---|---|---|---|
| Starbucks Corporation | 90 | 165 | 107.47 |
| Darden Restaurants, Inc. | 200 | 265 | 221.94 |
The target consensus for Starbucks sits modestly above the current price of 91.95, signaling cautious upside potential. Darden’s consensus target at 221.94 suggests a substantial premium over its 199.35 stock price, reflecting stronger analyst confidence in growth prospects.

Don’t Let Luck Decide Your Entry Point
Optimize your entry points with our advanced ProRealTime indicators. You’ll get efficient buy signals with precise price targets for maximum performance. Start outperforming now!
How do institutions grade them?
This section compares recent institutional grades for Starbucks Corporation and Darden Restaurants, Inc.:
Starbucks Corporation Grades
The table below summarizes recent grade actions by reputable institutions for Starbucks:
| Grading Company | Action | New Grade | Date |
|---|---|---|---|
| BTIG | Maintain | Buy | 2026-01-30 |
| Piper Sandler | Maintain | Overweight | 2026-01-30 |
| Barclays | Maintain | Overweight | 2026-01-30 |
| TD Cowen | Maintain | Hold | 2026-01-30 |
| Wells Fargo | Maintain | Overweight | 2026-01-29 |
| BTIG | Maintain | Buy | 2026-01-29 |
| RBC Capital | Maintain | Outperform | 2026-01-29 |
| Wells Fargo | Maintain | Overweight | 2026-01-27 |
| Mizuho | Maintain | Neutral | 2026-01-26 |
| William Blair | Upgrade | Outperform | 2026-01-23 |
Darden Restaurants, Inc. Grades
Recent institutional grades for Darden Restaurants are shown in the table below:
| Grading Company | Action | New Grade | Date |
|---|---|---|---|
| Mizuho | Upgrade | Outperform | 2026-01-23 |
| Raymond James | Downgrade | Market Perform | 2026-01-21 |
| Truist Securities | Downgrade | Hold | 2026-01-08 |
| Barclays | Maintain | Overweight | 2026-01-07 |
| BMO Capital | Maintain | Market Perform | 2026-01-06 |
| Mizuho | Maintain | Neutral | 2025-12-22 |
| BTIG | Maintain | Buy | 2025-12-19 |
| Stephens & Co. | Maintain | Equal Weight | 2025-12-19 |
| Guggenheim | Maintain | Buy | 2025-12-17 |
| Jefferies | Maintain | Hold | 2025-12-15 |
Which company has the best grades?
Starbucks generally holds stronger and more consistent buy and overweight grades compared to Darden. This could signal greater institutional confidence in Starbucks. Investors might view Starbucks as having a more favorable consensus outlook.
Risks specific to each company
The following categories identify the critical pressure points and systemic threats facing both firms in the 2026 market environment:
1. Market & Competition
Starbucks Corporation
- Faces intense global competition; premium pricing may limit market share expansion.
Darden Restaurants, Inc.
- Strong U.S. presence but limited international diversification could constrain growth.
2. Capital Structure & Debt
Starbucks Corporation
- High debt-to-assets ratio (83.1%) signals leverage risk despite favorable interest coverage.
Darden Restaurants, Inc.
- Moderate debt-to-assets (49.5%) but unfavorable debt-to-equity ratio weakens balance sheet.
3. Stock Volatility
Starbucks Corporation
- Beta near 1 (0.96) indicates market-level volatility; stock price range is wide.
Darden Restaurants, Inc.
- Lower beta (0.64) suggests defensive traits; less sensitive to market swings.
4. Regulatory & Legal
Starbucks Corporation
- Global operations expose Starbucks to diverse regulatory risks and compliance costs.
Darden Restaurants, Inc.
- Primarily U.S.-focused, reducing complexity but still vulnerable to domestic regulations.
5. Supply Chain & Operations
Starbucks Corporation
- Complex international supply chains risk disruption from geopolitical and climate factors.
Darden Restaurants, Inc.
- More concentrated supply chain in North America; operational disruptions could be more localized.
6. ESG & Climate Transition
Starbucks Corporation
- Increasing pressure to meet ambitious sustainability goals amid consumer scrutiny.
Darden Restaurants, Inc.
- Facing growing ESG expectations but less publicly scrutinized than global peers.
7. Geopolitical Exposure
Starbucks Corporation
- Significant international footprint heightens exposure to geopolitical tensions.
Darden Restaurants, Inc.
- Limited geopolitical risk due to domestic U.S. operations focus.
Which company shows a better risk-adjusted profile?
Darden Restaurants demonstrates a stronger risk-adjusted profile. Starbucks faces critical leverage risks and high exposure to geopolitical and regulatory complexities. Darden’s lower volatility, stronger profitability metrics, and concentrated operations provide more stability. However, its debt structure remains a concern. Starbucks’ elevated debt-to-assets ratio and unfavorable profitability scores demand caution amid global uncertainties.
Final Verdict: Which stock to choose?
Starbucks showcases a superpower in brand recognition and global footprint, enabling premium pricing and scale efficiencies. However, its declining ROIC and stretched balance sheet signal a point of vigilance. It fits best in aggressive growth portfolios willing to tolerate operational and financial headwinds for potential long-term payoffs.
Darden Restaurants possesses a robust strategic moat through diversified, stable cash flows and improving profitability metrics. Its growing ROIC and favorable income trends suggest better capital allocation discipline. Compared to Starbucks, Darden offers a safer profile, appealing to GARP investors who seek quality growth with moderate risk.
If you prioritize high-growth potential and are comfortable navigating financial volatility, Starbucks could be the compelling choice due to its brand leverage and market presence. However, if you seek durable profitability and better stability, Darden outshines with a proven value-creating moat and improving fundamentals, although it commands a premium valuation.
Disclaimer: Investment carries a risk of loss of initial capital. The past performance is not a reliable indicator of future results. Be sure to understand risks before making an investment decision.
Go Further
I encourage you to read the complete analyses of Starbucks Corporation and Darden Restaurants, Inc. to enhance your investment decisions: