In the competitive world of restaurant chains, McDonald’s Corporation and Darden Restaurants, Inc. stand out as two significant players with distinct strategies. Both companies operate in the restaurant industry, yet McDonald’s focuses on fast food while Darden excels in full-service dining with multiple brand portfolios. This comparison will help investors understand which company offers the most compelling investment opportunity in today’s evolving market landscape. Let’s explore which one deserves a place in your portfolio.

Table of contents
Companies Overview
I will begin the comparison between McDonald’s Corporation and Darden Restaurants, Inc. by providing an overview of these two companies and their main differences.
McDonald’s Overview
McDonald’s Corporation operates and franchises fast-food restaurants globally, offering a diverse menu including burgers, chicken items, breakfast, beverages, and desserts. Founded in 1940 and headquartered in Chicago, McDonald’s is a leading player in the quick-service restaurant industry, with over 40,000 locations as of 2021, focusing on convenience and consistency in its offerings.
Darden Overview
Darden Restaurants, Inc. owns and operates full-service dining establishments primarily in the US and Canada, managing multiple brands such as Olive Garden and LongHorn Steakhouse. Founded in 1968 and based in Orlando, Darden emphasizes a range of casual and upscale dining experiences across nearly 1,900 restaurants, blending brand diversity with focused geographic presence.
Key similarities and differences
Both McDonald’s and Darden operate in the consumer cyclical sector within the restaurant industry, yet they target different market segments: McDonald’s specializes in fast food with a global footprint, while Darden focuses on full-service, multi-brand dining primarily in North America. Their business models differ in scale and service style, with McDonald’s leveraging franchising extensively and Darden balancing owned and franchised restaurants.
Income Statement Comparison
The table below summarizes the key income statement metrics for McDonald’s Corporation and Darden Restaurants, Inc. for their most recent fiscal years, providing a direct financial comparison.

| Metric | McDonald’s Corporation | Darden Restaurants, Inc. |
|---|---|---|
| Market Cap | 220B | 23.6B |
| Revenue | 25.9B (2024) | 12.1B (2025) |
| EBITDA | 13.9B (2024) | 1.88B (2025) |
| EBIT | 11.85B (2024) | 1.37B (2025) |
| Net Income | 8.22B (2024) | 1.05B (2025) |
| EPS | 11.45 (2024) | 8.93 (2025) |
| Fiscal Year | 2024 | 2025 |
Income Statement Interpretations
McDonald’s Corporation
McDonald’s revenue grew steadily from 19.2B in 2020 to 25.9B in 2024, with net income rising from 4.7B to 8.2B over the same period. Margins remain robust, with a gross margin of 56.75% and net margin at 31.72% in 2024. However, recent growth slowed, shown by a 1.67% revenue rise and a 4.5% decline in net margin in 2024.
Darden Restaurants, Inc.
Darden’s revenue increased from 7.2B in 2021 to 12.1B in 2025, with net income climbing from 629M to 1.05B. Margins are lower than McDonald’s but stable, with a gross margin of 21.88% and net margin of 8.69% in 2025. The latest year showed moderate revenue growth of 6.03%, though net margin contracted by 3.67%.
Which one has the stronger fundamentals?
McDonald’s demonstrates higher profitability margins and greater net income scale, though recent margin and earnings growth have weakened. Darden shows stronger overall revenue growth and positive EPS expansion, with fewer unfavorable margin declines. Both companies present a favorable income statement profile, with McDonald’s excelling in margin strength and Darden in growth consistency.
Financial Ratios Comparison
Below is a comparison of key financial ratios for McDonald’s Corporation (MCD) and Darden Restaurants, Inc. (DRI) based on the most recent available data.
| Ratios | McDonald’s Corporation (2024) | Darden Restaurants, Inc. (2025) |
|---|---|---|
| ROE | -2.17% | 45.41% |
| ROIC | 17.92% | 11.40% |
| P/E | 25.32 | 22.84 |
| P/B | -54.85 | 10.37 |
| Current Ratio | 1.19 | 0.42 |
| Quick Ratio | 1.18 | 0.28 |
| D/E (Debt-to-Equity) | -13.68 | 2.70 |
| Debt-to-Assets | 94.14% | 49.49% |
| Interest Coverage | 7.78 | 7.55 |
| Asset Turnover | 0.47 | 0.96 |
| Fixed Asset Turnover | 0.67 | 1.46 |
| Payout Ratio | 59.22% | 62.74% |
| Dividend Yield | 2.34% | 2.75% |
Interpretation of the Ratios
McDonald’s Corporation
McDonald’s shows a mix of strengths and weaknesses in its ratios. It has a strong net margin of 31.72% and favorable returns on invested capital (17.92%) and weighted average cost of capital (5.64%). However, its negative return on equity (-216.62%) and high debt to assets ratio (94.14%) are concerning. The company maintains a stable dividend yield of 2.34%, supported by solid free cash flow coverage, with manageable risks related to its capital structure.
Darden Restaurants, Inc.
Darden’s financial ratios reflect moderate strength, with favorable return on equity (45.41%) and return on invested capital (11.4%), while net margin (8.69%) and price-to-earnings ratio (22.84) are neutral. Concerns include weak liquidity ratios (current ratio 0.42, quick ratio 0.28) and elevated debt-to-equity (2.7). The dividend yield of 2.75% is supported but must be weighed against liquidity constraints and debt levels.
Which one has the best ratios?
McDonald’s exhibits a more favorable overall ratio profile with 57.14% favorable metrics despite some leverage concerns, compared to Darden’s 35.71% favorable ratios and notable liquidity weaknesses. While McDonald’s faces challenges in equity returns, its profitability and dividend sustainability metrics are stronger. Darden’s liquidity and leverage ratios temper the benefits of its solid profitability ratios.
Strategic Positioning
This section compares the strategic positioning of McDonald’s Corporation and Darden Restaurants, Inc. focusing on Market position, Key segments, and Exposure to technological disruption:
McDonald’s Corporation
- Leading global fast-food chain with 40,031 restaurants, facing moderate competitive pressure.
- Key segments include US ($10.6B), High-Growth Markets ($12.6B), and International Licensed Markets ($2.7B).
- Exposure to technological disruption is not explicitly detailed in the data provided.
Darden Restaurants, Inc.
- Operates 1,867 full-service restaurants, facing competitive pressure in casual and fine dining segments.
- Key segments are Olive Garden ($5.2B), LongHorn Steakhouse ($3.0B), and Fine Dining ($1.3B).
- Exposure to technological disruption is not explicitly detailed in the data provided.
McDonald’s Corporation vs Darden Restaurants, Inc. Positioning
McDonald’s pursues a diversified global strategy targeting fast food across multiple regions, while Darden concentrates on full-service dining with a portfolio of branded restaurants. McDonald’s scale offers broad market reach; Darden focuses on brand specialization and segment differentiation.
Which has the best competitive advantage?
Both companies demonstrate growing ROIC above WACC, indicating strong competitive advantages. McDonald’s has a higher ROIC premium and larger scale, suggesting a more durable and favorable economic moat.
Stock Comparison
The past year exhibited distinct bullish trends for both McDonald’s Corporation and Darden Restaurants, Inc., with notable price increases and accelerating momentum shaping their trading dynamics.
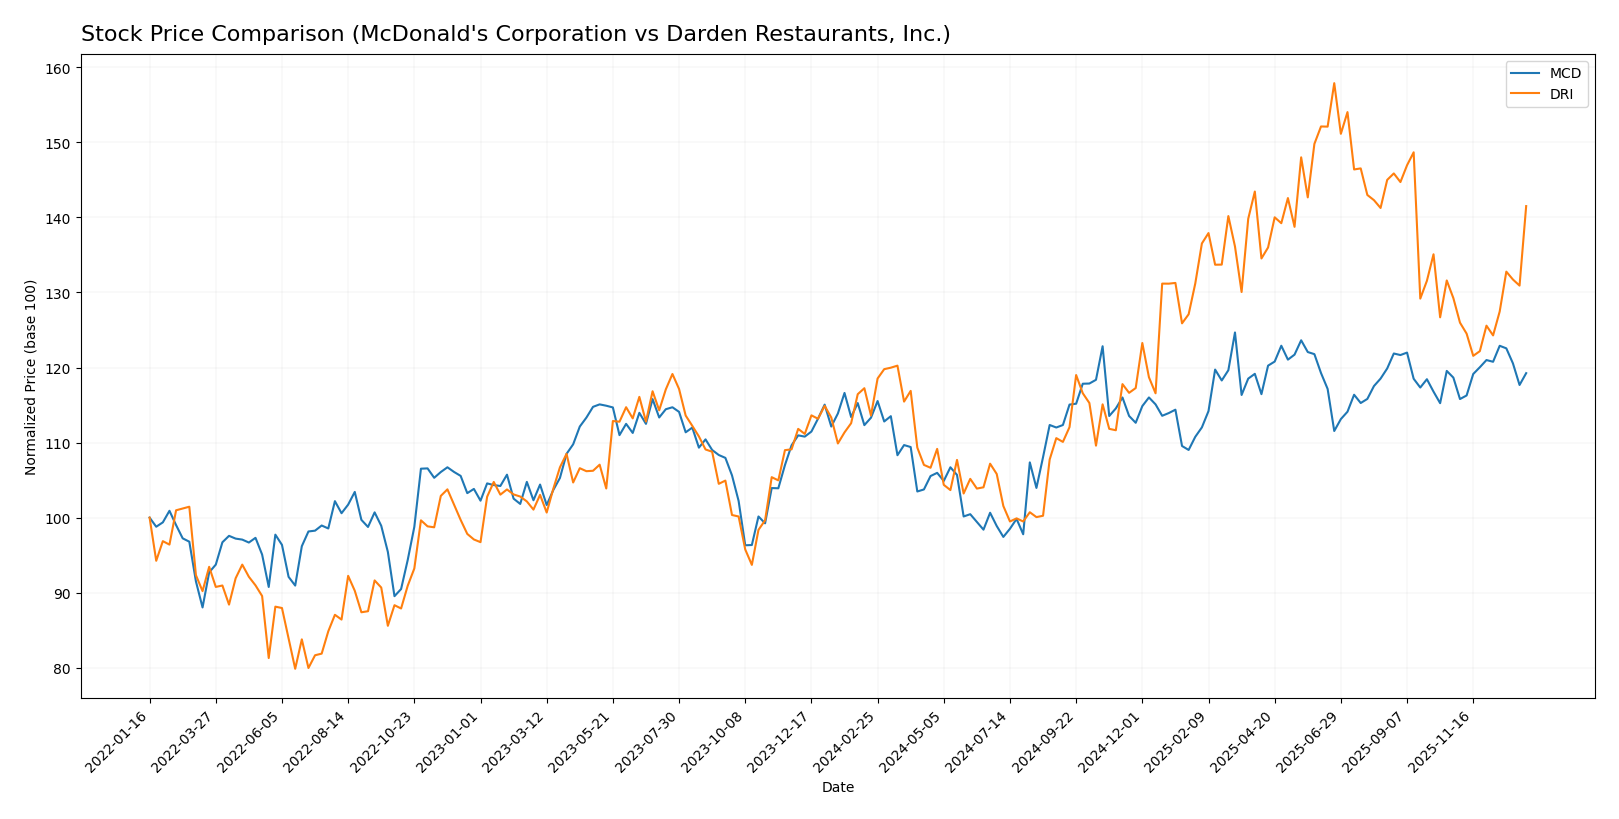
Trend Analysis
McDonald’s stock showed a 5.24% price increase over the past 12 months, indicating a bullish trend with acceleration. The stock fluctuated between a low of 251.09 and a high of 321.29, with a standard deviation of 17.87.
Darden Restaurants delivered a stronger bullish trend with a 24.56% gain over the same period, also accelerating. The price ranged from 142.27 to 225.78, with higher volatility reflected by a 22.39 standard deviation.
Comparing the two, Darden Restaurants outperformed McDonald’s in market performance, posting the highest price appreciation and stronger recent gains.
Target Prices
Analysts present a clear target price consensus for both McDonald’s Corporation and Darden Restaurants, Inc.
| Company | Target High | Target Low | Consensus |
|---|---|---|---|
| McDonald’s Corporation | 372 | 295 | 334.17 |
| Darden Restaurants, Inc. | 236 | 195 | 216.75 |
The consensus target prices suggest upside potential for both stocks compared to current prices: McDonald’s at $307.32 versus a $334.17 consensus, and Darden at $202.36 versus a $216.75 consensus. This indicates moderate analyst optimism.
Analyst Opinions Comparison
This section compares analysts’ ratings and grades for McDonald’s Corporation and Darden Restaurants, Inc.:
Rating Comparison
McDonald’s Rating
- Rating: B-, considered very favorable overall.
- Discounted Cash Flow Score: 4, indicating favorable valuation based on cash flow.
- ROE Score: 1, reflecting very unfavorable efficiency in generating profit from equity.
- ROA Score: 5, showing very favorable asset utilization.
- Debt To Equity Score: 1, indicating very unfavorable financial risk profile.
- Overall Score: 2, categorized as moderate.
Darden Restaurants Rating
- Rating: B+, considered very favorable overall.
- Discounted Cash Flow Score: 4, indicating favorable valuation based on cash flow.
- ROE Score: 5, reflecting very favorable efficiency in generating profit from equity.
- ROA Score: 5, showing very favorable asset utilization.
- Debt To Equity Score: 1, indicating very unfavorable financial risk profile.
- Overall Score: 3, categorized as moderate.
Which one is the best rated?
Darden Restaurants holds a higher overall rating (B+) and superior scores in return on equity compared to McDonald’s (B-). Both share favorable discounted cash flow and asset utilization scores, but McDonald’s has weaker equity efficiency.
Scores Comparison
Here is a comparison of the Altman Z-Score and Piotroski Score for McDonald’s Corporation and Darden Restaurants, Inc.:
MCD Scores
- Altman Z-Score: 4.87, indicating a safe zone with low bankruptcy risk.
- Piotroski Score: 7, reflecting strong financial health.
DRI Scores
- Altman Z-Score: 2.35, indicating a grey zone with moderate bankruptcy risk.
- Piotroski Score: 7, reflecting strong financial health.
Which company has the best scores?
McDonald’s exhibits a higher Altman Z-Score placing it firmly in the safe zone, while Darden’s score falls in the grey zone. Both have the same Piotroski Score of 7, indicating comparable financial strength.
Grades Comparison
Here is the comparison of recent grades assigned to McDonald’s Corporation and Darden Restaurants, Inc.:
McDonald’s Corporation Grades
This table summarizes recent grades from notable financial institutions for McDonald’s Corporation:
| Grading Company | Action | New Grade | Date |
|---|---|---|---|
| Keybanc | Maintain | Overweight | 2026-01-09 |
| TD Cowen | Maintain | Hold | 2026-01-08 |
| Truist Securities | Maintain | Buy | 2026-01-08 |
| Barclays | Maintain | Overweight | 2026-01-07 |
| Oppenheimer | Upgrade | Outperform | 2026-01-06 |
| Guggenheim | Maintain | Neutral | 2025-11-19 |
| Wells Fargo | Maintain | Overweight | 2025-11-06 |
| Baird | Maintain | Neutral | 2025-11-06 |
| Barclays | Maintain | Overweight | 2025-11-06 |
| BTIG | Maintain | Neutral | 2025-10-24 |
McDonald’s grades show a consistent positive trend with multiple “Overweight” and “Buy” ratings, including a recent upgrade to “Outperform”.
Darden Restaurants, Inc. Grades
This table summarizes recent grades from notable financial institutions for Darden Restaurants, Inc.:
| Grading Company | Action | New Grade | Date |
|---|---|---|---|
| Truist Securities | Downgrade | Hold | 2026-01-08 |
| Barclays | Maintain | Overweight | 2026-01-07 |
| BMO Capital | Maintain | Market Perform | 2026-01-06 |
| Mizuho | Maintain | Neutral | 2025-12-22 |
| Stephens & Co. | Maintain | Equal Weight | 2025-12-19 |
| BTIG | Maintain | Buy | 2025-12-19 |
| Guggenheim | Maintain | Buy | 2025-12-17 |
| Jefferies | Maintain | Hold | 2025-12-15 |
| Morgan Stanley | Maintain | Overweight | 2025-12-12 |
| Stephens & Co. | Maintain | Equal Weight | 2025-12-11 |
Darden’s ratings are mixed with a recent downgrade from “Buy” to “Hold” by Truist Securities, while other firms maintain neutral to positive views.
Which company has the best grades?
Both McDonald’s and Darden Restaurants carry a consensus “Buy” rating, but McDonald’s displays a stronger and more consistent pattern of upgrades and “Overweight” ratings. This suggests McDonald’s may currently enjoy slightly more favorable analyst sentiment, which could impact investor confidence and portfolio positioning.
Strengths and Weaknesses
The table below summarizes key strengths and weaknesses of McDonald’s Corporation and Darden Restaurants, Inc. based on their latest financial and operational metrics.
| Criterion | McDonald’s Corporation (MCD) | Darden Restaurants, Inc. (DRI) |
|---|---|---|
| Diversification | Strong diversification with significant revenues from U.S. (10.6B), High-Growth Markets (12.6B), and International Licensed Markets (2.7B) | Moderate diversification across Olive Garden (5.2B), LongHorn Steakhouse (3.0B), and Fine Dining (1.3B) segments |
| Profitability | High net margin (31.7%), strong ROIC (17.9%), but negative ROE (-216.6%) and high debt-to-assets (94.1%) | Moderate net margin (8.7%), good ROE (45.4%) and ROIC (11.4%), moderate debt levels (49.5%) |
| Innovation | Demonstrates durable competitive advantage with very favorable moat status and growing ROIC (+56.9%) | Also shows very favorable moat with growing ROIC (+58.0%), indicating efficient capital use and innovation |
| Global presence | Extensive global footprint including U.S., High-Growth, and International markets | Primarily U.S.-focused with multiple restaurant brands, less global exposure |
| Market Share | Leading fast-food market share globally with strong brand recognition | Strong presence in casual dining with notable share in fine dining and casual segments |
In summary, McDonald’s exhibits robust global diversification, high profitability, and a durable competitive moat but carries high leverage risk. Darden shows solid profitability and efficient capital use with a diverse brand portfolio but has less geographic diversification and liquidity concerns. Investors should weigh global reach and financial stability against leverage risks when choosing between these companies.
Risk Analysis
Below is a comparative risk assessment table for McDonald’s Corporation (MCD) and Darden Restaurants, Inc. (DRI) based on the most recent financial and operational data available for 2024 and 2025.
| Metric | McDonald’s Corporation (MCD) | Darden Restaurants, Inc. (DRI) |
|---|---|---|
| Market Risk | Low beta (0.53) indicates lower volatility; stable dividend yield (2.34%) | Moderate beta (0.64) with stable dividend yield (2.75%) |
| Debt level | High debt-to-assets ratio (94.14%), but favorable interest coverage (7.87) | Moderate debt-to-assets (49.49%), but weak liquidity ratios (current 0.42, quick 0.28) |
| Regulatory Risk | Moderate, global operations subject to varying food and labor regulations | Moderate, mostly U.S. and Canada with similar regulatory environment |
| Operational Risk | Large scale with 40K+ restaurants, complexity manageable due to franchise model | Smaller scale (1,867 restaurants), higher operational concentration risk |
| Environmental Risk | Moderate, exposure to sustainability pressures in food sourcing and packaging | Moderate, similar pressures but less diversified supply chain |
| Geopolitical Risk | Global presence exposes to diverse geopolitical risks | Primarily North American, lower geopolitical risk |
The most significant risks for McDonald’s are its high leverage and debt-to-assets ratio, which, despite good interest coverage, could impact financial flexibility under adverse conditions. Darden faces liquidity concerns and operational concentration risk due to fewer locations but benefits from a lower overall debt burden. Both companies face moderate regulatory and environmental risks, with McDonald’s additionally exposed to broader geopolitical factors due to its global footprint.
Which Stock to Choose?
McDonald’s Corporation (MCD) shows favorable income evolution with a 34.95% revenue growth over 2020-2024 and strong profitability, despite a slight decline in recent margins. Its financial ratios are mostly favorable, with strong free cash flow yield and a very favorable global evaluation, though it carries high debt and a negative ROE, earning a very favorable rating.
Darden Restaurants, Inc. (DRI) presents solid income growth of 67.82% over 2021-2025 and maintains favorable profitability metrics, though net margin growth is slightly negative. Financial ratios are slightly favorable overall, with good ROE and moderate debt levels, supported by a very favorable rating and a stable credit profile.
For investors prioritizing durable competitive advantage and profitability, McDonald’s might appear more favorable given its very favorable global ratios and moat status. Conversely, those valuing higher ROE and recent income growth might find Darden’s profile slightly more appealing, reflecting different risk and growth preferences.
Disclaimer: Investment carries a risk of loss of initial capital. The past performance is not a reliable indicator of future results. Be sure to understand risks before making an investment decision.
Go Further
I encourage you to read the complete analyses of McDonald’s Corporation and Darden Restaurants, Inc. to enhance your investment decisions: